| Param | Original file | Final file |
|---|---|---|
| Filename | modeM0/AS1G06_117T01_9000001086_07941cztM0_level2.evt | modeM0/AS1G06_117T01_9000001086_07941cztM0_level2_quad_clean.evt |
| Size (bytes) | 479,877,120 | 89,089,920 |
| Size | 457.6 MB | 85.0 MB |
| Events in quadrant A | 3,132,949 | 557,881 |
| Events in quadrant B | 3,707,087 | 561,440 |
| Events in quadrant C | 3,457,869 | 565,298 |
| Events in quadrant D | 3,774,018 | 540,268 |
| Mode M9 | |||
|---|---|---|---|
| Quadrant | BADHDUFLAG | Total packets | Discarded packets |
| A | 0 | 18 | 0 |
| B | 0 | 18 | 0 |
| C | 0 | 18 | 0 |
| D | 0 | 18 | 0 |
| Mode SS | |||
|---|---|---|---|
| Quadrant | BADHDUFLAG | Total packets | Discarded packets |
| A | 0 | 140 | 0 |
| B | 0 | 140 | 0 |
| C | 0 | 140 | 0 |
| D | 0 | 140 | 0 |
| Mode M0 | |||
|---|---|---|---|
| Quadrant | BADHDUFLAG | Total packets | Discarded packets |
| A | 0 | 14004 | 3 |
| B | 0 | 15462 | 2 |
| C | 0 | 15014 | 2 |
| D | 0 | 15968 | 2 |
| Quadrant | Total seconds | Saturated seconds | Saturation percentage |
|---|---|---|---|
| A | 6786 | 86 | 1.267315% |
| B | 6786 | 235 | 3.463012% |
| C | 6786 | 144 | 2.122016% |
| D | 6786 | 134 | 1.974654% |
Noise dominated data is calculated using 1-second bins in cleaned event files. If a bin has >2000 counts, and if more than 50% of those come from <1% of pixels, then it is considered to be noise-dominated and hence unusable.
| Quadrant | # 1 sec bins | Bins with >0 counts | Bins with >2000 counts | High rate bins dominated by noise | Noise dominated (total time) | Noise dominated (detector-on time) | Marked lightcurve |
|---|---|---|---|---|---|---|---|
| A | 8621 | 6788 | 0 | 0 | 0.00% | 0.00% | 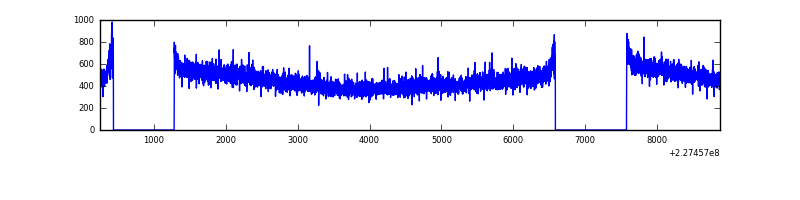 |
| B | 8621 | 6788 | 100 | 100 | 1.16% | 1.47% | 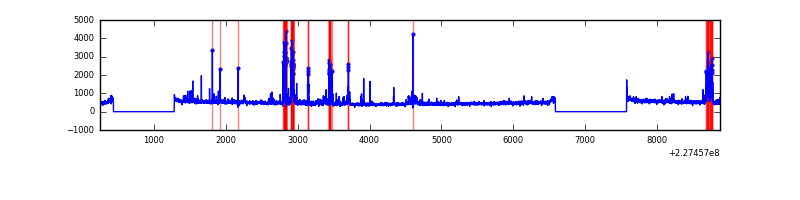 |
| C | 8621 | 6788 | 8 | 8 | 0.09% | 0.12% | 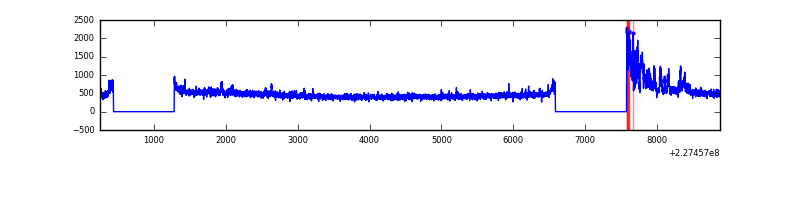 |
| D | 8621 | 6788 | 25 | 25 | 0.29% | 0.37% | 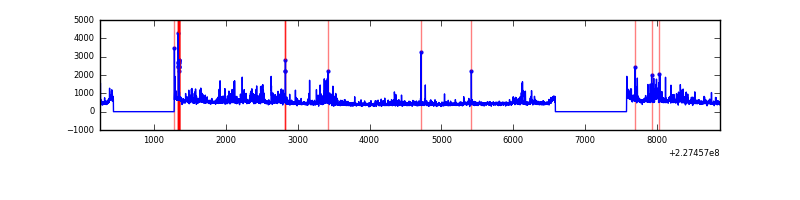 |
Top three noisy pixels from each quadrant. If the there are fewer than three noisy pixels in the level2.evt file, extra rows are filled as -1
| Pixel properties | Quadrant properties | ||||||
|---|---|---|---|---|---|---|---|
| Quadrant | DetID | PixID | Counts | Sigma | Mean | Median | Sigma |
| A | 0 | 226 | 7491 | 40.88 | 810 | 792 | 163.9 |
| A | 12 | 194 | 6984 | 37.79 | 810 | 792 | 163.9 |
| A | 13 | 253 | 5627 | 29.51 | 810 | 792 | 163.9 |
| B | 4 | 239 | 183555 | 1178.44 | 812 | 791 | 155.1 |
| B | 10 | 16 | 129854 | 832.19 | 812 | 791 | 155.1 |
| B | 4 | 81 | 78800 | 502.99 | 812 | 791 | 155.1 |
| C | 1 | 16 | 347275 | 1873.49 | 796 | 797 | 184.9 |
| C | 13 | 61 | 5882 | 27.5 | 796 | 797 | 184.9 |
| C | 12 | 4 | 2859 | 11.15 | 796 | 797 | 184.9 |
| D | 1 | 52 | 533407 | 2716.67 | 795 | 769 | 196.1 |
| D | 5 | 233 | 76100 | 384.22 | 795 | 769 | 196.1 |
| D | 2 | 152 | 52736 | 265.05 | 795 | 769 | 196.1 |
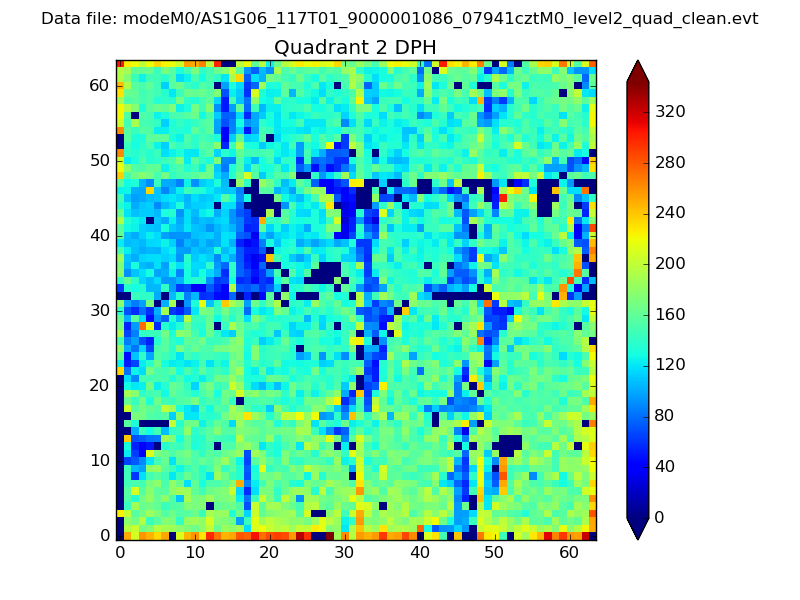
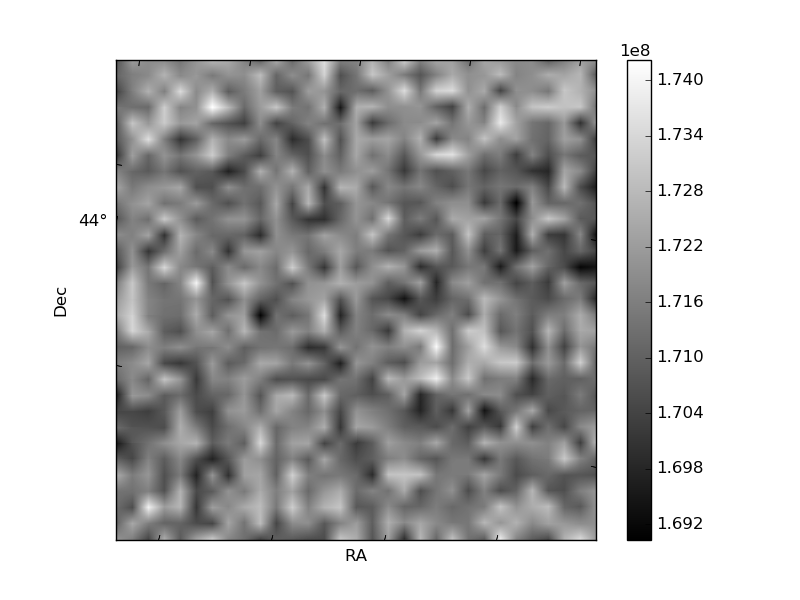
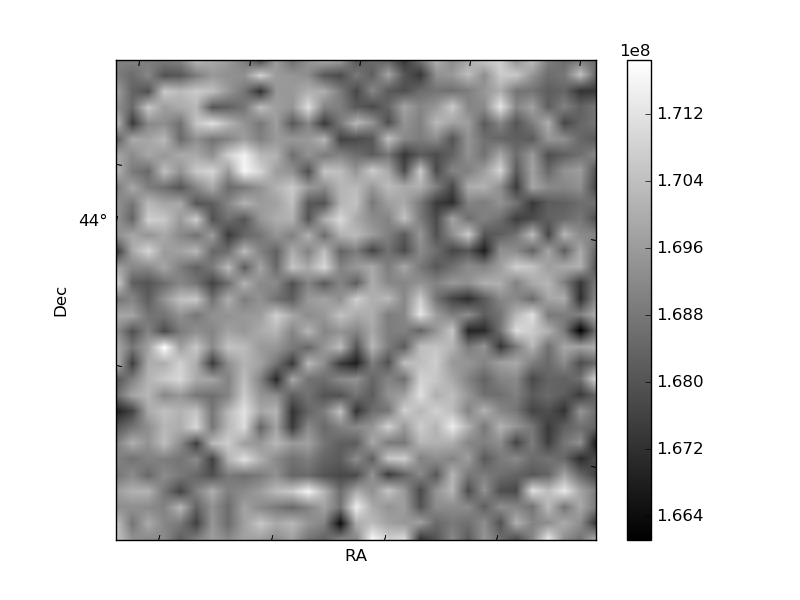
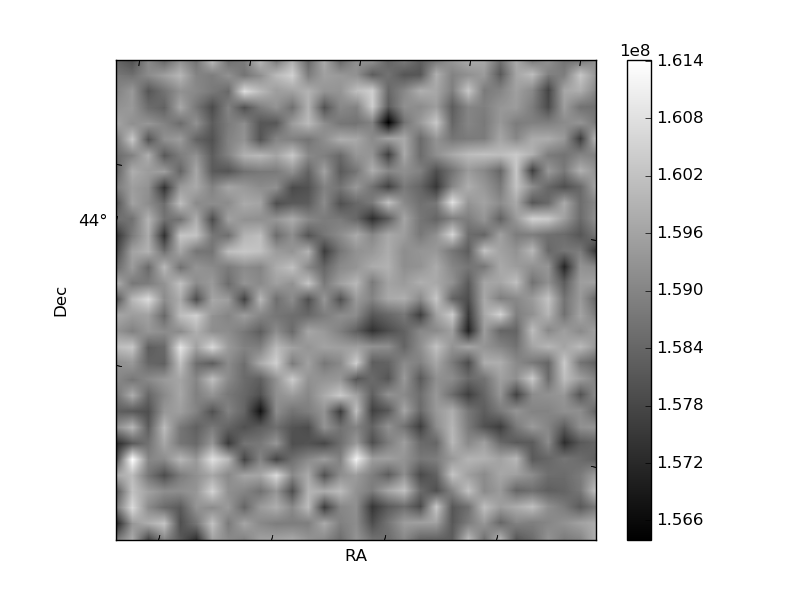
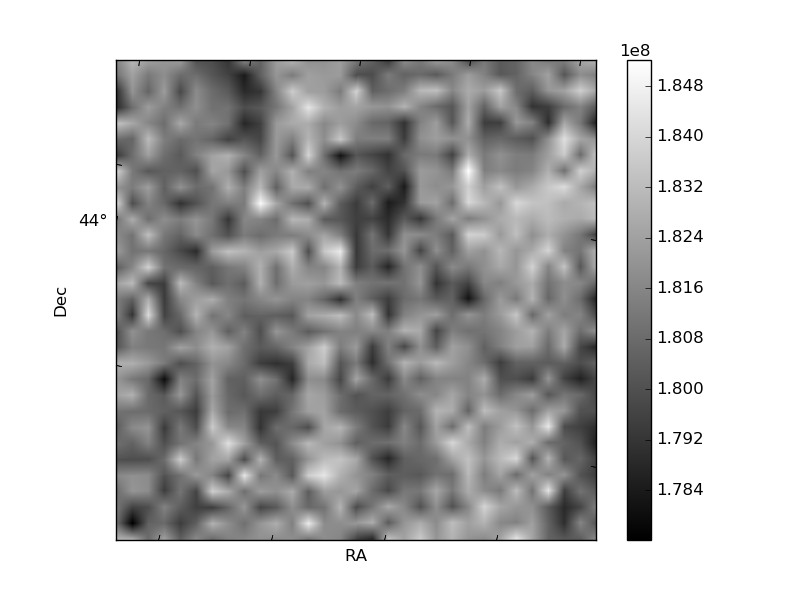
Histogram calculated using DETX and DETY for each event in the final _common_clean file
| Quadrant A | 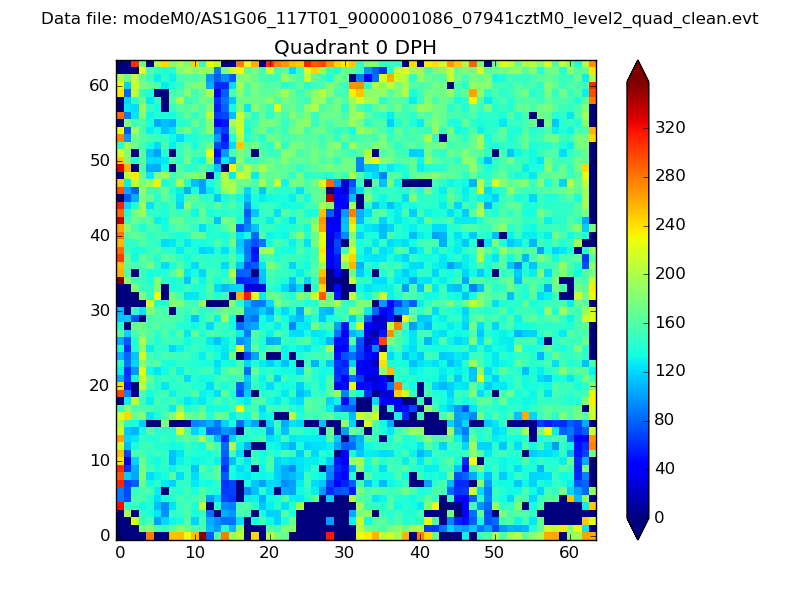 |
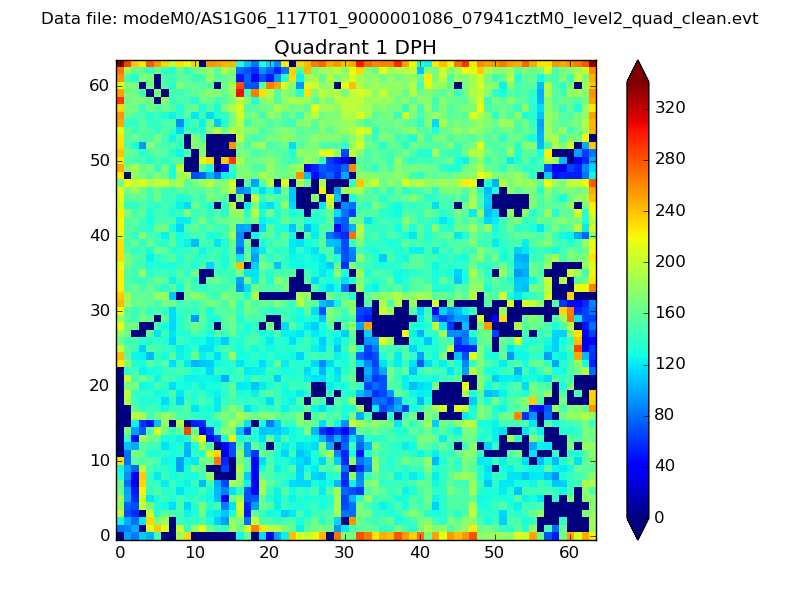 |
Quadrant B |
|---|---|---|---|
| Quadrant D | 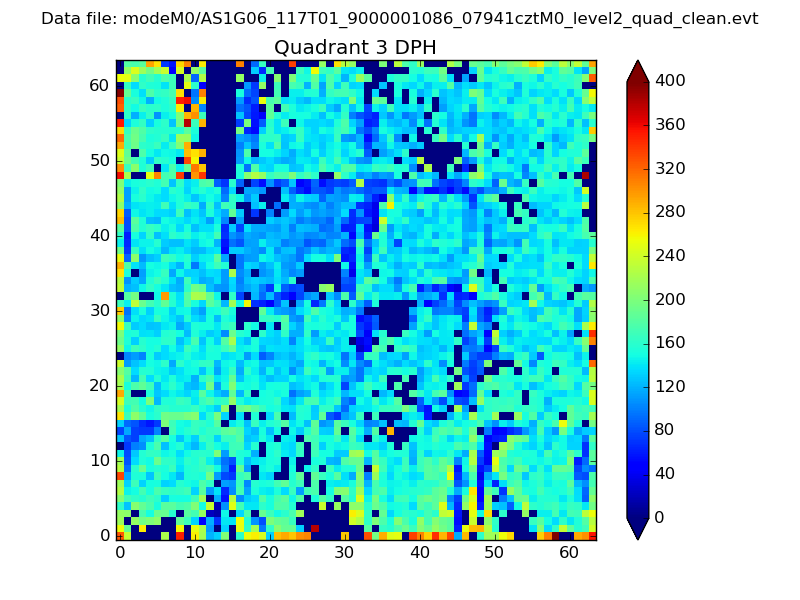 |
 |
Quadrant C |
| Plot type | Count rate plots | Images |
|---|---|---|
| Comparison with Poisson distribution Blue bars denote a histogram of data divided into 1 sec bins. Red curve is a Poisson curve with rate = median count rate of data. |
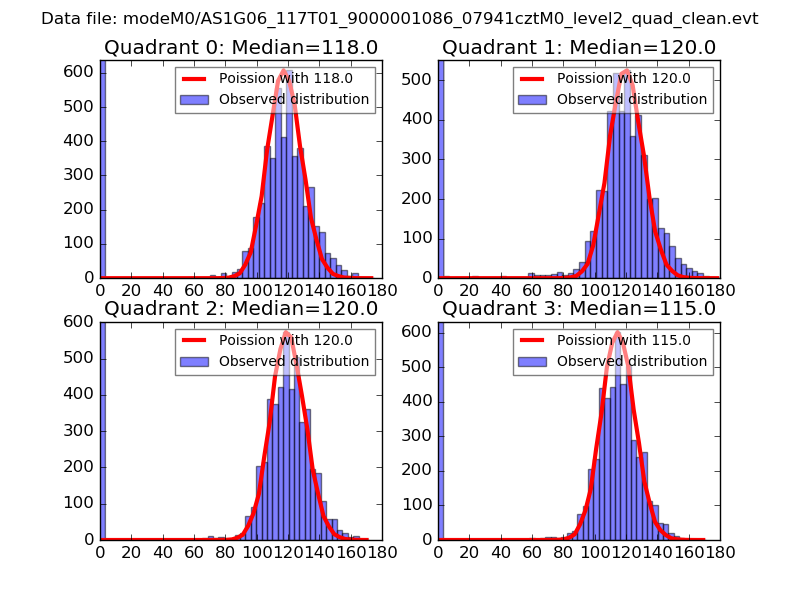 |
 |
| Quadrant-wise count rates Data is divided into 100 sec bins |
 |
|
| Module-wise count rates for Quadrant A Data is divided into 100 sec bins |
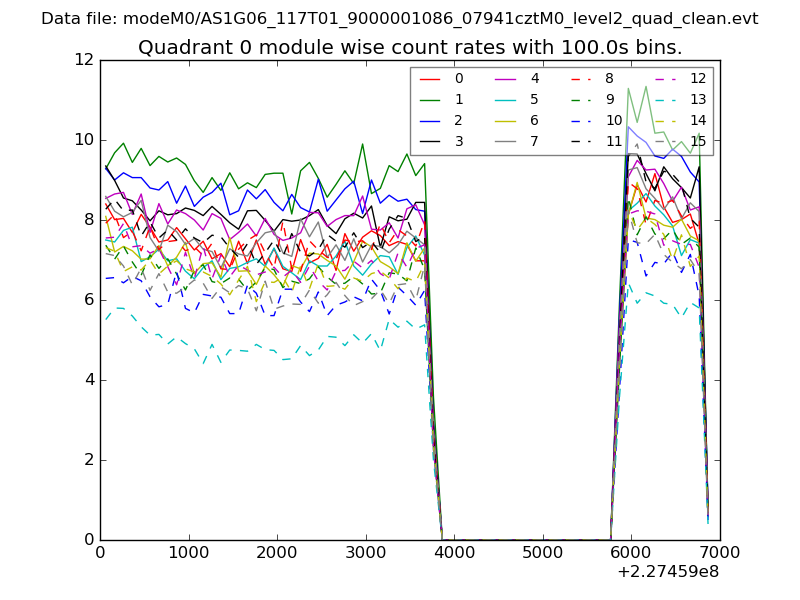 |
 |
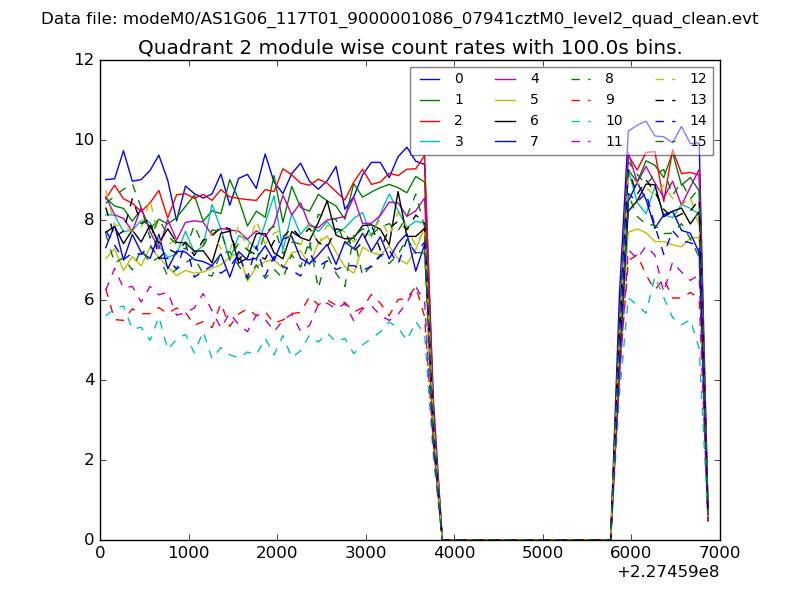
| Module-wise count rates for Quadrant B Data is divided into 100 sec bins |
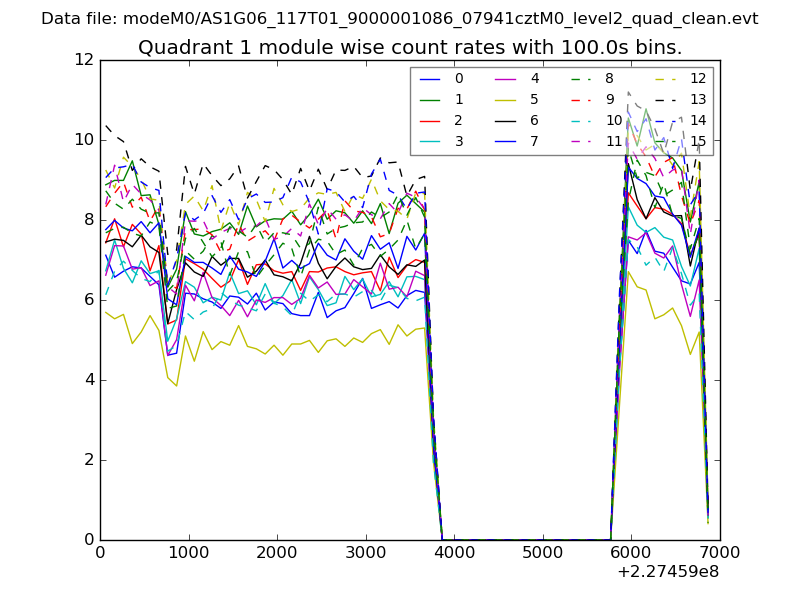 |
 |
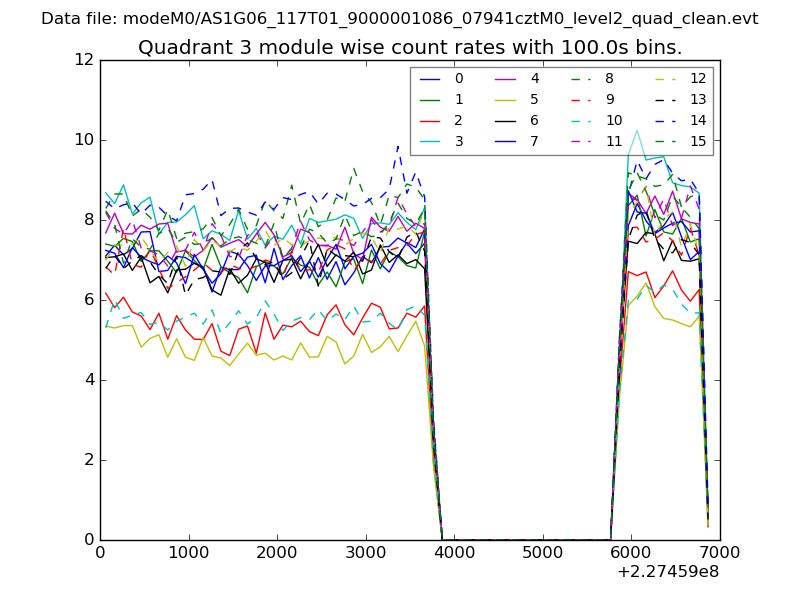
| Module-wise count rates for Quadrant C Data is divided into 100 sec bins |
 |
 |
| Module-wise count rates for Quadrant D Data is divided into 100 sec bins |
 |
 |
| Parameter | Plot |
|---|---|
| CZT HV Monitor | 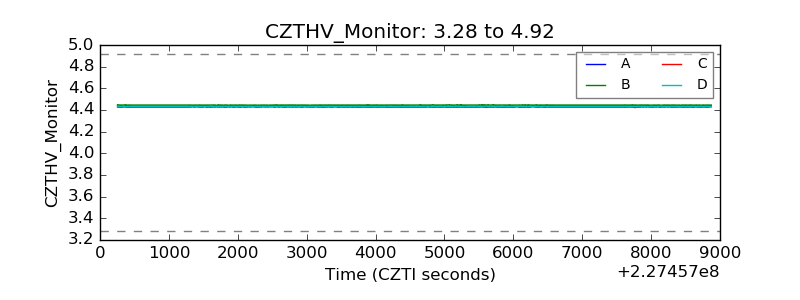 |
| D_VDD | 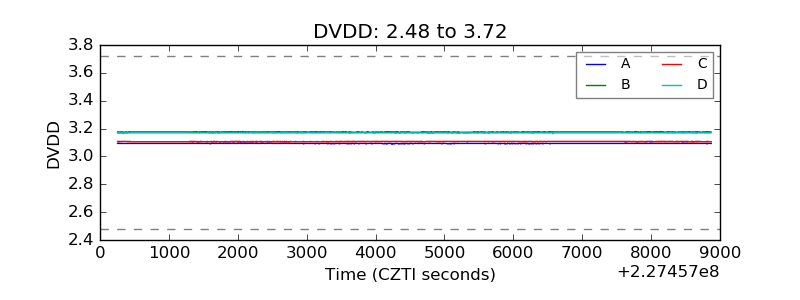 |
| Temperature 1 |  |
| Veto HV Monitor | 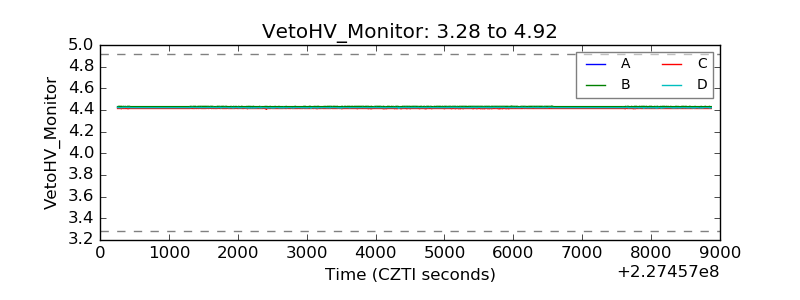 |
| Veto LLD | 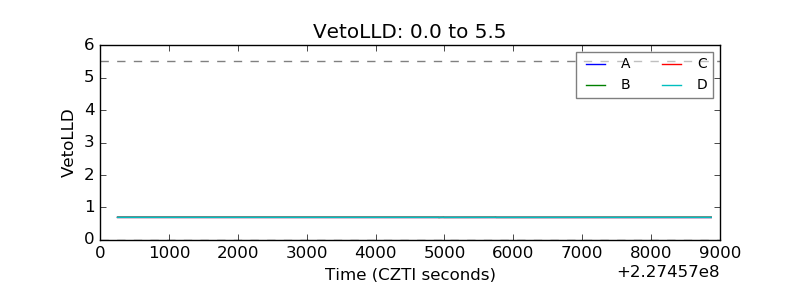 |
| Alpha Counter | 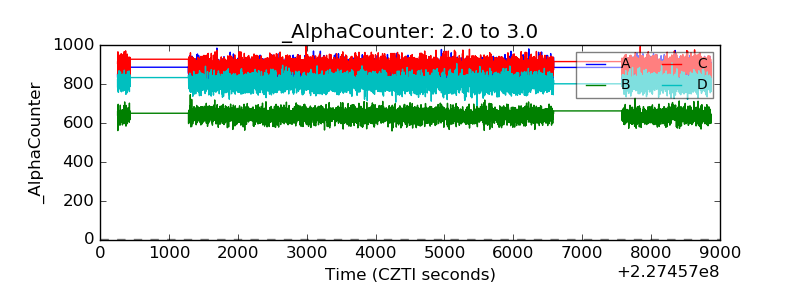 |
| _CPM_Rate |  |
| CZT Counter |  |
| +2.5 Volts monitor |  |
| +5 Volts monitor |  |
| _ROLL_ROT | 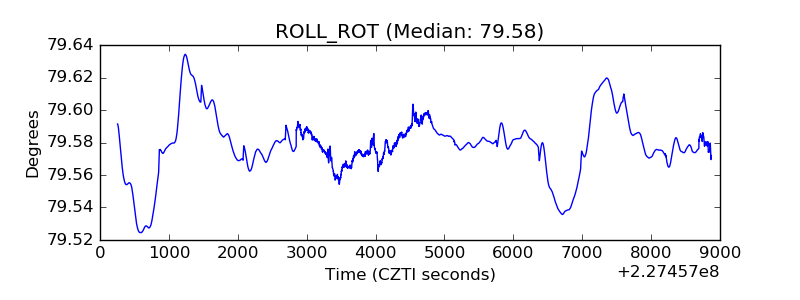 |
| _Roll_DEC | 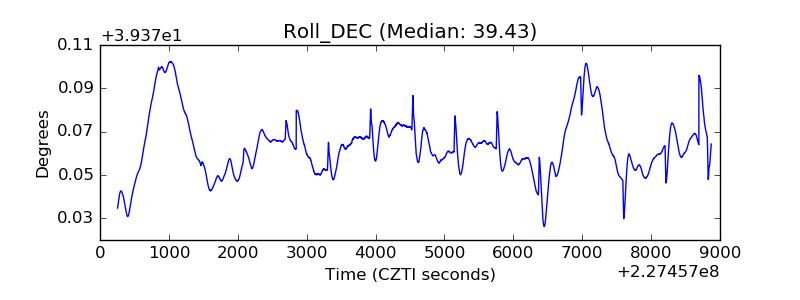 |
| _Roll_RA | 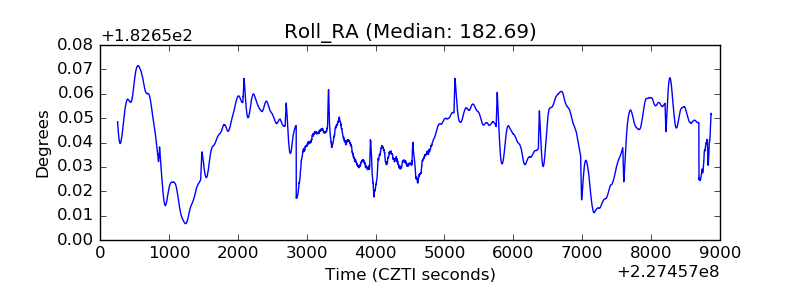 |
| Veto Counter | 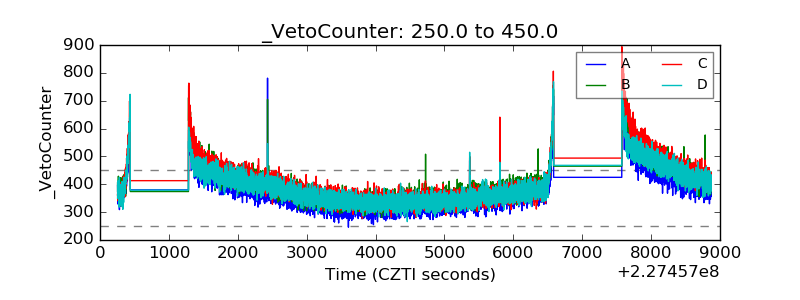 |