| Param | Original file | Final file |
|---|---|---|
| Filename | modeM0/AS1G06_117T01_9000001086_07945cztM0_level2.evt | modeM0/AS1G06_117T01_9000001086_07945cztM0_level2_quad_clean.evt |
| Size (bytes) | 448,799,040 | 97,963,200 |
| Size | 428.0 MB | 93.4 MB |
| Events in quadrant A | 3,112,027 | 620,417 |
| Events in quadrant B | 3,228,087 | 646,781 |
| Events in quadrant C | 3,152,550 | 646,192 |
| Events in quadrant D | 3,664,076 | 606,602 |
| Mode M9 | |||
|---|---|---|---|
| Quadrant | BADHDUFLAG | Total packets | Discarded packets |
| A | 0 | 26 | 0 |
| B | 0 | 26 | 0 |
| C | 0 | 26 | 0 |
| D | 0 | 26 | 0 |
| Mode SS | |||
|---|---|---|---|
| Quadrant | BADHDUFLAG | Total packets | Discarded packets |
| A | 0 | 132 | 0 |
| B | 0 | 132 | 0 |
| C | 0 | 132 | 0 |
| D | 0 | 132 | 0 |
| Mode M0 | |||
|---|---|---|---|
| Quadrant | BADHDUFLAG | Total packets | Discarded packets |
| A | 0 | 13590 | 3 |
| B | 0 | 13876 | 2 |
| C | 0 | 13661 | 2 |
| D | 0 | 15419 | 2 |
| Quadrant | Total seconds | Saturated seconds | Saturation percentage |
|---|---|---|---|
| A | 6405 | 23 | 0.359094% |
| B | 6405 | 53 | 0.827479% |
| C | 6405 | 17 | 0.265418% |
| D | 6405 | 58 | 0.905543% |
Noise dominated data is calculated using 1-second bins in cleaned event files. If a bin has >2000 counts, and if more than 50% of those come from <1% of pixels, then it is considered to be noise-dominated and hence unusable.
| Quadrant | # 1 sec bins | Bins with >0 counts | Bins with >2000 counts | High rate bins dominated by noise | Noise dominated (total time) | Noise dominated (detector-on time) | Marked lightcurve |
|---|---|---|---|---|---|---|---|
| A | 8995 | 6407 | 3 | 3 | 0.03% | 0.05% |  |
| B | 8995 | 6407 | 9 | 9 | 0.10% | 0.14% | 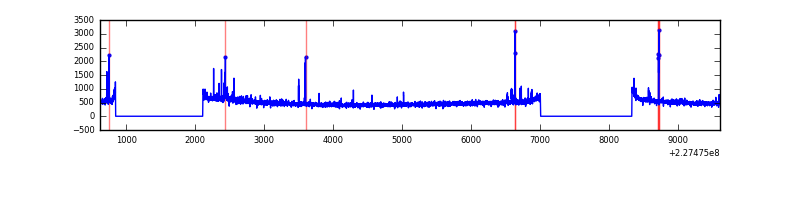 |
| C | 8995 | 6407 | 0 | 0 | 0.00% | 0.00% | 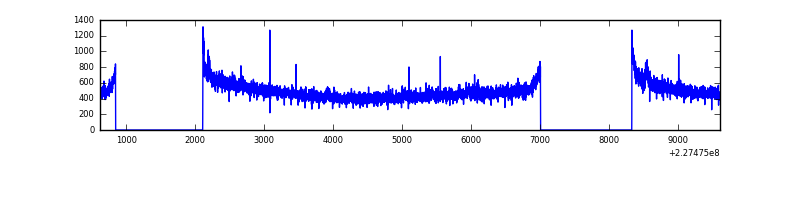 |
| D | 8995 | 6407 | 35 | 35 | 0.39% | 0.55% | 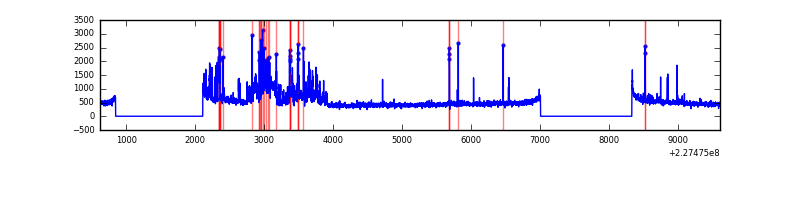 |
Top three noisy pixels from each quadrant. If the there are fewer than three noisy pixels in the level2.evt file, extra rows are filled as -1
| Pixel properties | Quadrant properties | ||||||
|---|---|---|---|---|---|---|---|
| Quadrant | DetID | PixID | Counts | Sigma | Mean | Median | Sigma |
| A | 15 | 234 | 61031 | 378.75 | 785 | 768 | 159.1 |
| A | 8 | 15 | 9643 | 55.78 | 785 | 768 | 159.1 |
| A | 0 | 226 | 7396 | 41.66 | 785 | 768 | 159.1 |
| B | 10 | 245 | 65898 | 435.28 | 800 | 781 | 149.6 |
| B | 11 | 51 | 25803 | 167.26 | 800 | 781 | 149.6 |
| B | 12 | 111 | 15881 | 100.94 | 800 | 781 | 149.6 |
| C | 1 | 16 | 81106 | 445.01 | 786 | 791 | 180.5 |
| C | 13 | 61 | 6112 | 29.48 | 786 | 791 | 180.5 |
| C | 14 | 67 | 2687 | 10.51 | 786 | 791 | 180.5 |
| D | 1 | 52 | 620435 | 3314.24 | 775 | 753 | 187.0 |
| D | 13 | 169 | 30561 | 159.42 | 775 | 753 | 187.0 |
| D | 12 | 233 | 28124 | 146.39 | 775 | 753 | 187.0 |
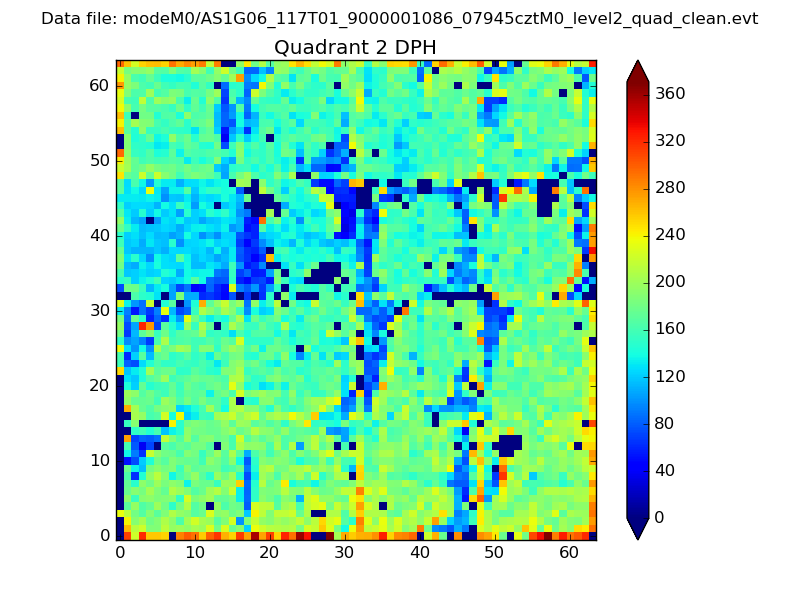
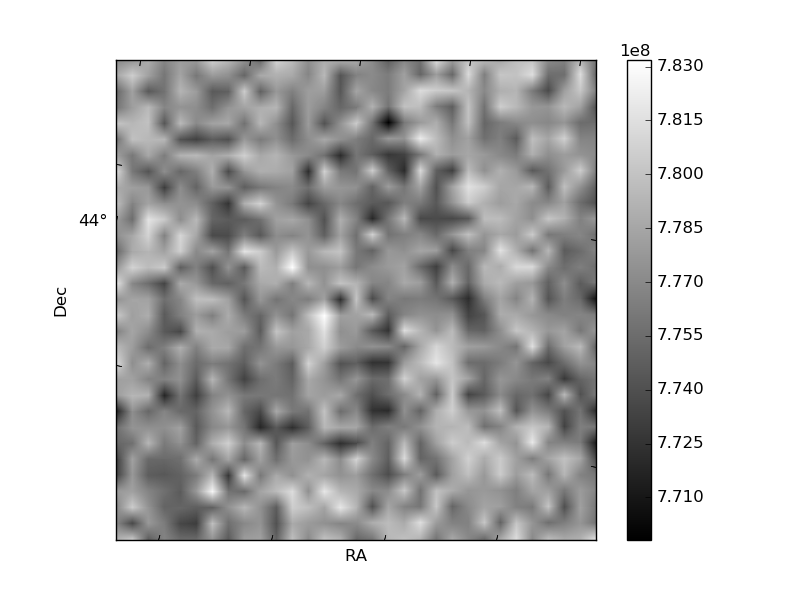
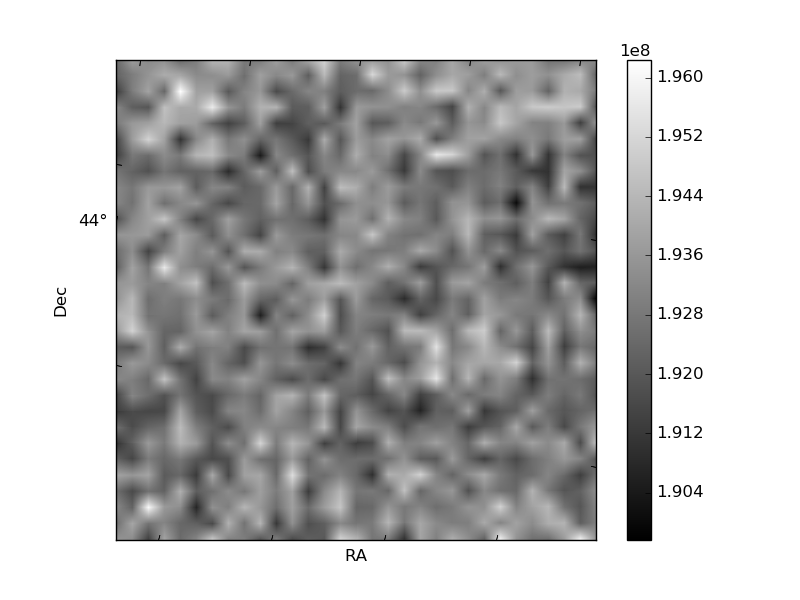
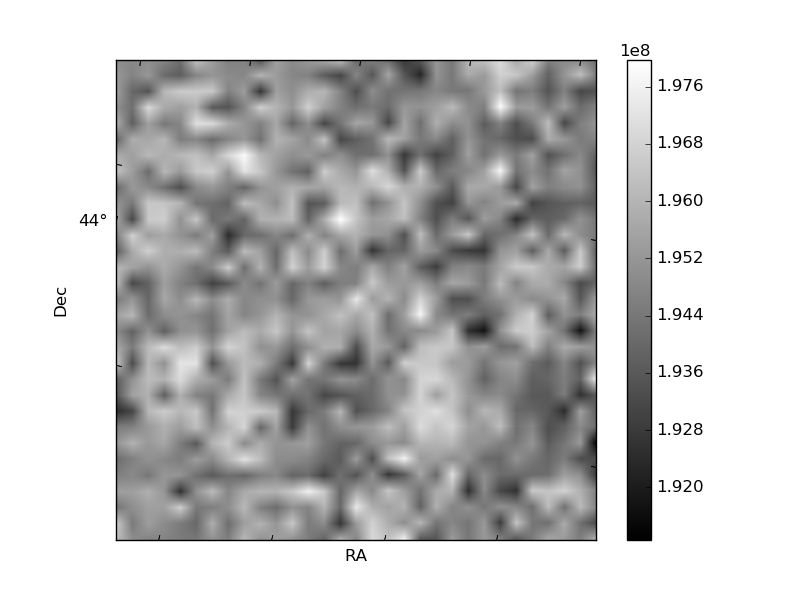
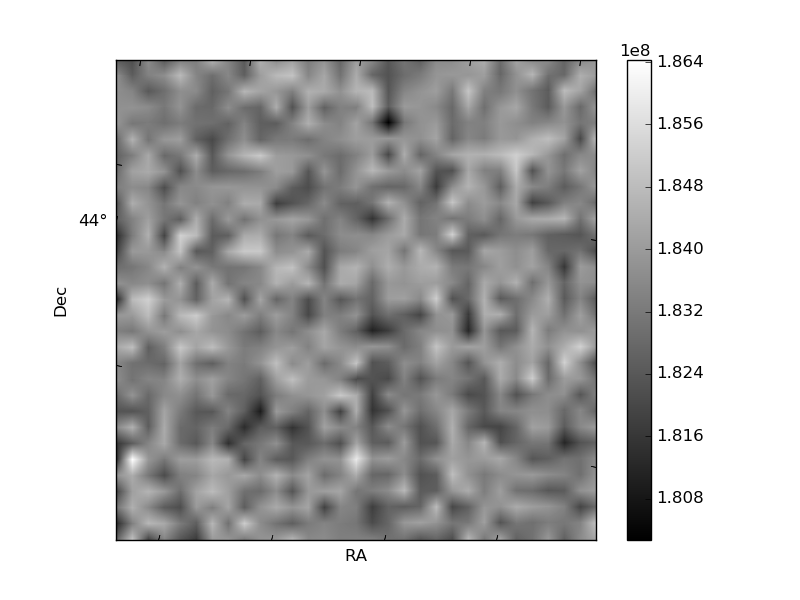
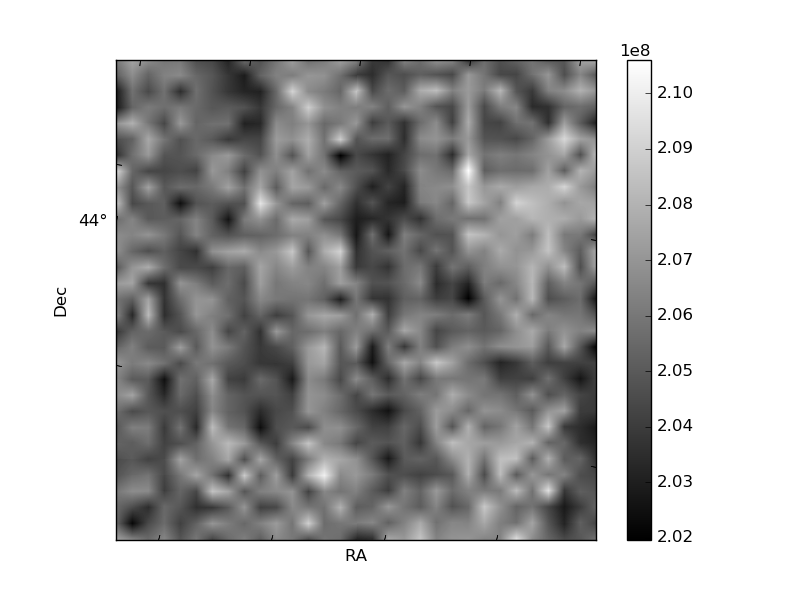
Histogram calculated using DETX and DETY for each event in the final _common_clean file
| Quadrant A |  |
 |
Quadrant B |
|---|---|---|---|
| Quadrant D |  |
 |
Quadrant C |
| Plot type | Count rate plots | Images |
|---|---|---|
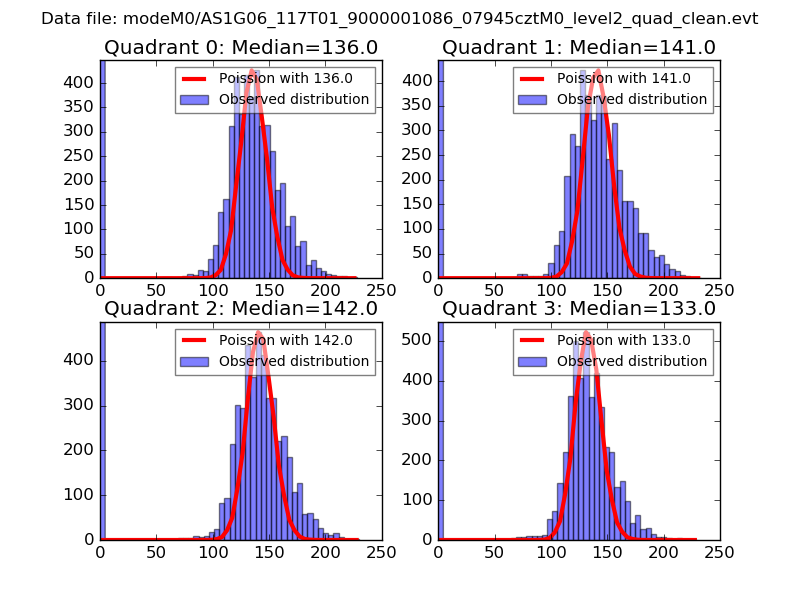
| Comparison with Poisson distribution Blue bars denote a histogram of data divided into 1 sec bins. Red curve is a Poisson curve with rate = median count rate of data. |
 |
 |
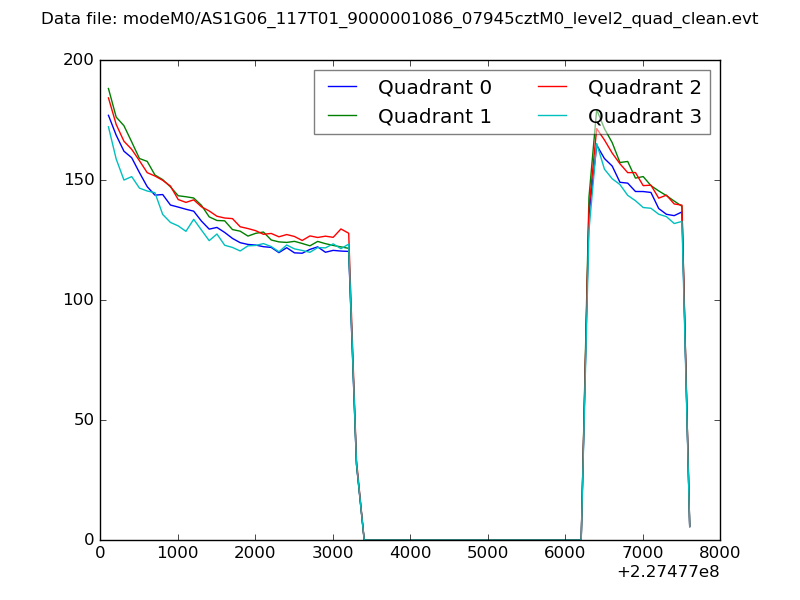
| Quadrant-wise count rates Data is divided into 100 sec bins |
 |
|
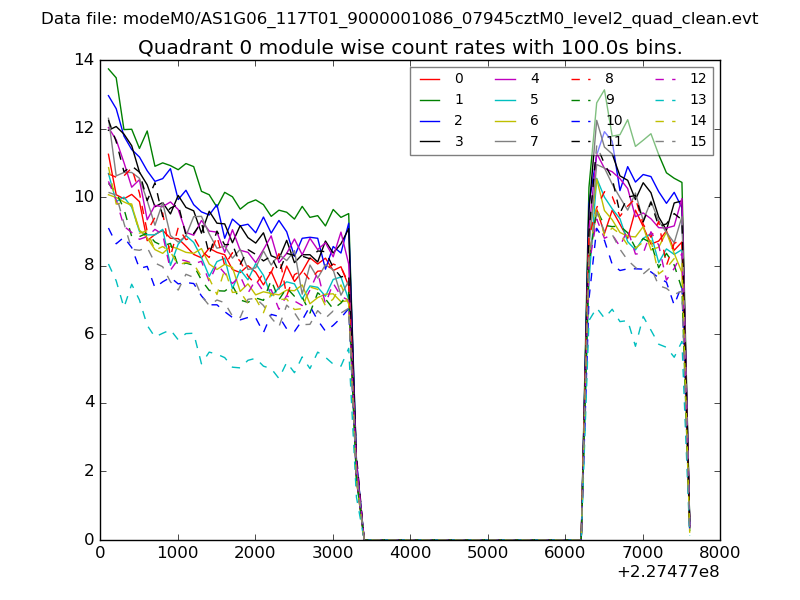
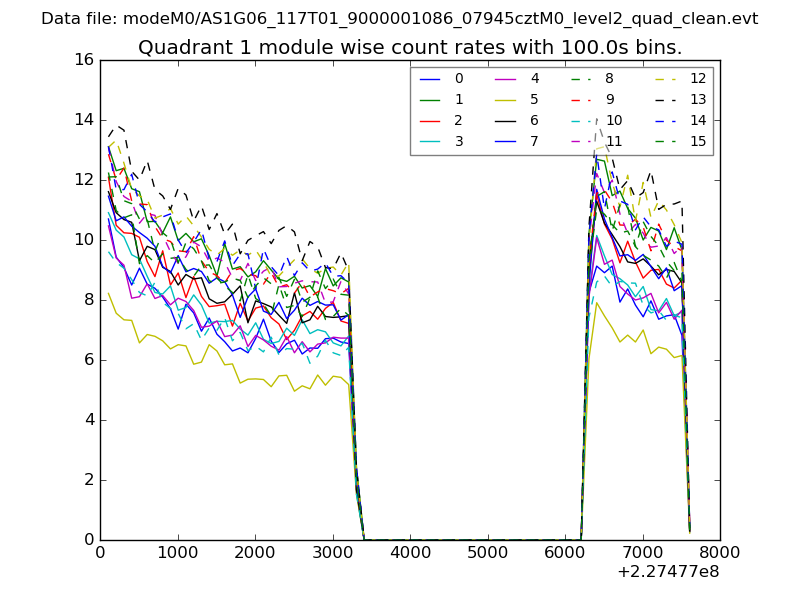
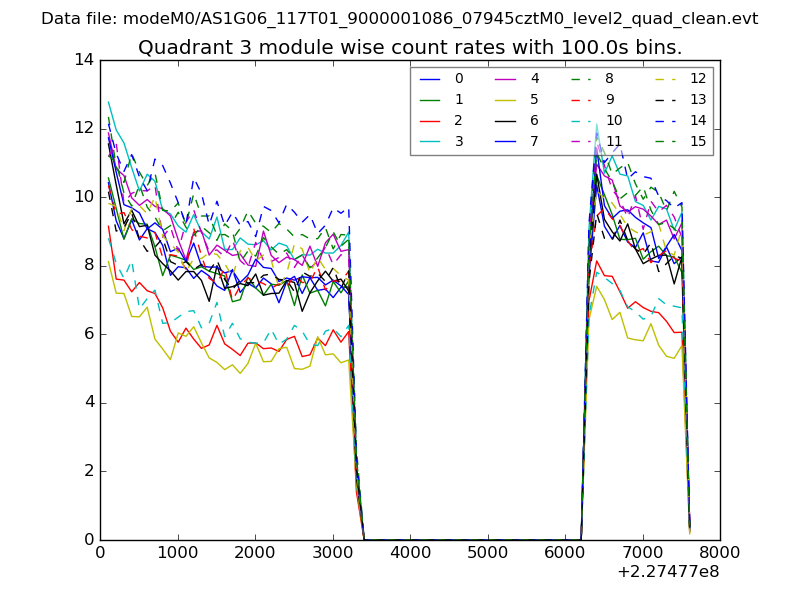
| Module-wise count rates for Quadrant A Data is divided into 100 sec bins |
 |
 |
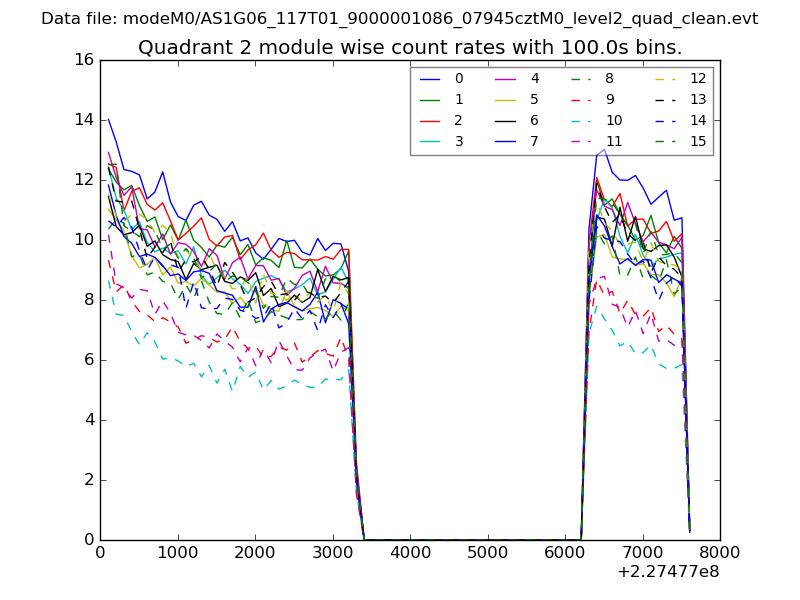
| Module-wise count rates for Quadrant B Data is divided into 100 sec bins |
 |
 |
| Module-wise count rates for Quadrant C Data is divided into 100 sec bins |
 |
 |
| Module-wise count rates for Quadrant D Data is divided into 100 sec bins |
 |
 |
| Parameter | Plot |
|---|---|
| CZT HV Monitor | 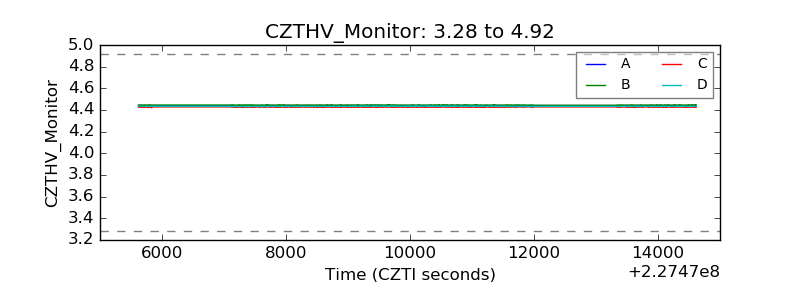 |
| D_VDD |  |
| Temperature 1 | 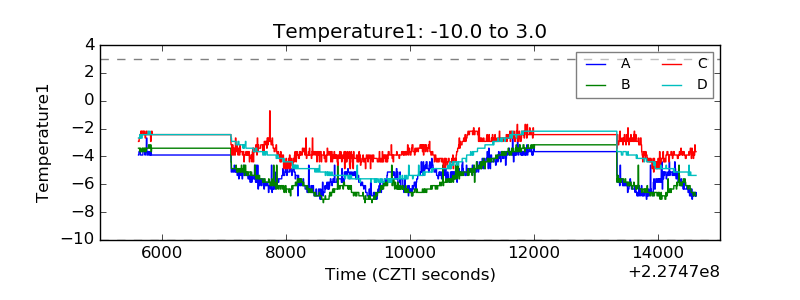 |
| Veto HV Monitor | 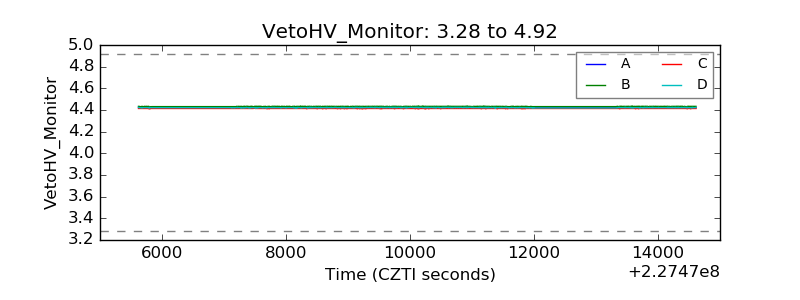 |
| Veto LLD | 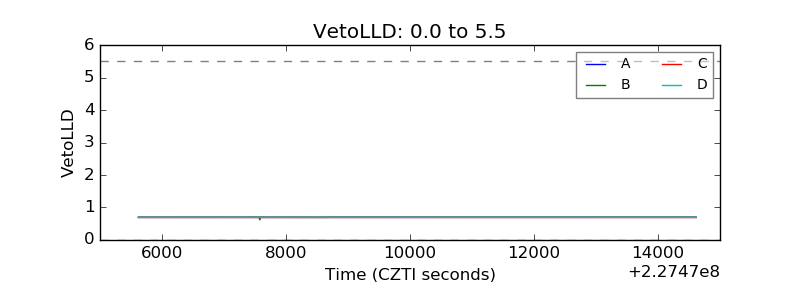 |
| Alpha Counter | 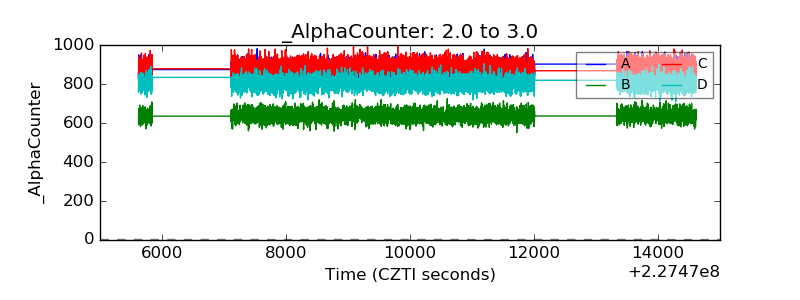 |
| _CPM_Rate | 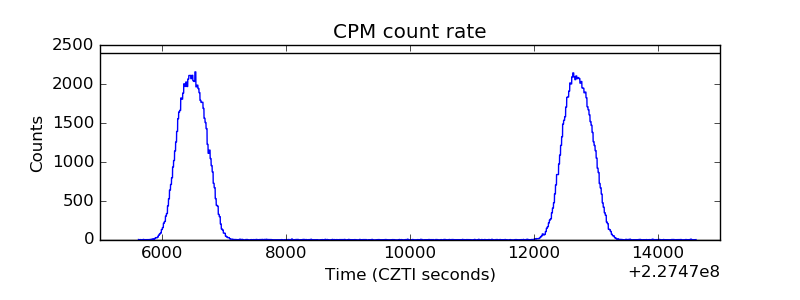 |
| CZT Counter | 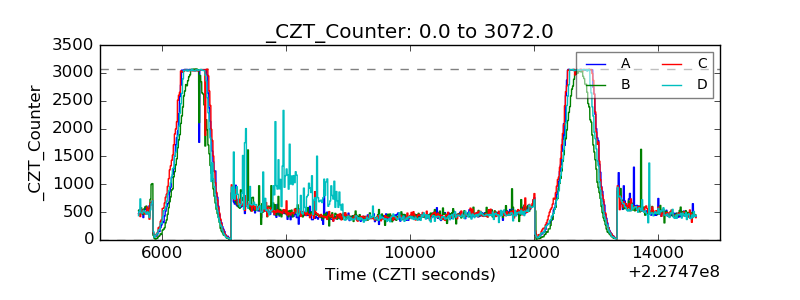 |
| +2.5 Volts monitor |  |
| +5 Volts monitor | 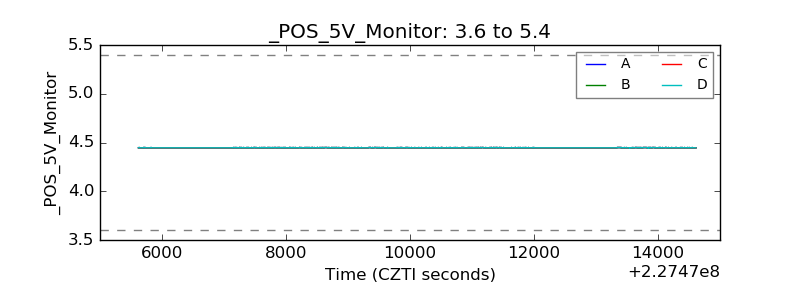 |
| _ROLL_ROT | 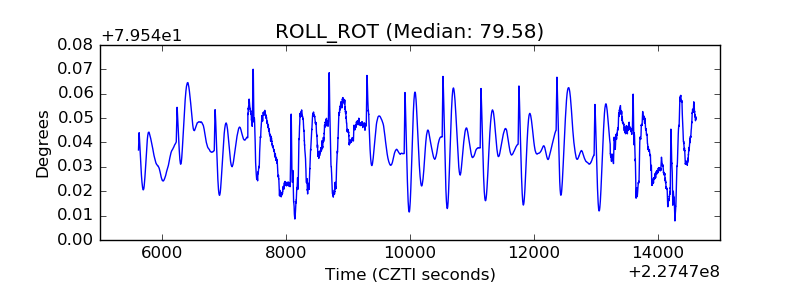 |
| _Roll_DEC | 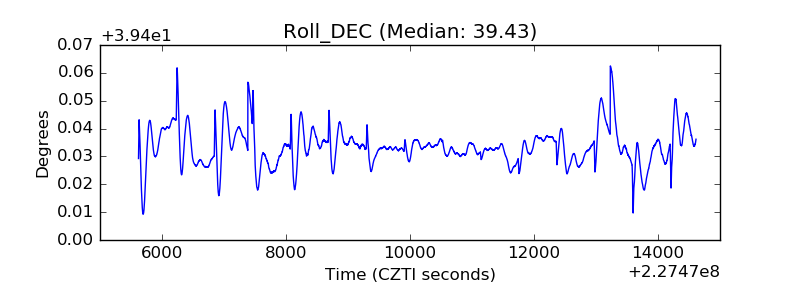 |
| _Roll_RA | 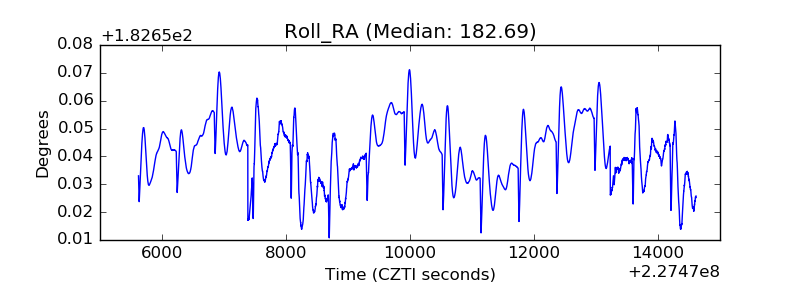 |
| Veto Counter | 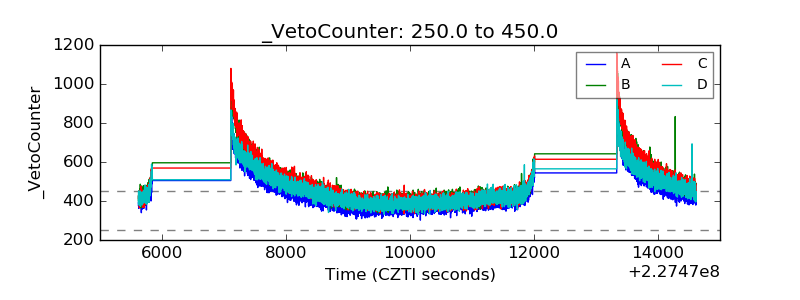 |