| Param | Original file | Final file |
|---|---|---|
| Filename | modeM0/AS1G06_117T01_9000001086_07946cztM0_level2.evt | modeM0/AS1G06_117T01_9000001086_07946cztM0_level2_quad_clean.evt |
| Size (bytes) | 440,674,560 | 90,884,160 |
| Size | 420.3 MB | 86.7 MB |
| Events in quadrant A | 3,452,836 | 568,025 |
| Events in quadrant B | 3,189,500 | 592,266 |
| Events in quadrant C | 3,127,094 | 588,098 |
| Events in quadrant D | 3,139,524 | 555,600 |
| Mode M9 | |||
|---|---|---|---|
| Quadrant | BADHDUFLAG | Total packets | Discarded packets |
| A | 0 | 26 | 0 |
| B | 0 | 26 | 0 |
| C | 0 | 26 | 0 |
| D | 0 | 26 | 0 |
| Mode SS | |||
|---|---|---|---|
| Quadrant | BADHDUFLAG | Total packets | Discarded packets |
| A | 0 | 132 | 0 |
| B | 0 | 132 | 0 |
| C | 0 | 132 | 0 |
| D | 0 | 132 | 0 |
| Mode M0 | |||
|---|---|---|---|
| Quadrant | BADHDUFLAG | Total packets | Discarded packets |
| A | 0 | 14678 | 3 |
| B | 0 | 13687 | 2 |
| C | 0 | 13580 | 2 |
| D | 0 | 13807 | 2 |
| Quadrant | Total seconds | Saturated seconds | Saturation percentage |
|---|---|---|---|
| A | 6427 | 134 | 2.084954% |
| B | 6427 | 64 | 0.995799% |
| C | 6427 | 30 | 0.466781% |
| D | 6427 | 18 | 0.280068% |
Noise dominated data is calculated using 1-second bins in cleaned event files. If a bin has >2000 counts, and if more than 50% of those come from <1% of pixels, then it is considered to be noise-dominated and hence unusable.
| Quadrant | # 1 sec bins | Bins with >0 counts | Bins with >2000 counts | High rate bins dominated by noise | Noise dominated (total time) | Noise dominated (detector-on time) | Marked lightcurve |
|---|---|---|---|---|---|---|---|
| A | 9067 | 6429 | 55 | 55 | 0.61% | 0.86% | 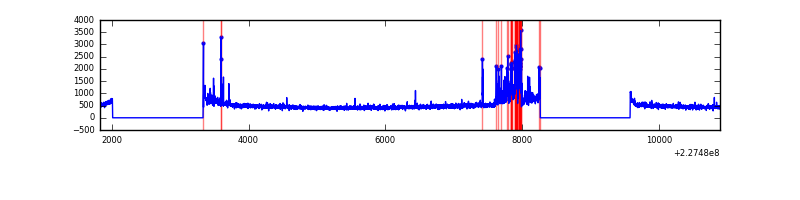 |
| B | 9067 | 6429 | 5 | 5 | 0.06% | 0.08% | 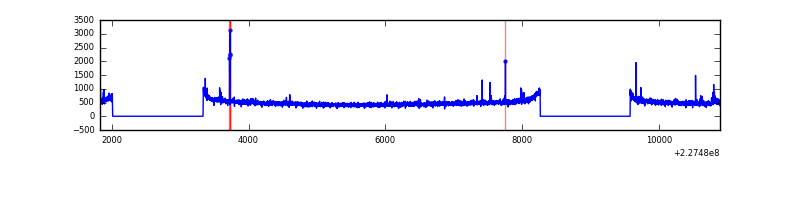 |
| C | 9067 | 6429 | 0 | 0 | 0.00% | 0.00% | 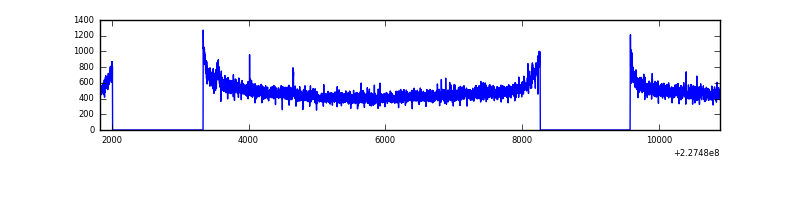 |
| D | 9067 | 6429 | 4 | 4 | 0.04% | 0.06% | 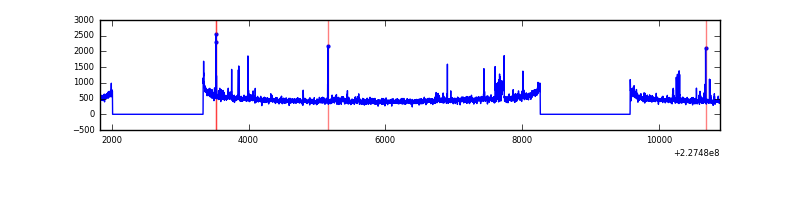 |
Top three noisy pixels from each quadrant. If the there are fewer than three noisy pixels in the level2.evt file, extra rows are filled as -1
| Pixel properties | Quadrant properties | ||||||
|---|---|---|---|---|---|---|---|
| Quadrant | DetID | PixID | Counts | Sigma | Mean | Median | Sigma |
| A | 15 | 234 | 423672 | 2691.81 | 782 | 764 | 157.1 |
| A | 13 | 251 | 8189 | 47.26 | 782 | 764 | 157.1 |
| A | 0 | 226 | 7229 | 41.15 | 782 | 764 | 157.1 |
| B | 5 | 255 | 31794 | 205.4 | 802 | 783 | 151.0 |
| B | 10 | 245 | 26331 | 169.22 | 802 | 783 | 151.0 |
| B | 12 | 111 | 16489 | 104.03 | 802 | 783 | 151.0 |
| C | 1 | 16 | 51495 | 280.17 | 784 | 789 | 181.0 |
| C | 14 | 67 | 9376 | 47.45 | 784 | 789 | 181.0 |
| C | 13 | 61 | 5955 | 28.54 | 784 | 789 | 181.0 |
| D | 1 | 52 | 130918 | 694.18 | 771 | 748 | 187.5 |
| D | 5 | 233 | 26012 | 134.73 | 771 | 748 | 187.5 |
| D | 13 | 169 | 23064 | 119.01 | 771 | 748 | 187.5 |
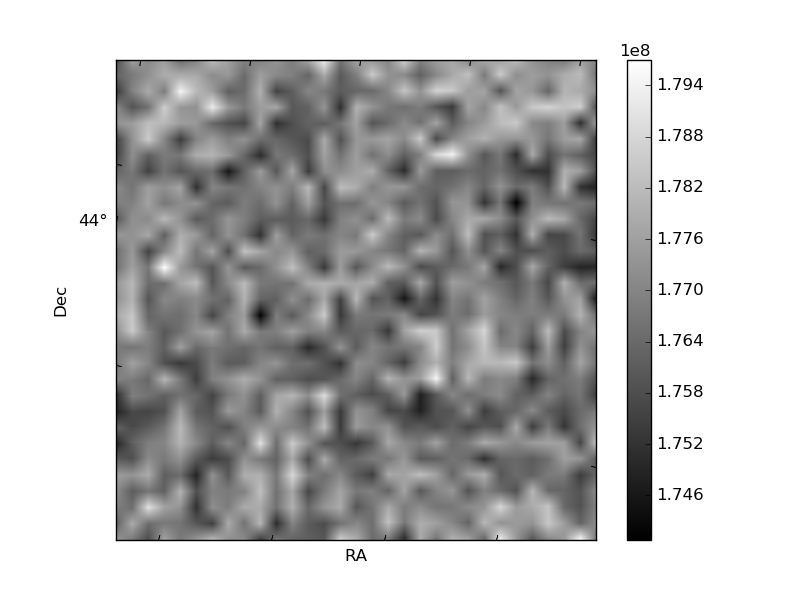
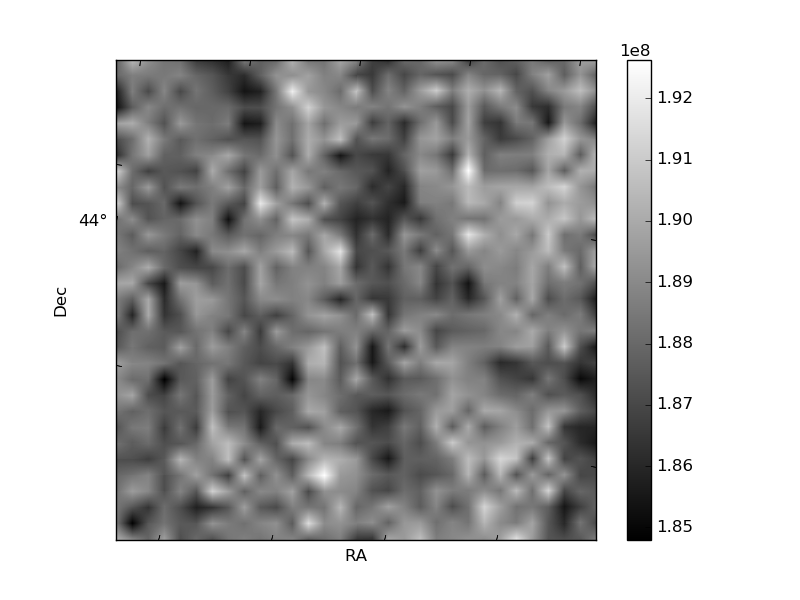
Histogram calculated using DETX and DETY for each event in the final _common_clean file
| Quadrant A | 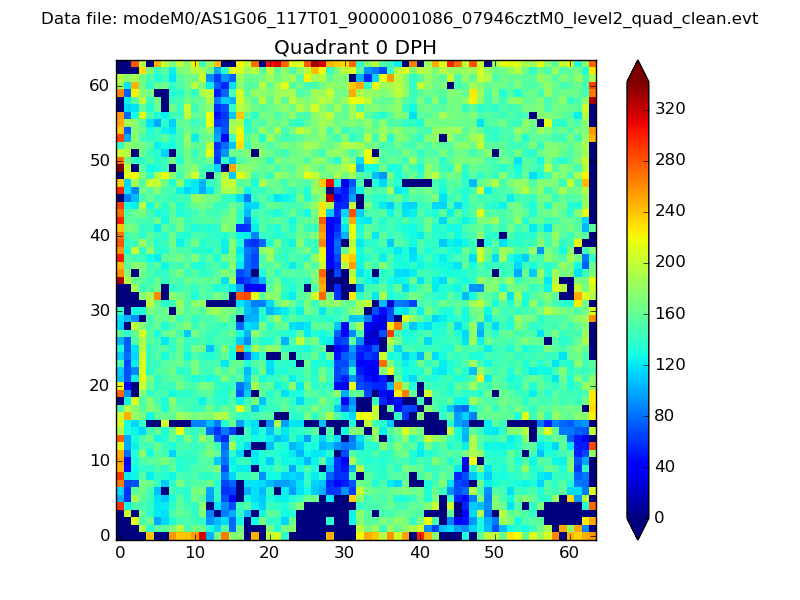 |
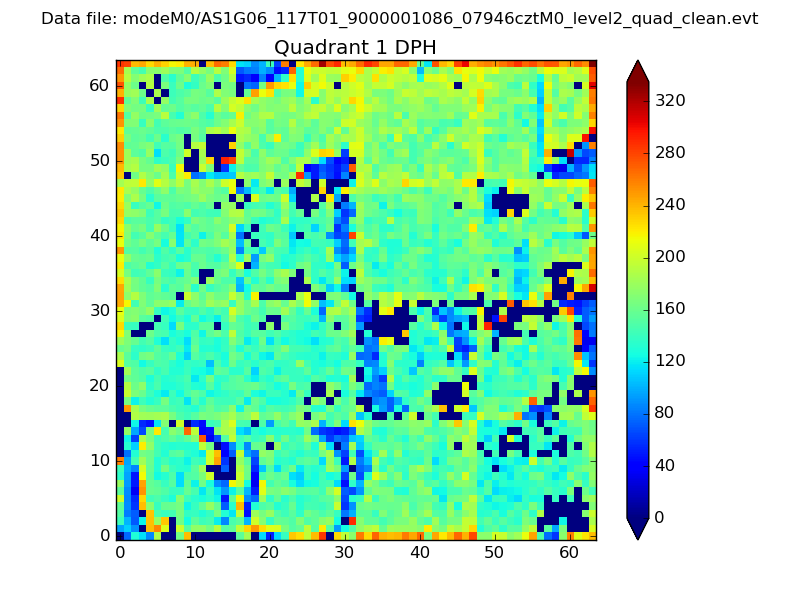 |
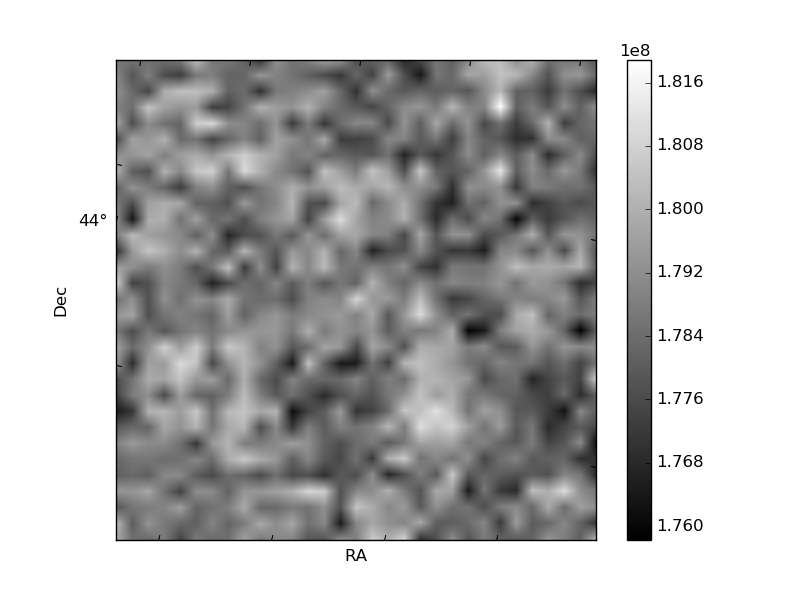
Quadrant B |
|---|---|---|---|
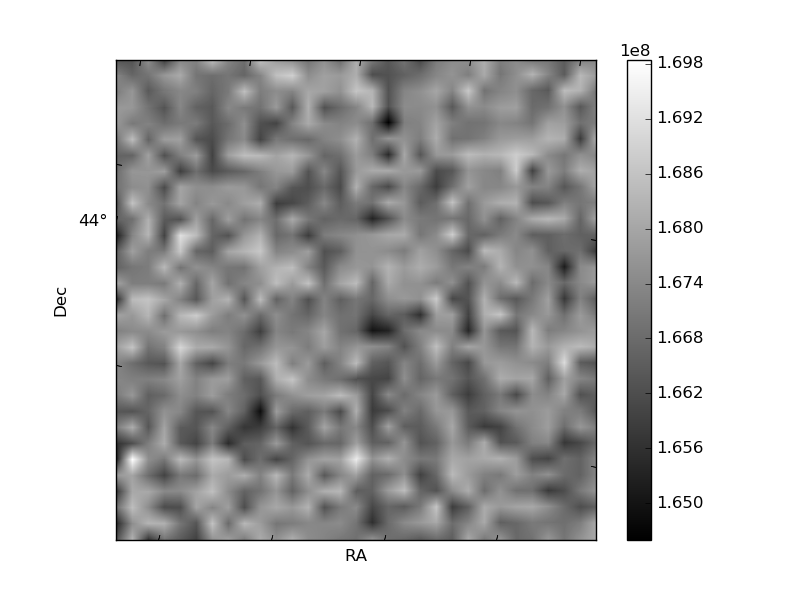
| Quadrant D |  |
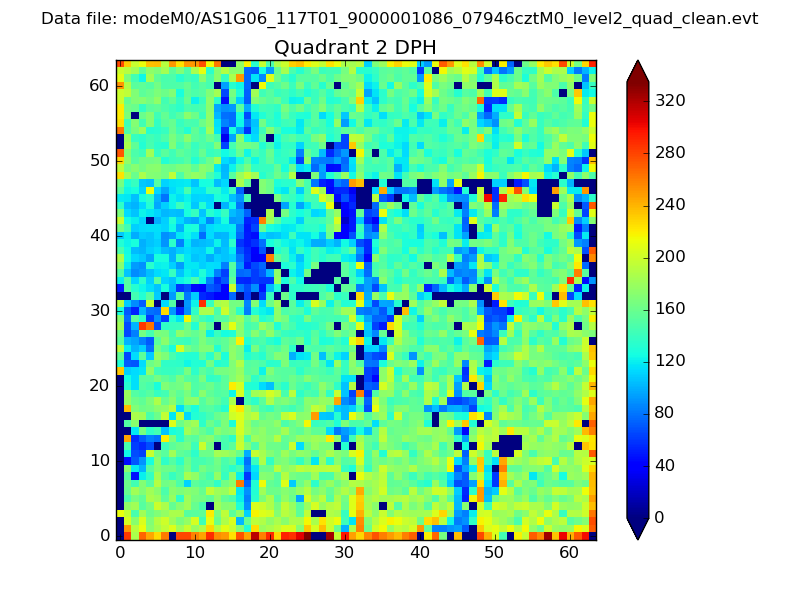 |
Quadrant C |
| Plot type | Count rate plots | Images |
|---|---|---|
| Comparison with Poisson distribution Blue bars denote a histogram of data divided into 1 sec bins. Red curve is a Poisson curve with rate = median count rate of data. |
 |
 |
| Quadrant-wise count rates Data is divided into 100 sec bins |
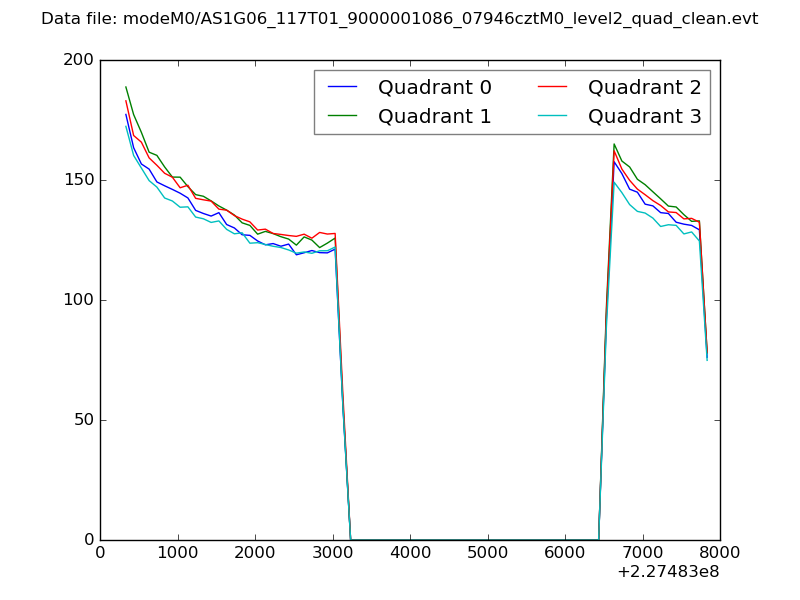 |
|
| Module-wise count rates for Quadrant A Data is divided into 100 sec bins |
 |
 |
| Module-wise count rates for Quadrant B Data is divided into 100 sec bins |
 |
 |
| Module-wise count rates for Quadrant C Data is divided into 100 sec bins |
 |
 |
| Module-wise count rates for Quadrant D Data is divided into 100 sec bins |
 |
 |
| Parameter | Plot |
|---|---|
| CZT HV Monitor |  |
| D_VDD | 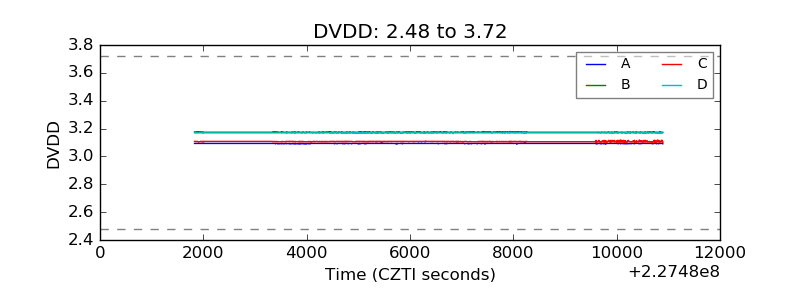 |
| Temperature 1 | 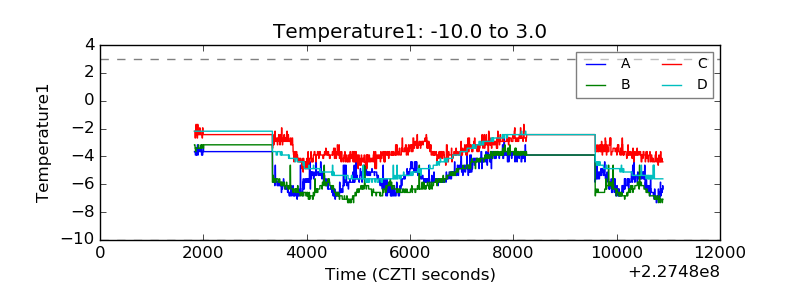 |
| Veto HV Monitor | 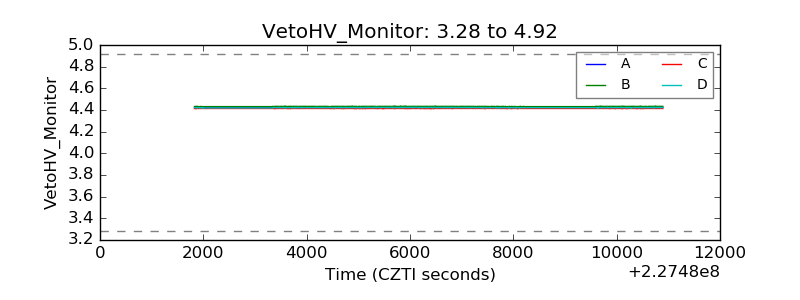 |
| Veto LLD | 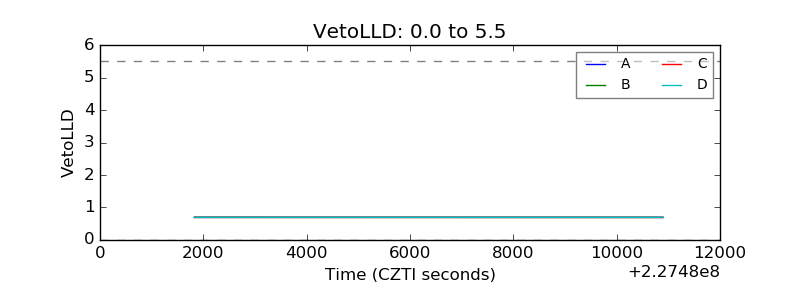 |
| Alpha Counter | 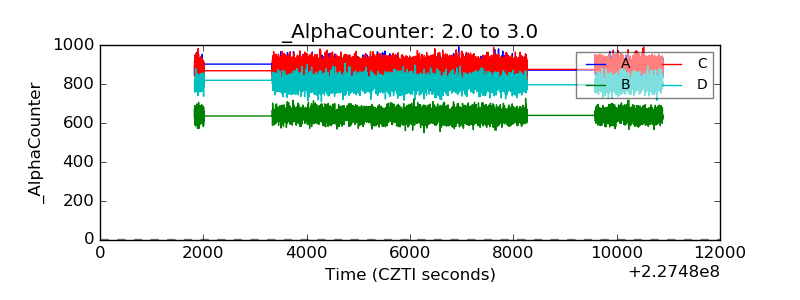 |
| _CPM_Rate | 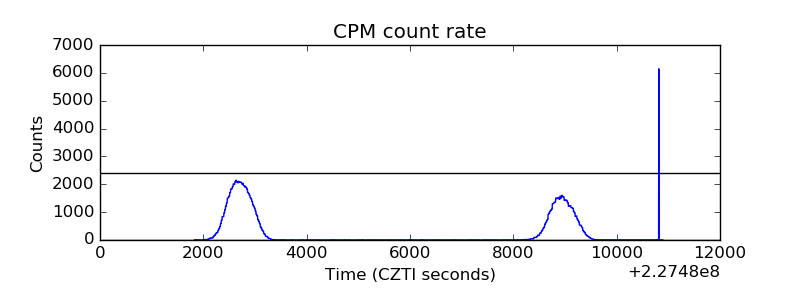 |
| CZT Counter | 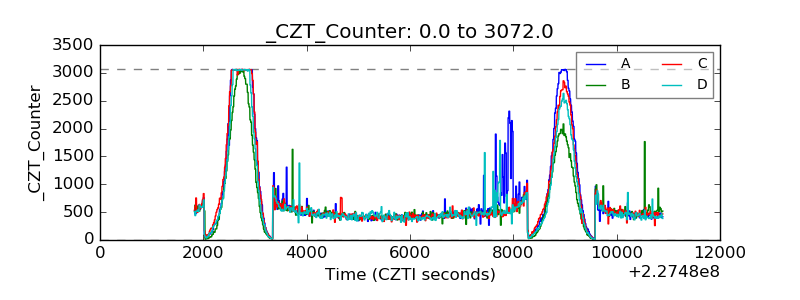 |
| +2.5 Volts monitor |  |
| +5 Volts monitor |  |
| _ROLL_ROT | 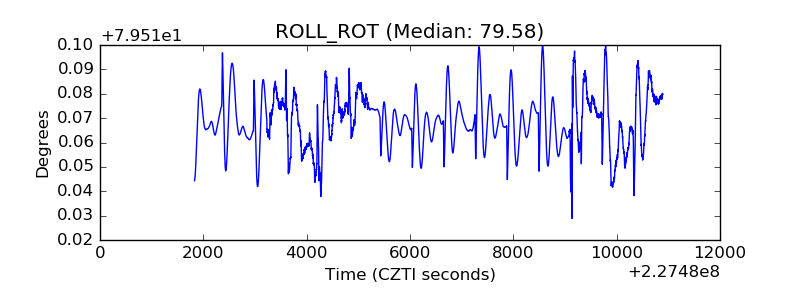 |
| _Roll_DEC | 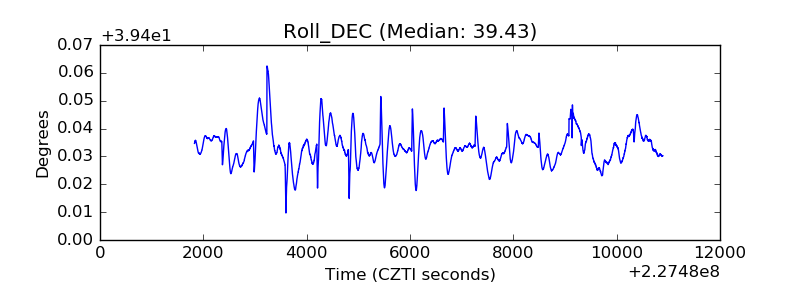 |
| _Roll_RA | 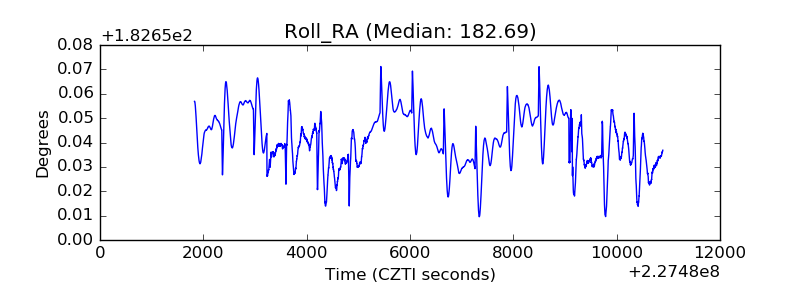 |
| Veto Counter | 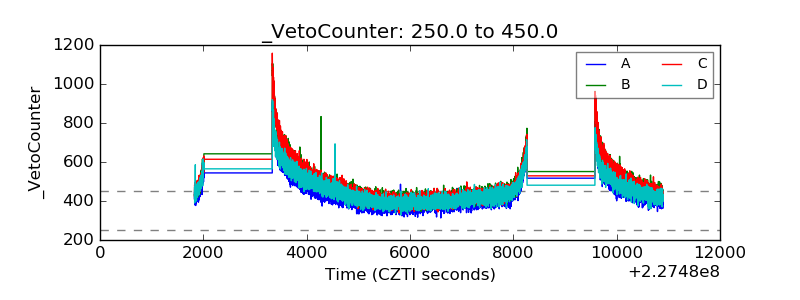 |