| Param | Original file | Final file |
|---|---|---|
| Filename | modeM0/AS1G06_117T01_9000001086_07947cztM0_level2.evt | modeM0/AS1G06_117T01_9000001086_07947cztM0_level2_quad_clean.evt |
| Size (bytes) | 413,795,520 | 85,991,040 |
| Size | 394.6 MB | 82.0 MB |
| Events in quadrant A | 2,873,983 | 538,922 |
| Events in quadrant B | 3,024,445 | 559,982 |
| Events in quadrant C | 2,896,181 | 550,677 |
| Events in quadrant D | 3,314,735 | 521,156 |
| Mode M9 | |||
|---|---|---|---|
| Quadrant | BADHDUFLAG | Total packets | Discarded packets |
| A | 0 | 18 | 0 |
| B | 0 | 18 | 0 |
| C | 0 | 18 | 0 |
| D | 0 | 19 | 0 |
| Mode SS | |||
|---|---|---|---|
| Quadrant | BADHDUFLAG | Total packets | Discarded packets |
| A | 0 | 126 | 0 |
| B | 0 | 126 | 0 |
| C | 0 | 126 | 0 |
| D | 0 | 126 | 0 |
| Mode M0 | |||
|---|---|---|---|
| Quadrant | BADHDUFLAG | Total packets | Discarded packets |
| A | 0 | 12853 | 3 |
| B | 0 | 13119 | 2 |
| C | 0 | 12857 | 2 |
| D | 0 | 14347 | 2 |
| Quadrant | Total seconds | Saturated seconds | Saturation percentage |
|---|---|---|---|
| A | 6208 | 19 | 0.306057% |
| B | 6208 | 44 | 0.708763% |
| C | 6208 | 22 | 0.354381% |
| D | 6208 | 155 | 2.496778% |
Noise dominated data is calculated using 1-second bins in cleaned event files. If a bin has >2000 counts, and if more than 50% of those come from <1% of pixels, then it is considered to be noise-dominated and hence unusable.
| Quadrant | # 1 sec bins | Bins with >0 counts | Bins with >2000 counts | High rate bins dominated by noise | Noise dominated (total time) | Noise dominated (detector-on time) | Marked lightcurve |
|---|---|---|---|---|---|---|---|
| A | 7498 | 6210 | 0 | 0 | 0.00% | 0.00% |  |
| B | 7498 | 6210 | 7 | 7 | 0.09% | 0.11% |  |
| C | 7498 | 6210 | 0 | 0 | 0.00% | 0.00% | 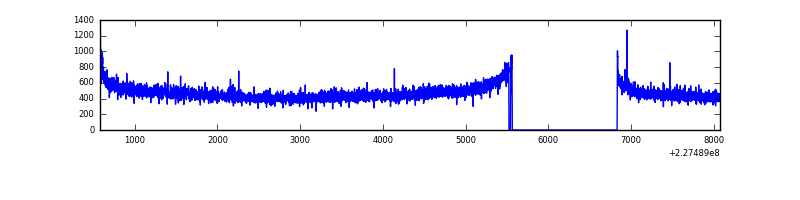 |
| D | 7498 | 6210 | 113 | 113 | 1.51% | 1.82% | 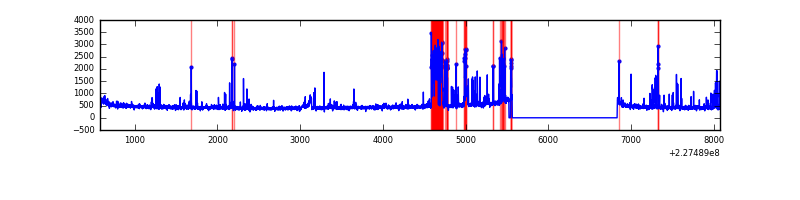 |
Top three noisy pixels from each quadrant. If the there are fewer than three noisy pixels in the level2.evt file, extra rows are filled as -1
| Pixel properties | Quadrant properties | ||||||
|---|---|---|---|---|---|---|---|
| Quadrant | DetID | PixID | Counts | Sigma | Mean | Median | Sigma |
| A | 15 | 234 | 27016 | 176.8 | 736 | 721 | 148.7 |
| A | 0 | 226 | 6722 | 40.35 | 736 | 721 | 148.7 |
| A | 12 | 194 | 6199 | 36.83 | 736 | 721 | 148.7 |
| B | 10 | 245 | 57183 | 396.84 | 748 | 730 | 142.3 |
| B | 5 | 255 | 52352 | 362.88 | 748 | 730 | 142.3 |
| B | 12 | 111 | 15563 | 104.27 | 748 | 730 | 142.3 |
| C | 1 | 16 | 35618 | 207.26 | 725 | 730 | 168.3 |
| C | 8 | 128 | 15377 | 87.01 | 725 | 730 | 168.3 |
| C | 8 | 112 | 6599 | 34.87 | 725 | 730 | 168.3 |
| D | 1 | 52 | 553691 | 3236.31 | 708 | 686 | 170.9 |
| D | 5 | 97 | 27420 | 156.45 | 708 | 686 | 170.9 |
| D | 2 | 152 | 24500 | 139.36 | 708 | 686 | 170.9 |
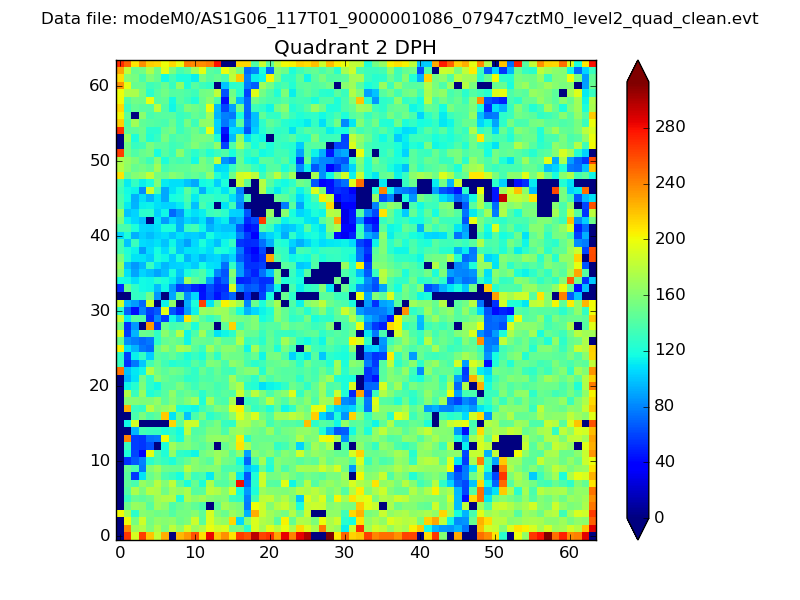
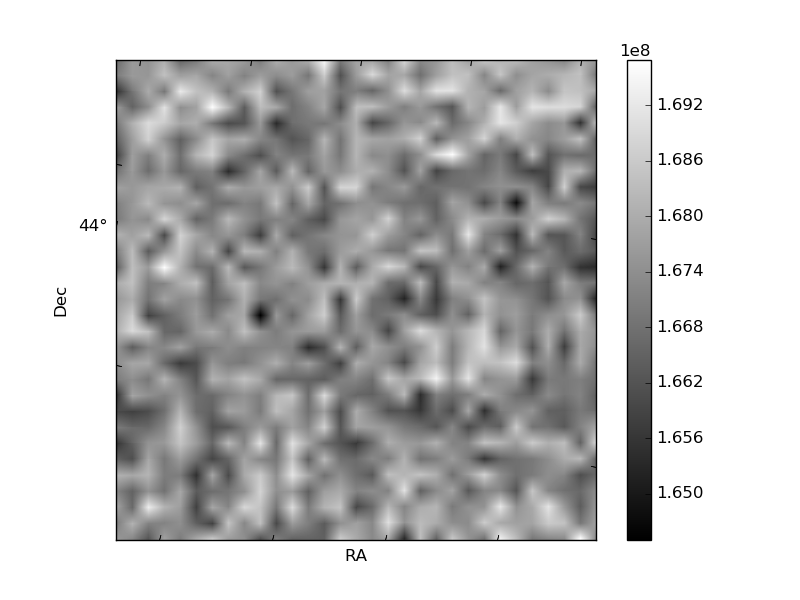
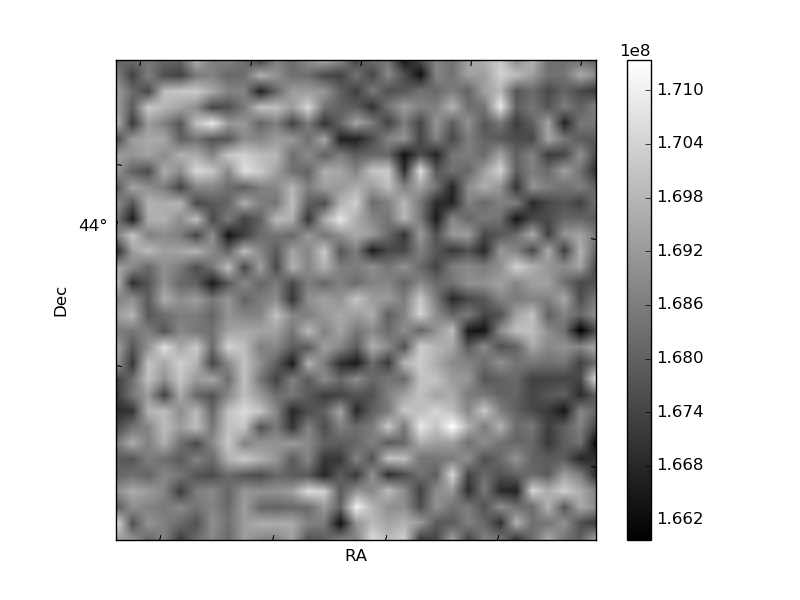
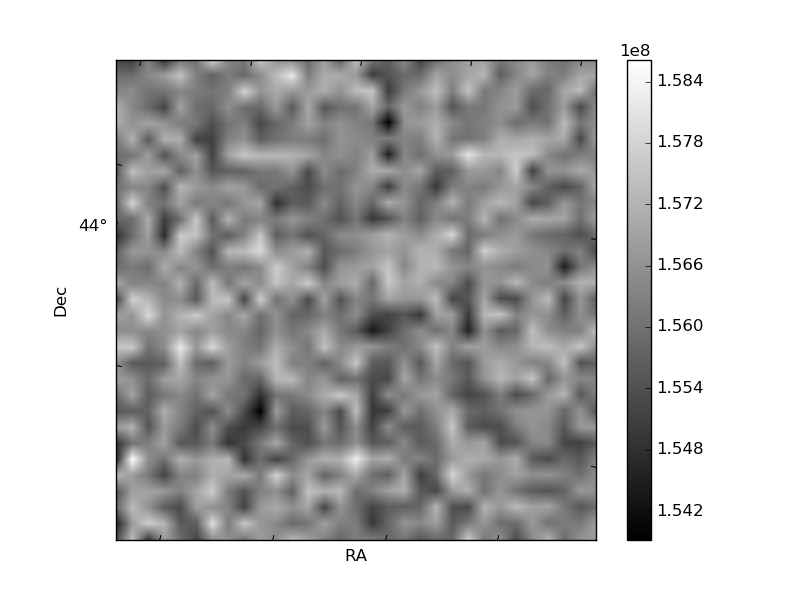
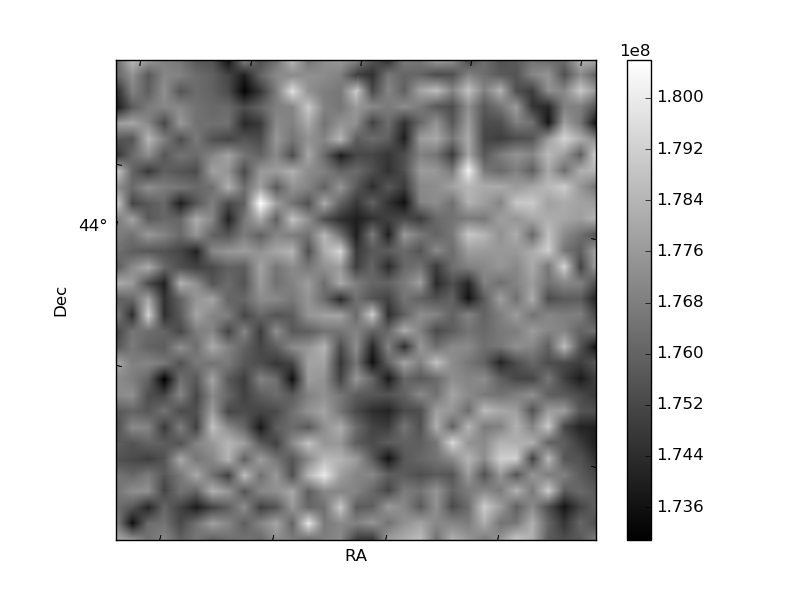
Histogram calculated using DETX and DETY for each event in the final _common_clean file
| Quadrant A | 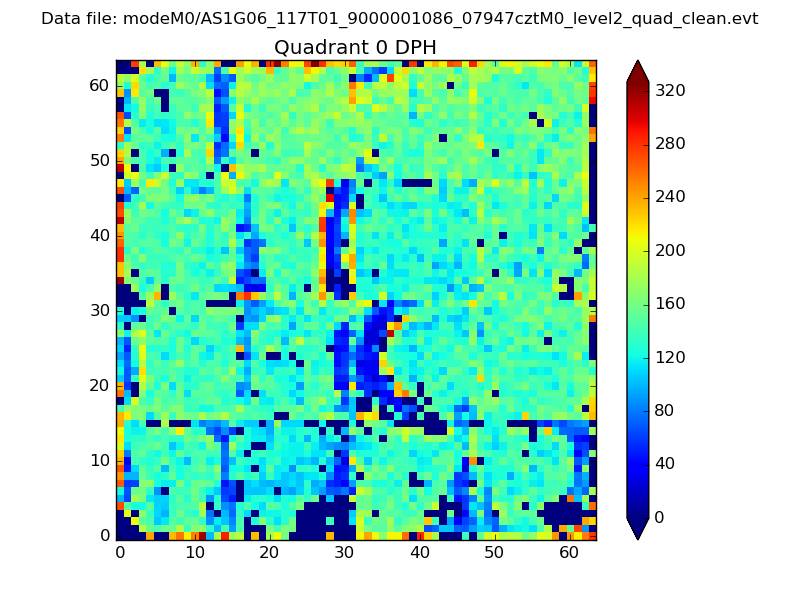 |
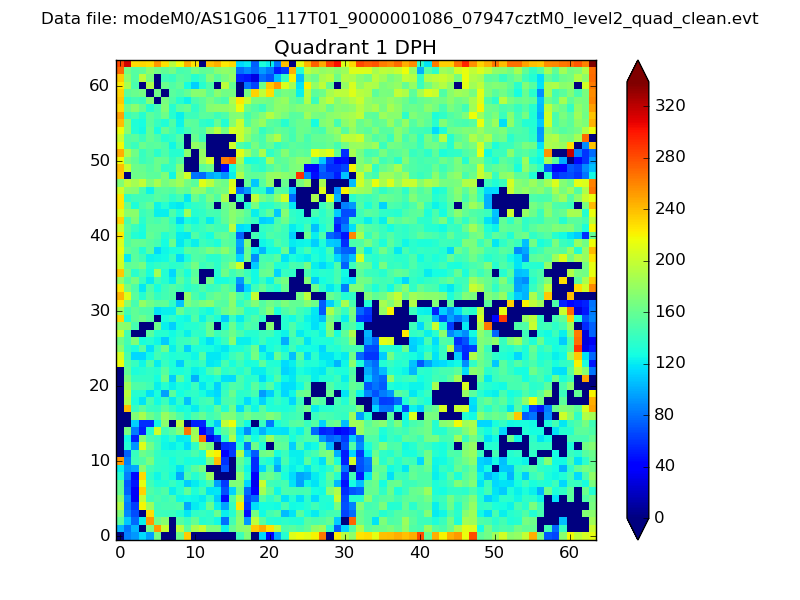 |
Quadrant B |
|---|---|---|---|
| Quadrant D | 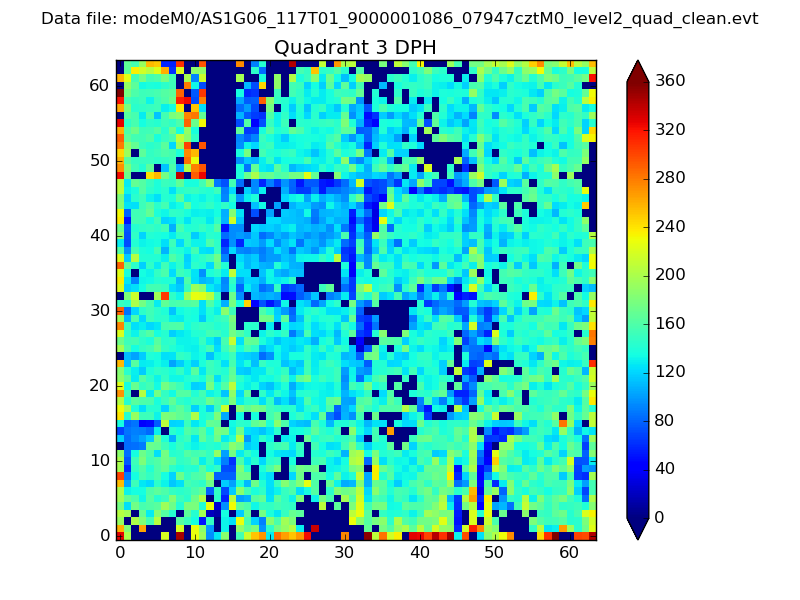 |
 |
Quadrant C |
| Plot type | Count rate plots | Images |
|---|---|---|
| Comparison with Poisson distribution Blue bars denote a histogram of data divided into 1 sec bins. Red curve is a Poisson curve with rate = median count rate of data. |
 |
 |
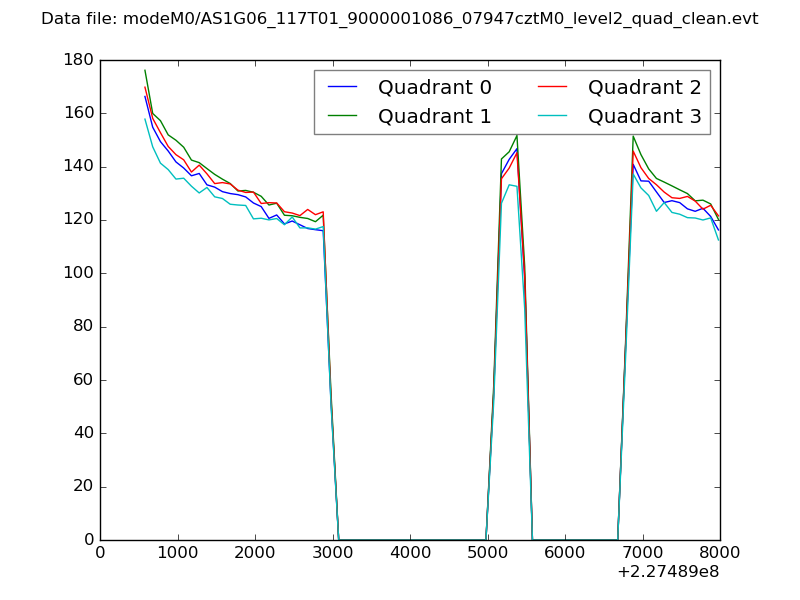
| Quadrant-wise count rates Data is divided into 100 sec bins |
 |
|
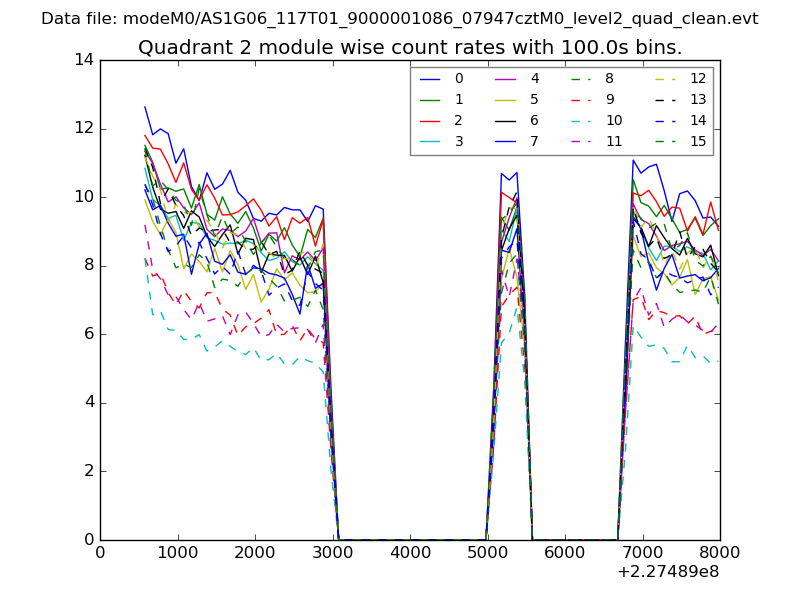
| Module-wise count rates for Quadrant A Data is divided into 100 sec bins |
 |
 |
| Module-wise count rates for Quadrant B Data is divided into 100 sec bins |
 |
 |
| Module-wise count rates for Quadrant C Data is divided into 100 sec bins |
 |
 |
| Module-wise count rates for Quadrant D Data is divided into 100 sec bins |
 |
 |
| Parameter | Plot |
|---|---|
| CZT HV Monitor | 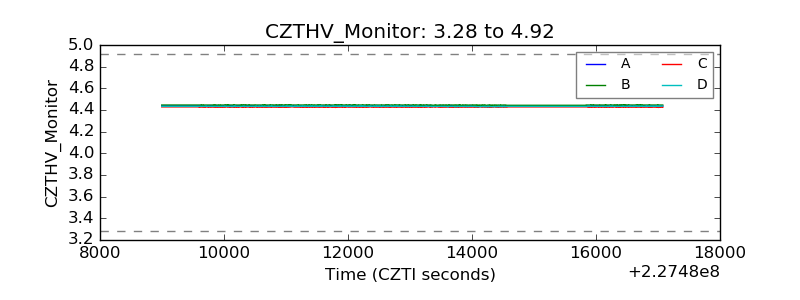 |
| D_VDD | 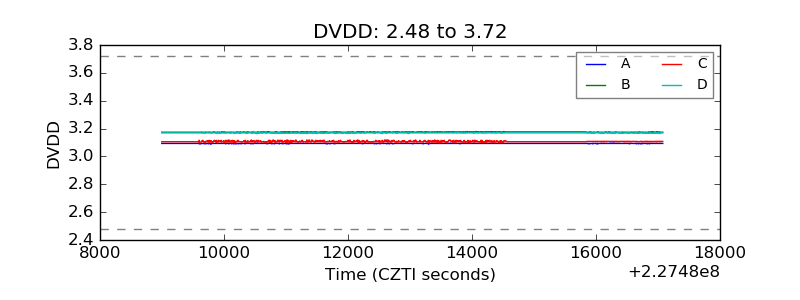 |
| Temperature 1 | 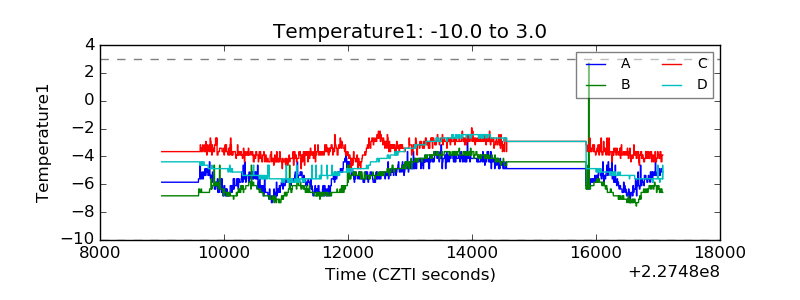 |
| Veto HV Monitor | 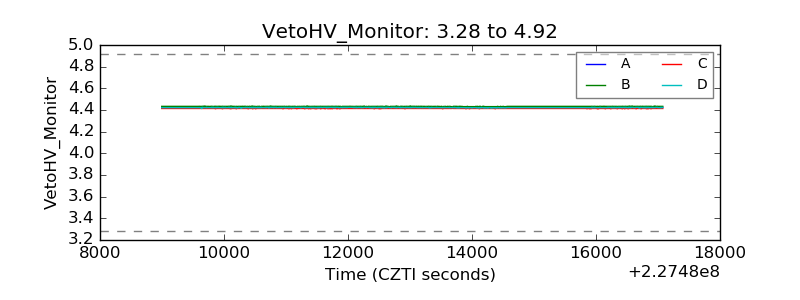 |
| Veto LLD | 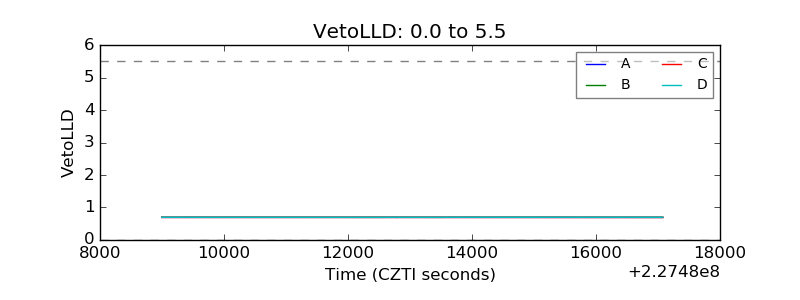 |
| Alpha Counter | 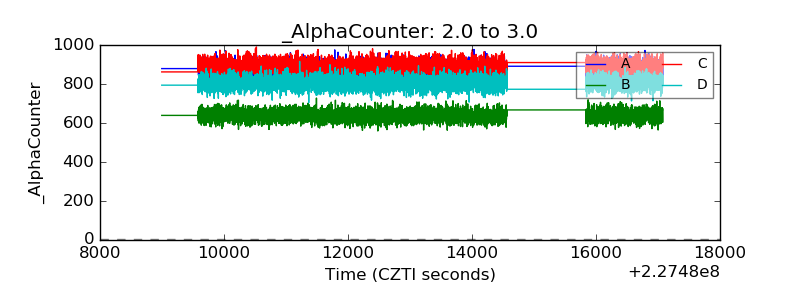 |
| _CPM_Rate | 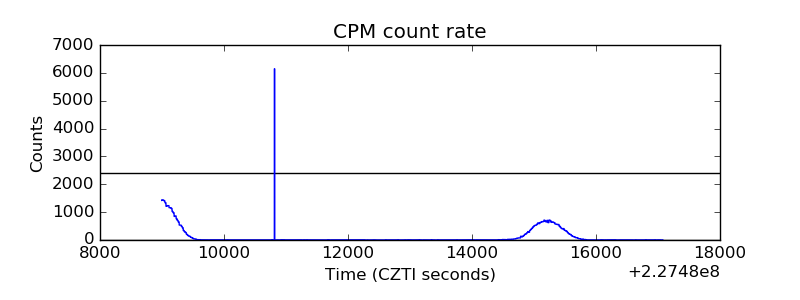 |
| CZT Counter | 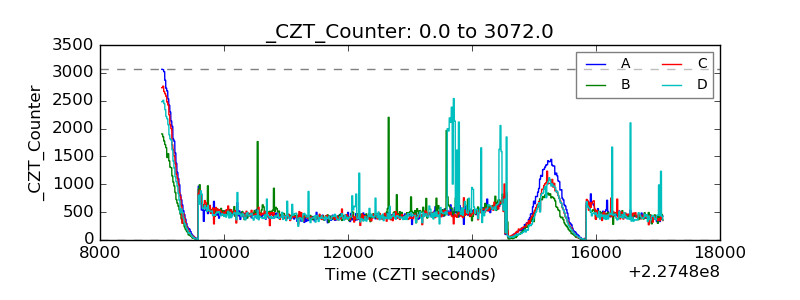 |
| +2.5 Volts monitor |  |
| +5 Volts monitor |  |
| _ROLL_ROT | 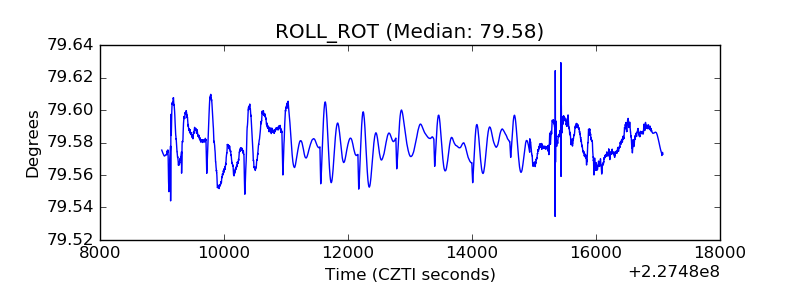 |
| _Roll_DEC | 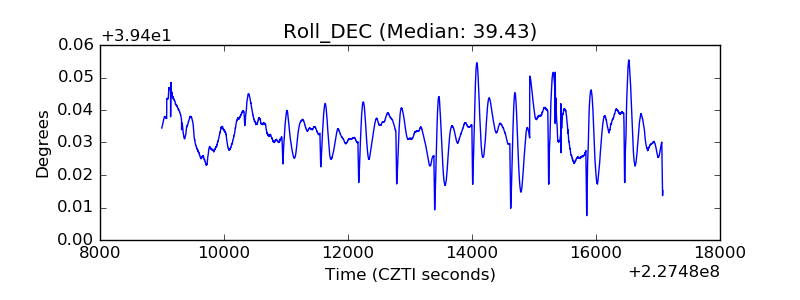 |
| _Roll_RA | 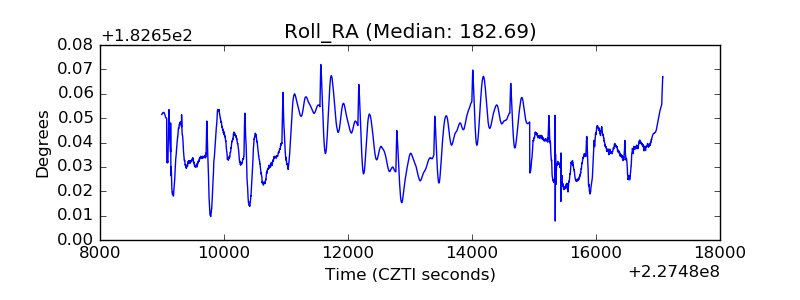 |
| Veto Counter |  |