| Param | Original file | Final file |
|---|---|---|
| Filename | modeM0/AS1G06_117T01_9000001086_07948cztM0_level2.evt | modeM0/AS1G06_117T01_9000001086_07948cztM0_level2_quad_clean.evt |
| Size (bytes) | 445,282,560 | 93,401,280 |
| Size | 424.7 MB | 89.1 MB |
| Events in quadrant A | 3,521,726 | 582,966 |
| Events in quadrant B | 3,159,369 | 604,592 |
| Events in quadrant C | 3,064,312 | 599,575 |
| Events in quadrant D | 3,279,152 | 569,103 |
| Mode M9 | |||
|---|---|---|---|
| Quadrant | BADHDUFLAG | Total packets | Discarded packets |
| A | 0 | 23 | 0 |
| B | 0 | 23 | 0 |
| C | 0 | 23 | 0 |
| D | 0 | 23 | 0 |
| Mode SS | |||
|---|---|---|---|
| Quadrant | BADHDUFLAG | Total packets | Discarded packets |
| A | 0 | 138 | 0 |
| B | 0 | 138 | 0 |
| C | 0 | 138 | 0 |
| D | 0 | 138 | 0 |
| Mode M0 | |||
|---|---|---|---|
| Quadrant | BADHDUFLAG | Total packets | Discarded packets |
| A | 0 | 15573 | 3 |
| B | 0 | 14060 | 2 |
| C | 0 | 14013 | 2 |
| D | 0 | 14763 | 2 |
| Quadrant | Total seconds | Saturated seconds | Saturation percentage |
|---|---|---|---|
| A | 6783 | 64 | 0.943535% |
| B | 6783 | 63 | 0.928793% |
| C | 6783 | 29 | 0.427539% |
| D | 6783 | 64 | 0.943535% |
Noise dominated data is calculated using 1-second bins in cleaned event files. If a bin has >2000 counts, and if more than 50% of those come from <1% of pixels, then it is considered to be noise-dominated and hence unusable.
| Quadrant | # 1 sec bins | Bins with >0 counts | Bins with >2000 counts | High rate bins dominated by noise | Noise dominated (total time) | Noise dominated (detector-on time) | Marked lightcurve |
|---|---|---|---|---|---|---|---|
| A | 9068 | 6786 | 22 | 22 | 0.24% | 0.32% | 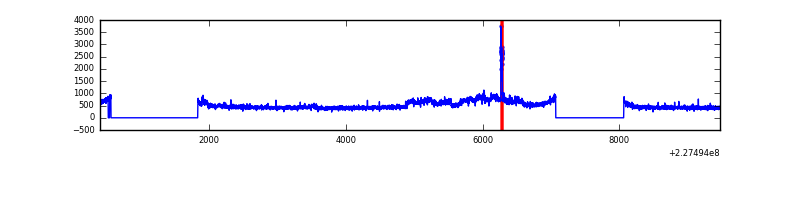 |
| B | 9068 | 6786 | 1 | 1 | 0.01% | 0.01% | 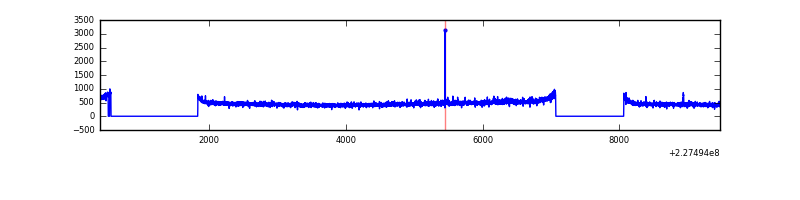 |
| C | 9068 | 6786 | 0 | 0 | 0.00% | 0.00% | 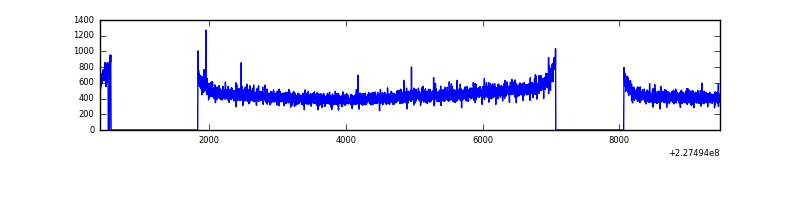 |
| D | 9068 | 6786 | 30 | 30 | 0.33% | 0.44% | 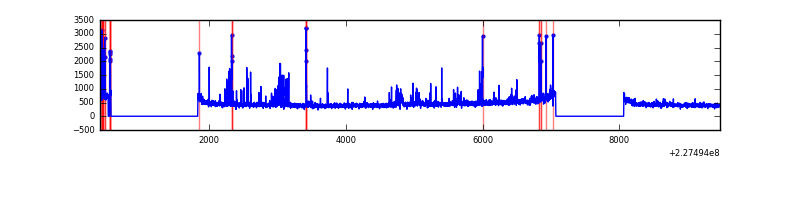 |
Top three noisy pixels from each quadrant. If the there are fewer than three noisy pixels in the level2.evt file, extra rows are filled as -1
| Pixel properties | Quadrant properties | ||||||
|---|---|---|---|---|---|---|---|
| Quadrant | DetID | PixID | Counts | Sigma | Mean | Median | Sigma |
| A | 15 | 234 | 456187 | 2819.71 | 793 | 776 | 161.5 |
| A | 0 | 226 | 7274 | 40.23 | 793 | 776 | 161.5 |
| A | 12 | 194 | 6597 | 36.04 | 793 | 776 | 161.5 |
| B | 12 | 111 | 17115 | 105.75 | 806 | 786 | 154.4 |
| B | 11 | 111 | 13323 | 81.19 | 806 | 786 | 154.4 |
| B | 10 | 245 | 13222 | 80.54 | 806 | 786 | 154.4 |
| C | 1 | 16 | 19577 | 103.5 | 780 | 784 | 181.6 |
| C | 13 | 61 | 6010 | 28.78 | 780 | 784 | 181.6 |
| C | 8 | 222 | 2425 | 9.04 | 780 | 784 | 181.6 |
| D | 1 | 52 | 255408 | 1357.09 | 770 | 749 | 187.7 |
| D | 5 | 81 | 29318 | 152.25 | 770 | 749 | 187.7 |
| D | 5 | 233 | 27607 | 143.13 | 770 | 749 | 187.7 |
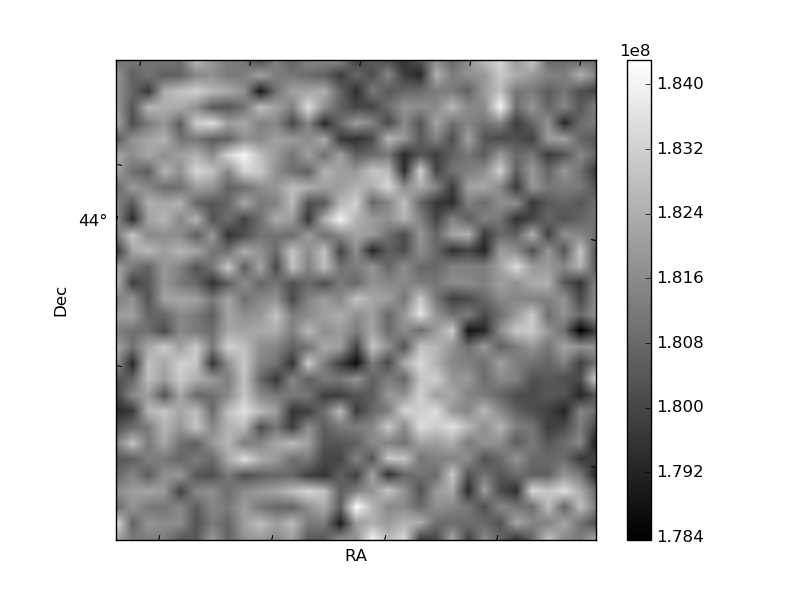
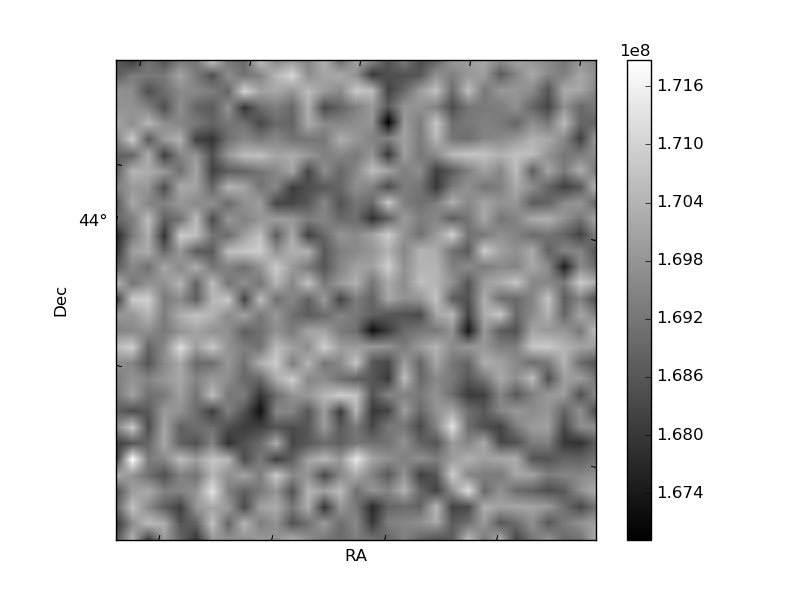
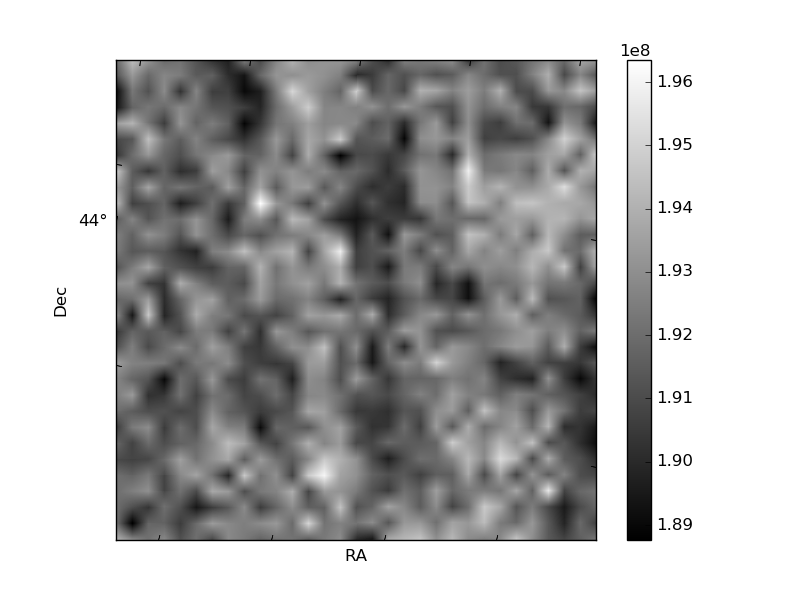
Histogram calculated using DETX and DETY for each event in the final _common_clean file
| Quadrant A | 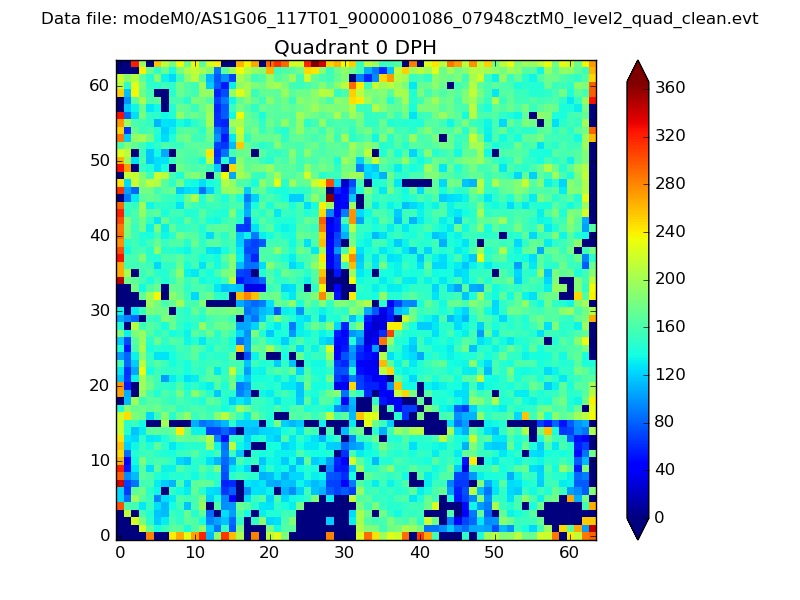 |
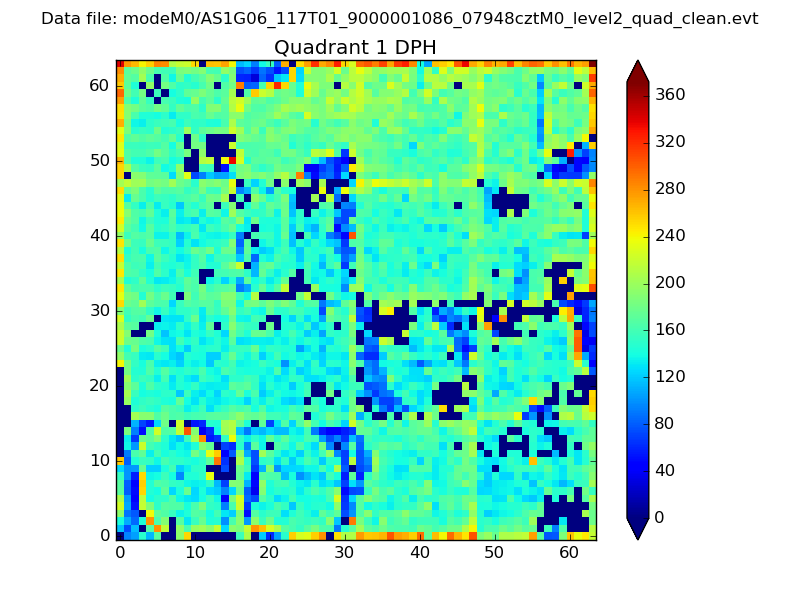 |
Quadrant B |
|---|---|---|---|
| Quadrant D |  |
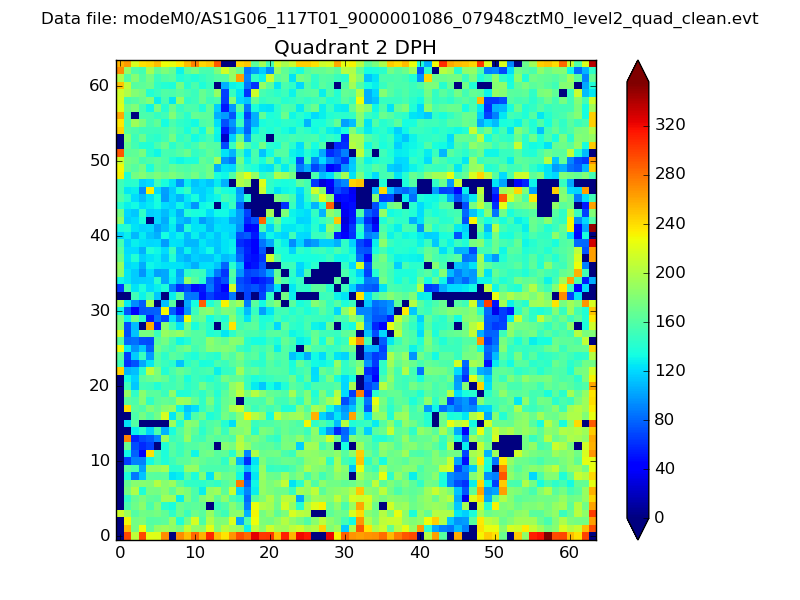 |
Quadrant C |
| Plot type | Count rate plots | Images |
|---|---|---|
| Comparison with Poisson distribution Blue bars denote a histogram of data divided into 1 sec bins. Red curve is a Poisson curve with rate = median count rate of data. |
 |
 |
| Quadrant-wise count rates Data is divided into 100 sec bins |
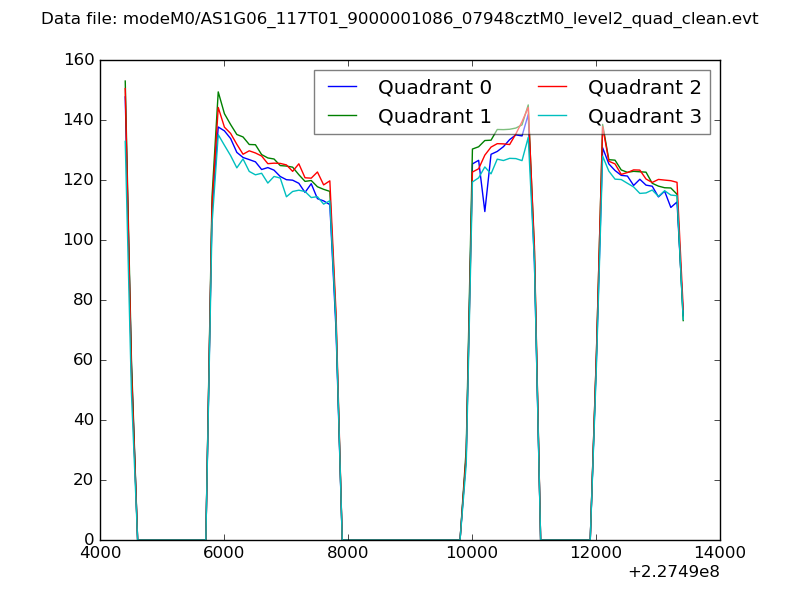 |
|
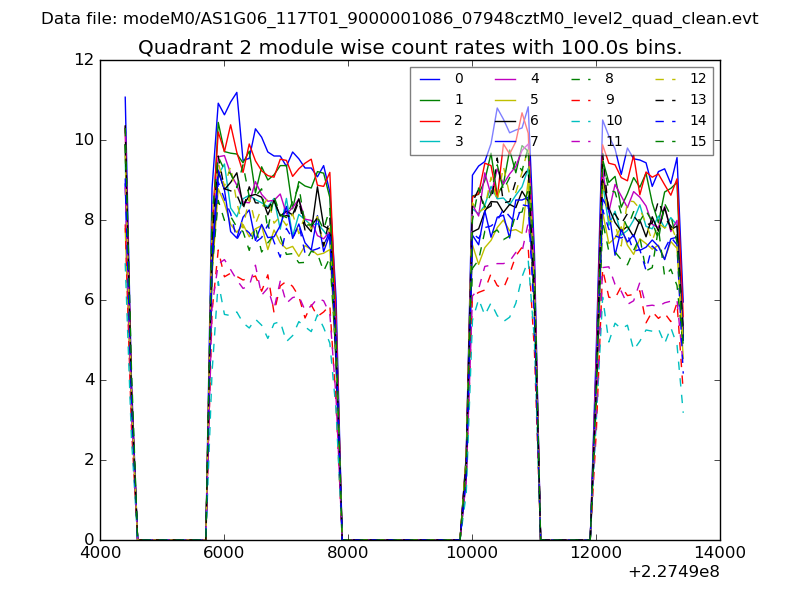
| Module-wise count rates for Quadrant A Data is divided into 100 sec bins |
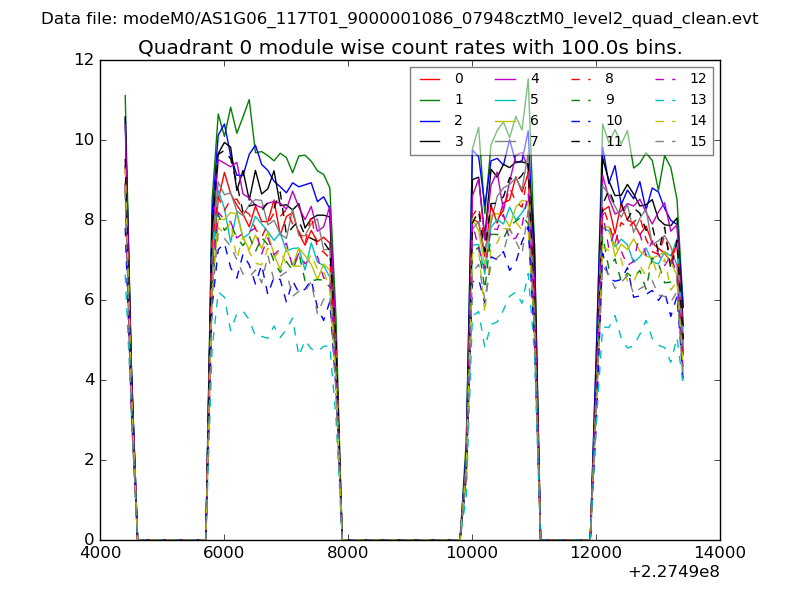 |
 |
| Module-wise count rates for Quadrant B Data is divided into 100 sec bins |
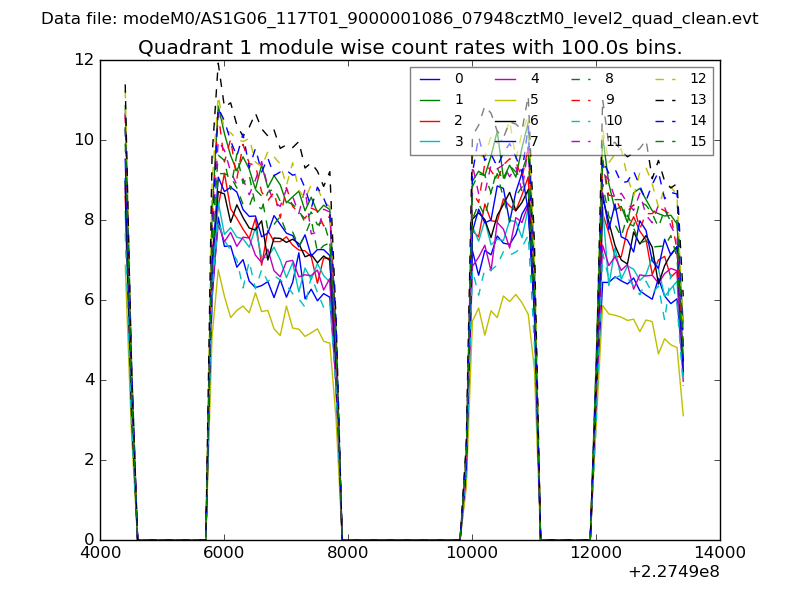 |
 |
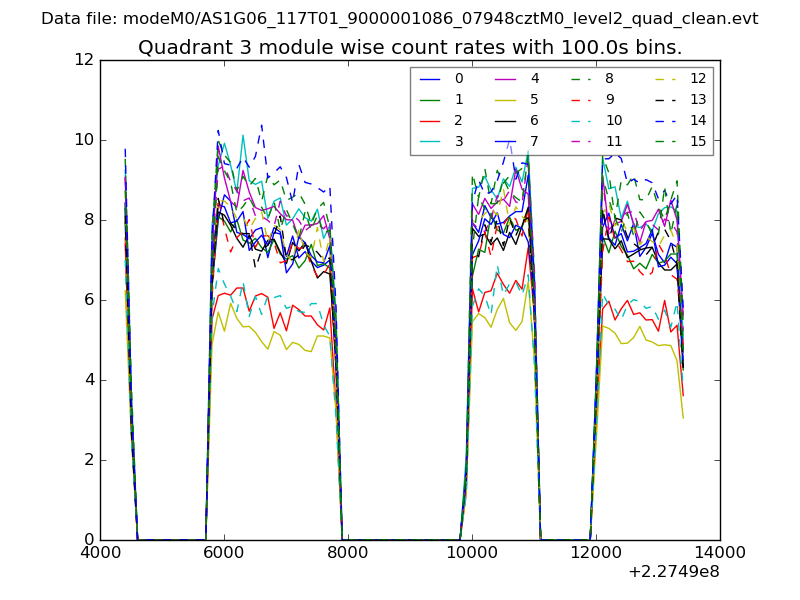
| Module-wise count rates for Quadrant C Data is divided into 100 sec bins |
 |
 |
| Module-wise count rates for Quadrant D Data is divided into 100 sec bins |
 |
 |
| Parameter | Plot |
|---|---|
| CZT HV Monitor |  |
| D_VDD | 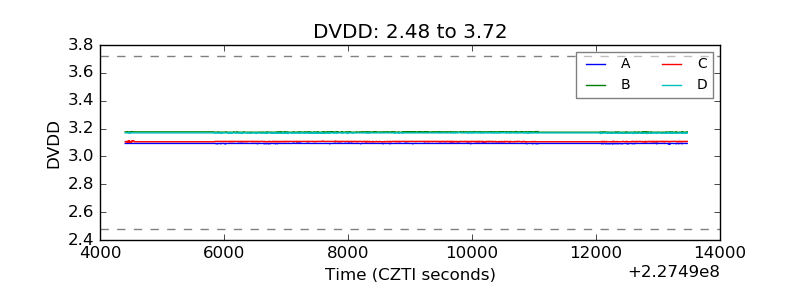 |
| Temperature 1 | 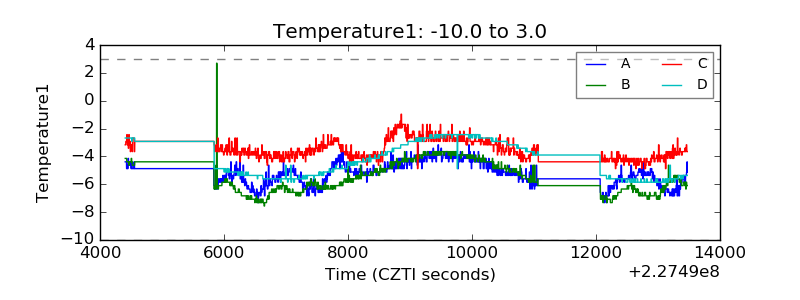 |
| Veto HV Monitor | 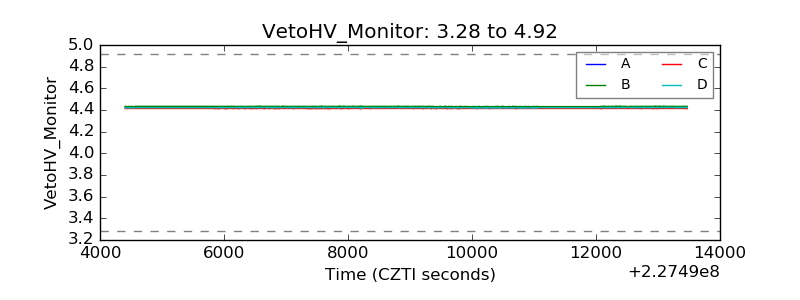 |
| Veto LLD | 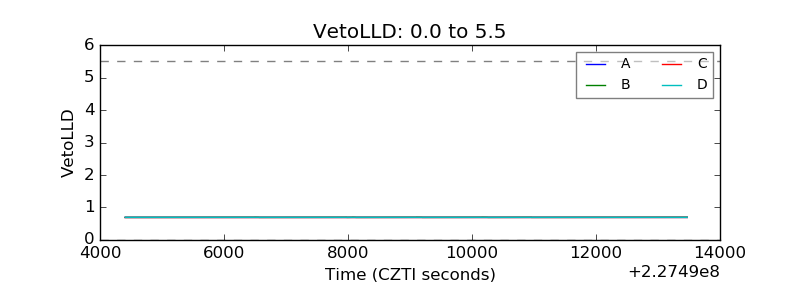 |
| Alpha Counter | 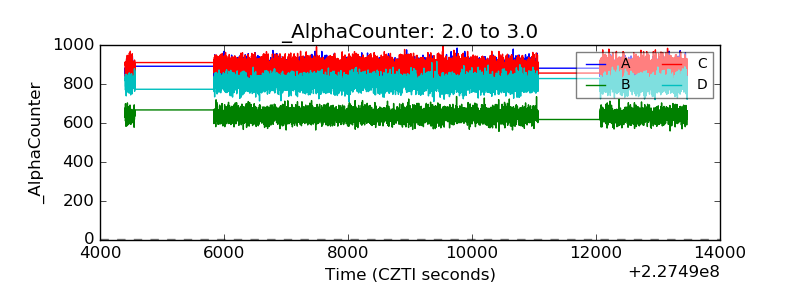 |
| _CPM_Rate | 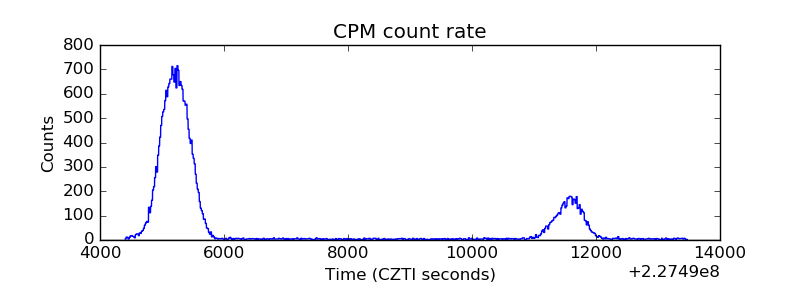 |
| CZT Counter | 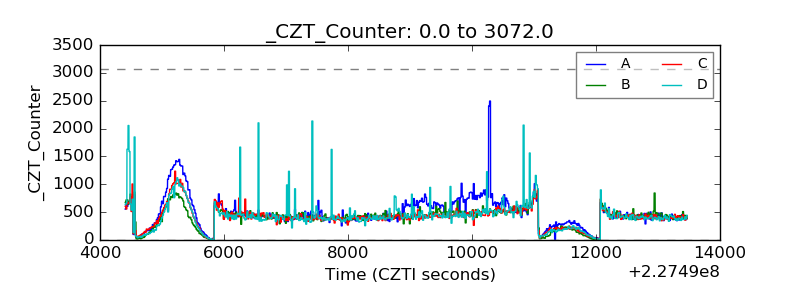 |
| +2.5 Volts monitor |  |
| +5 Volts monitor |  |
| _ROLL_ROT | 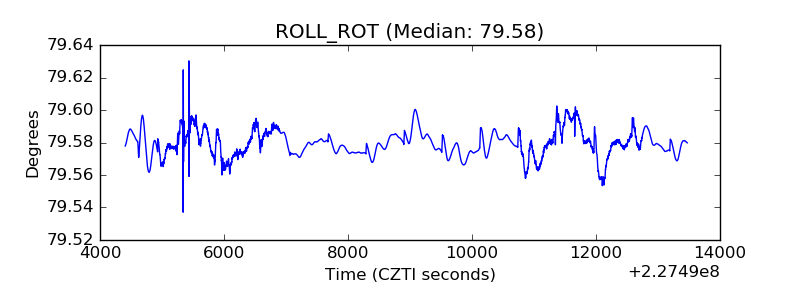 |
| _Roll_DEC | 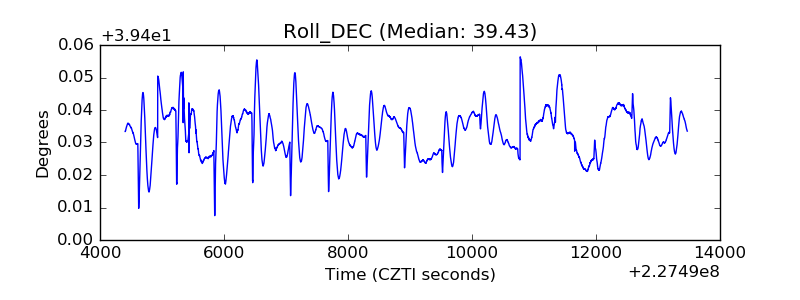 |
| _Roll_RA | 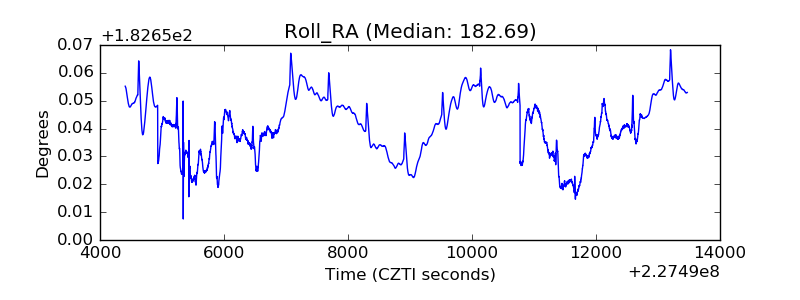 |
| Veto Counter | 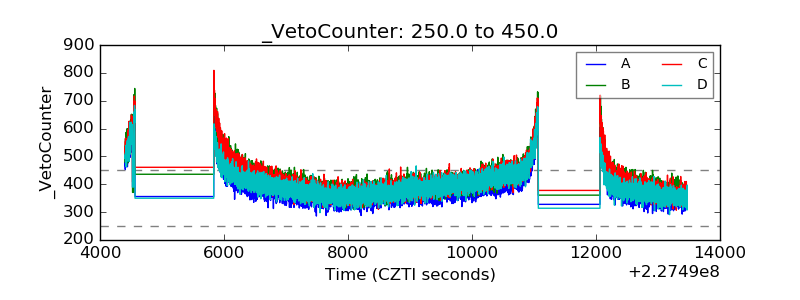 |