| Param | Original file | Final file |
|---|---|---|
| Filename | modeM0/AS1G06_117T01_9000001086_07950cztM0_level2.evt | modeM0/AS1G06_117T01_9000001086_07950cztM0_level2_quad_clean.evt |
| Size (bytes) | 524,917,440 | 98,346,240 |
| Size | 500.6 MB | 93.8 MB |
| Events in quadrant A | 3,566,342 | 604,737 |
| Events in quadrant B | 3,790,479 | 621,186 |
| Events in quadrant C | 3,538,925 | 624,720 |
| Events in quadrant D | 4,475,156 | 588,738 |
| Mode M9 | |||
|---|---|---|---|
| Quadrant | BADHDUFLAG | Total packets | Discarded packets |
| A | 0 | 1 | 0 |
| B | 0 | 1 | 0 |
| C | 0 | 1 | 0 |
| D | 0 | 2 | 0 |
| Mode SS | |||
|---|---|---|---|
| Quadrant | BADHDUFLAG | Total packets | Discarded packets |
| A | 0 | 154 | 0 |
| B | 0 | 154 | 0 |
| C | 0 | 154 | 0 |
| D | 0 | 154 | 0 |
| Mode M0 | |||
|---|---|---|---|
| Quadrant | BADHDUFLAG | Total packets | Discarded packets |
| A | 0 | 16181 | 43 |
| B | 0 | 16651 | 42 |
| C | 0 | 16158 | 34 |
| D | 0 | 18972 | 65 |
| Quadrant | Total seconds | Saturated seconds | Saturation percentage |
|---|---|---|---|
| A | 7749 | 342 | 4.413473% |
| B | 7751 | 354 | 4.567153% |
| C | 7753 | 217 | 2.798917% |
| D | 7748 | 358 | 4.620547% |
Noise dominated data is calculated using 1-second bins in cleaned event files. If a bin has >2000 counts, and if more than 50% of those come from <1% of pixels, then it is considered to be noise-dominated and hence unusable.
| Quadrant | # 1 sec bins | Bins with >0 counts | Bins with >2000 counts | High rate bins dominated by noise | Noise dominated (total time) | Noise dominated (detector-on time) | Marked lightcurve |
|---|---|---|---|---|---|---|---|
| A | 7784 | 7767 | 1 | 1 | 0.01% | 0.01% | 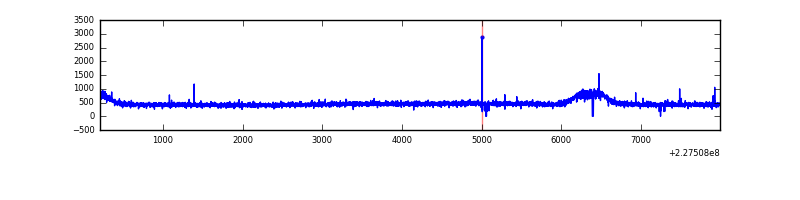 |
| B | 7784 | 7769 | 8 | 8 | 0.10% | 0.10% | 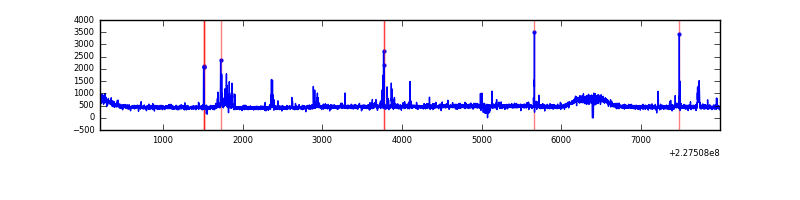 |
| C | 7784 | 7769 | 0 | 0 | 0.00% | 0.00% | 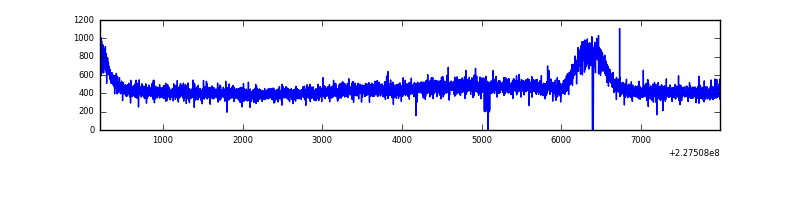 |
| D | 7784 | 7765 | 117 | 117 | 1.50% | 1.51% | 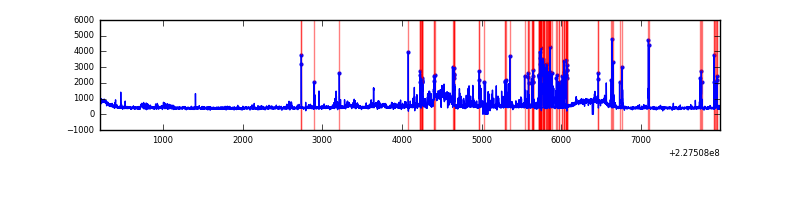 |
Top three noisy pixels from each quadrant. If the there are fewer than three noisy pixels in the level2.evt file, extra rows are filled as -1
| Pixel properties | Quadrant properties | ||||||
|---|---|---|---|---|---|---|---|
| Quadrant | DetID | PixID | Counts | Sigma | Mean | Median | Sigma |
| A | 8 | 15 | 10439 | 50.36 | 918 | 892 | 189.6 |
| A | 13 | 253 | 9532 | 45.58 | 918 | 892 | 189.6 |
| A | 13 | 251 | 8912 | 42.31 | 918 | 892 | 189.6 |
| B | 10 | 16 | 133093 | 739.22 | 925 | 900 | 178.8 |
| B | 10 | 245 | 28177 | 152.53 | 925 | 900 | 178.8 |
| B | 12 | 111 | 20451 | 109.33 | 925 | 900 | 178.8 |
| C | 14 | 67 | 10048 | 43.13 | 904 | 904 | 212.0 |
| C | 13 | 61 | 6835 | 27.97 | 904 | 904 | 212.0 |
| C | 8 | 222 | 3138 | 10.54 | 904 | 904 | 212.0 |
| D | 1 | 52 | 940200 | 4298.72 | 896 | 867 | 218.5 |
| D | 5 | 81 | 43031 | 192.96 | 896 | 867 | 218.5 |
| D | 12 | 233 | 33935 | 151.33 | 896 | 867 | 218.5 |
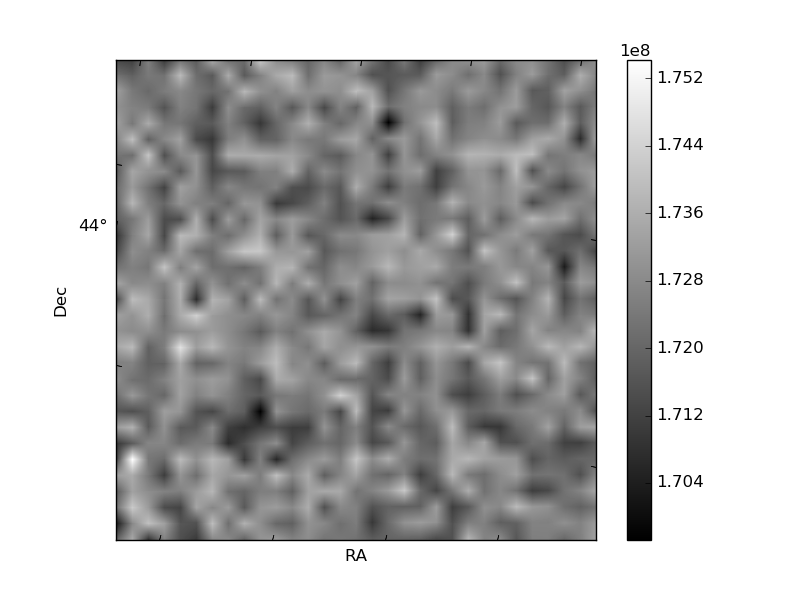
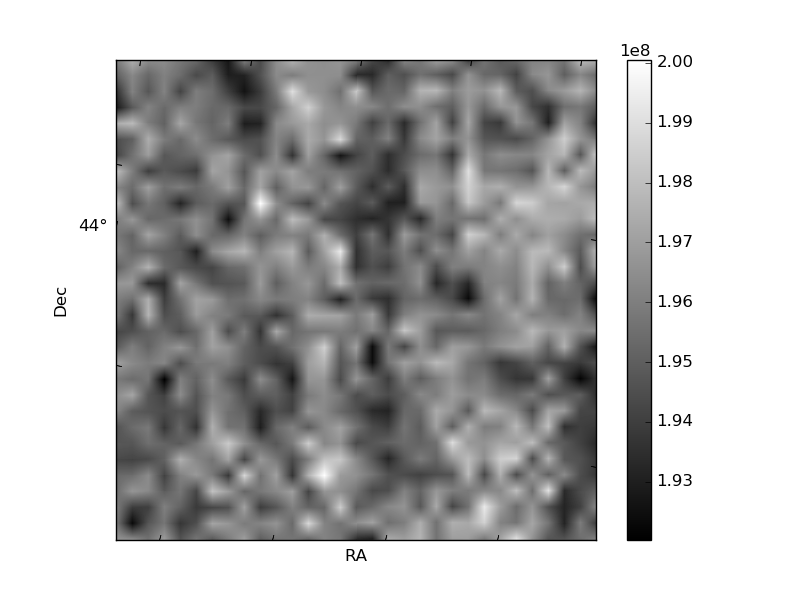
Histogram calculated using DETX and DETY for each event in the final _common_clean file
| Quadrant A |  |
 |
Quadrant B |
|---|---|---|---|
| Quadrant D |  |
 |
Quadrant C |
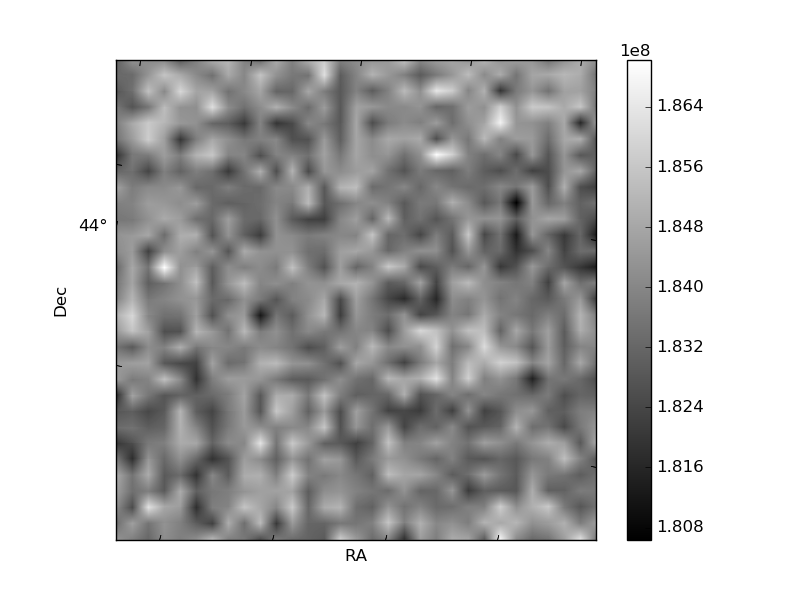
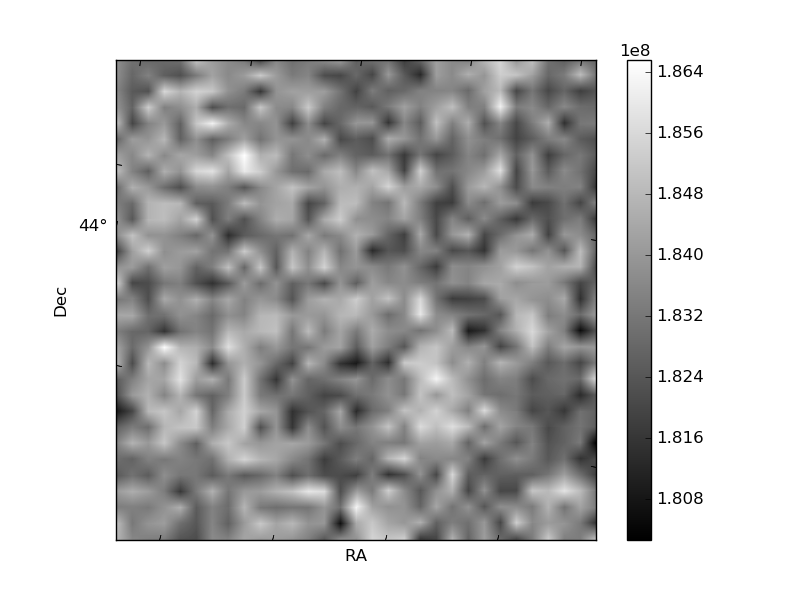
| Plot type | Count rate plots | Images |
|---|---|---|
| Comparison with Poisson distribution Blue bars denote a histogram of data divided into 1 sec bins. Red curve is a Poisson curve with rate = median count rate of data. |
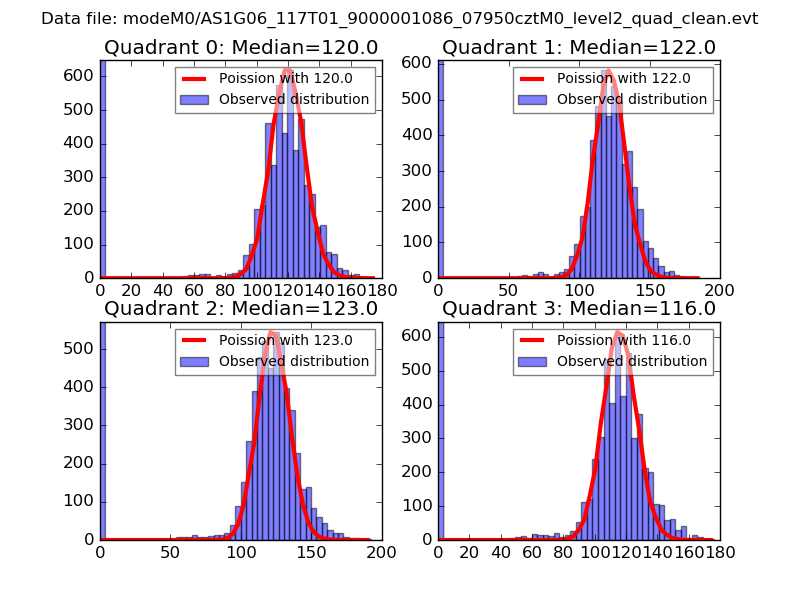 |
 |
| Quadrant-wise count rates Data is divided into 100 sec bins |
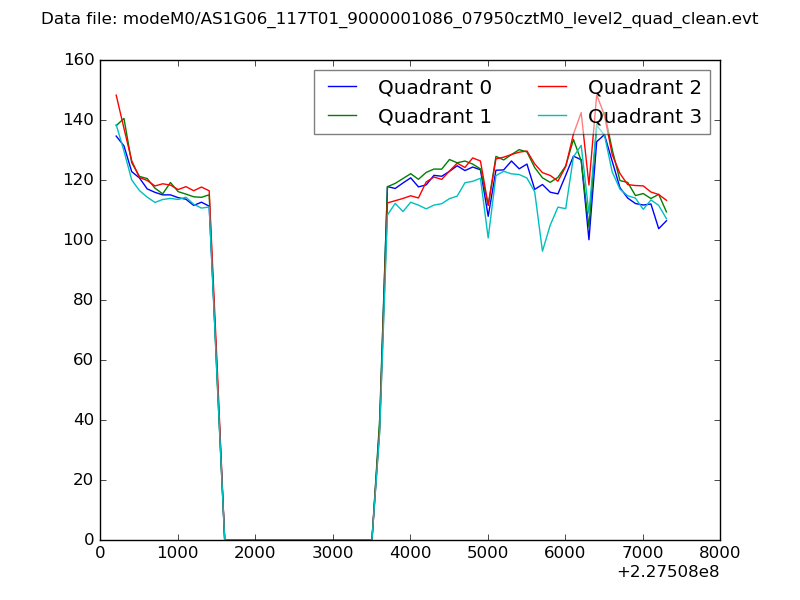 |
|
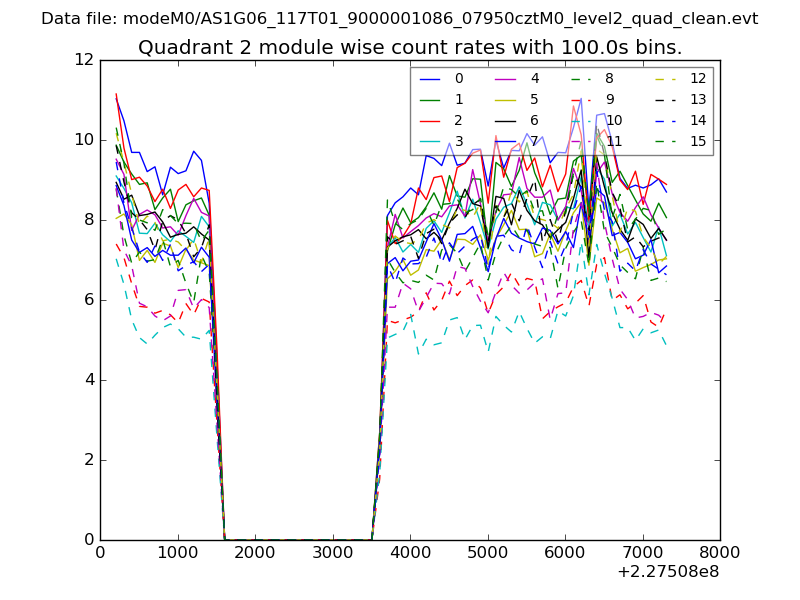
| Module-wise count rates for Quadrant A Data is divided into 100 sec bins |
 |
 |
| Module-wise count rates for Quadrant B Data is divided into 100 sec bins |
 |
 |
| Module-wise count rates for Quadrant C Data is divided into 100 sec bins |
 |
 |
| Module-wise count rates for Quadrant D Data is divided into 100 sec bins |
 |
 |
| Parameter | Plot |
|---|---|
| CZT HV Monitor |  |
| D_VDD |  |
| Temperature 1 |  |
| Veto HV Monitor |  |
| Veto LLD |  |
| Alpha Counter | 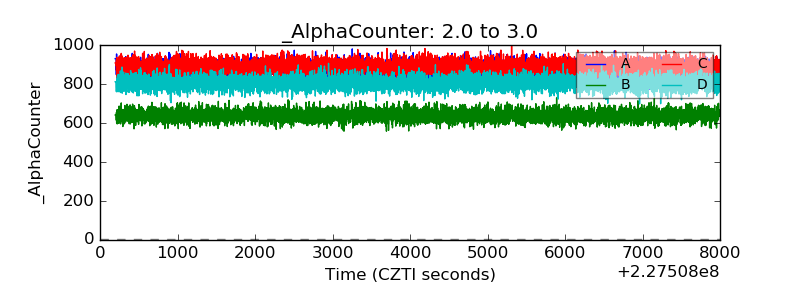 |
| _CPM_Rate | 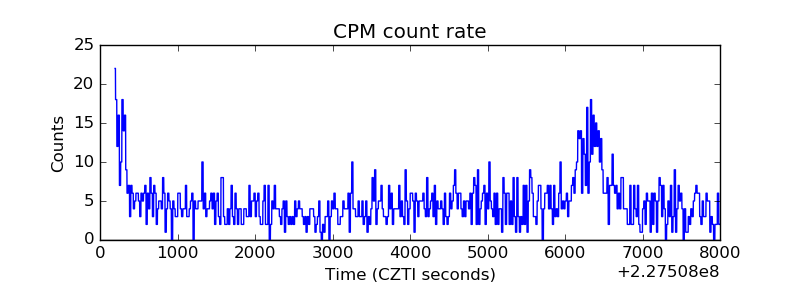 |
| CZT Counter |  |
| +2.5 Volts monitor |  |
| +5 Volts monitor | 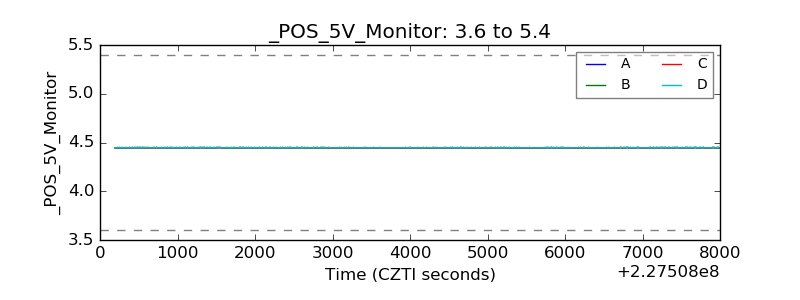 |
| _ROLL_ROT |  |
| _Roll_DEC |  |
| _Roll_RA |  |
| Veto Counter |  |