| Param | Original file | Final file |
|---|---|---|
| Filename | modeM0/AS1G06_117T01_9000001086_07954cztM0_level2.evt | modeM0/AS1G06_117T01_9000001086_07954cztM0_level2_quad_clean.evt |
| Size (bytes) | 204,042,240 | 25,338,240 |
| Size | 194.6 MB | 24.2 MB |
| Events in quadrant A | 1,451,842 | 134,561 |
| Events in quadrant B | 1,498,514 | 137,188 |
| Events in quadrant C | 1,396,195 | 133,794 |
| Events in quadrant D | 1,607,865 | 128,257 |
| Mode SS | |||
|---|---|---|---|
| Quadrant | BADHDUFLAG | Total packets | Discarded packets |
| A | 0 | 66 | 0 |
| B | 0 | 66 | 0 |
| C | 0 | 66 | 0 |
| D | 0 | 66 | 0 |
| Mode M0 | |||
|---|---|---|---|
| Quadrant | BADHDUFLAG | Total packets | Discarded packets |
| A | 0 | 6610 | 1 |
| B | 0 | 6702 | 1 |
| C | 0 | 6589 | 1 |
| D | 0 | 7050 | 1 |
| Quadrant | Total seconds | Saturated seconds | Saturation percentage |
|---|---|---|---|
| A | 3275 | 1 | 0.030534% |
| B | 3275 | 4 | 0.122137% |
| C | 3275 | 3 | 0.091603% |
| D | 3275 | 16 | 0.488550% |
Noise dominated data is calculated using 1-second bins in cleaned event files. If a bin has >2000 counts, and if more than 50% of those come from <1% of pixels, then it is considered to be noise-dominated and hence unusable.
| Quadrant | # 1 sec bins | Bins with >0 counts | Bins with >2000 counts | High rate bins dominated by noise | Noise dominated (total time) | Noise dominated (detector-on time) | Marked lightcurve |
|---|---|---|---|---|---|---|---|
| A | 3275 | 3275 | 0 | 0 | 0.00% | 0.00% |  |
| B | 3275 | 3275 | 2 | 2 | 0.06% | 0.06% |  |
| C | 3275 | 3275 | 0 | 0 | 0.00% | 0.00% |  |
| D | 3275 | 3275 | 11 | 11 | 0.34% | 0.34% |  |
Top three noisy pixels from each quadrant. If the there are fewer than three noisy pixels in the level2.evt file, extra rows are filled as -1
| Pixel properties | Quadrant properties | ||||||
|---|---|---|---|---|---|---|---|
| Quadrant | DetID | PixID | Counts | Sigma | Mean | Median | Sigma |
| A | 13 | 14 | 4729 | 55.4 | 374 | 366 | 78.8 |
| A | 8 | 15 | 3853 | 44.27 | 374 | 366 | 78.8 |
| A | 0 | 226 | 3557 | 40.51 | 374 | 366 | 78.8 |
| B | 0 | 214 | 17585 | 232.34 | 374 | 364 | 74.1 |
| B | 4 | 239 | 17146 | 226.41 | 374 | 364 | 74.1 |
| B | 12 | 111 | 8156 | 105.12 | 374 | 364 | 74.1 |
| C | 1 | 16 | 3220 | 34.17 | 356 | 357 | 83.8 |
| C | 13 | 61 | 2782 | 28.94 | 356 | 357 | 83.8 |
| C | 14 | 67 | 1193 | 9.98 | 356 | 357 | 83.8 |
| D | 1 | 52 | 98395 | 1004.43 | 354 | 345 | 97.6 |
| D | 2 | 136 | 54381 | 553.55 | 354 | 345 | 97.6 |
| D | 5 | 233 | 35161 | 356.66 | 354 | 345 | 97.6 |
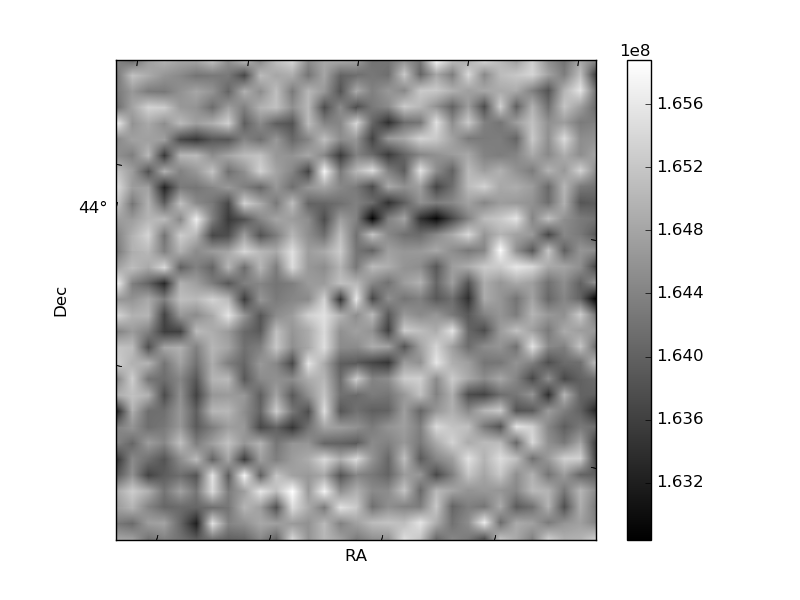
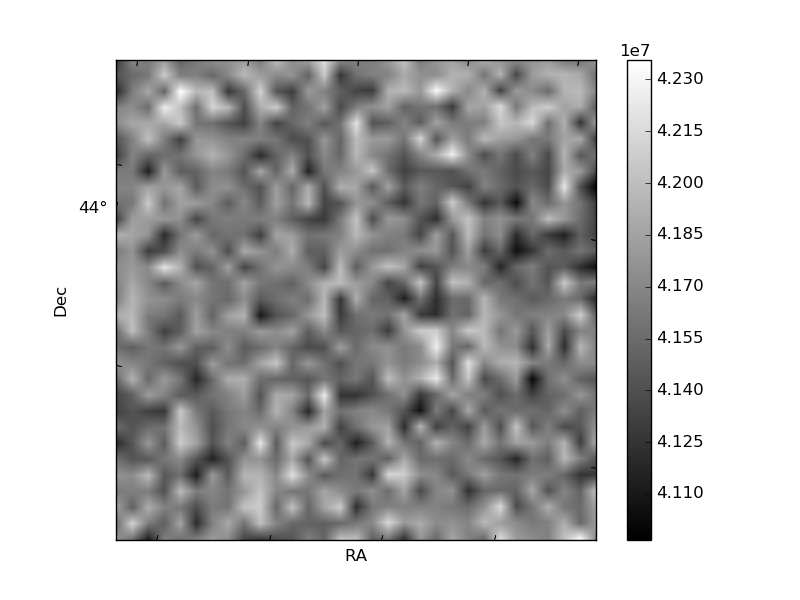
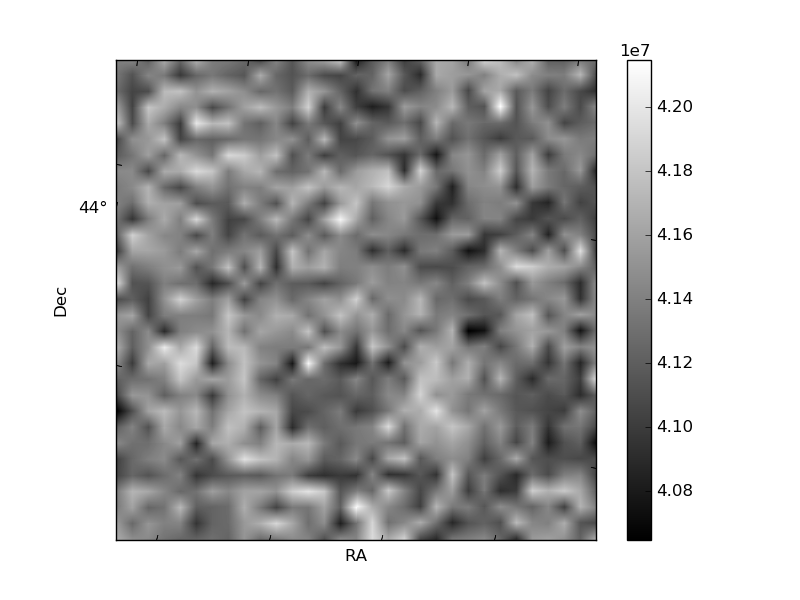
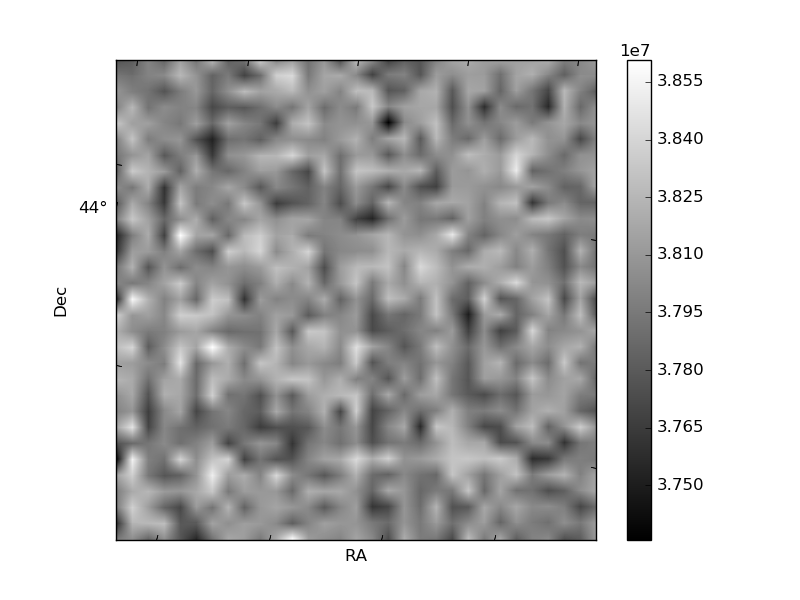
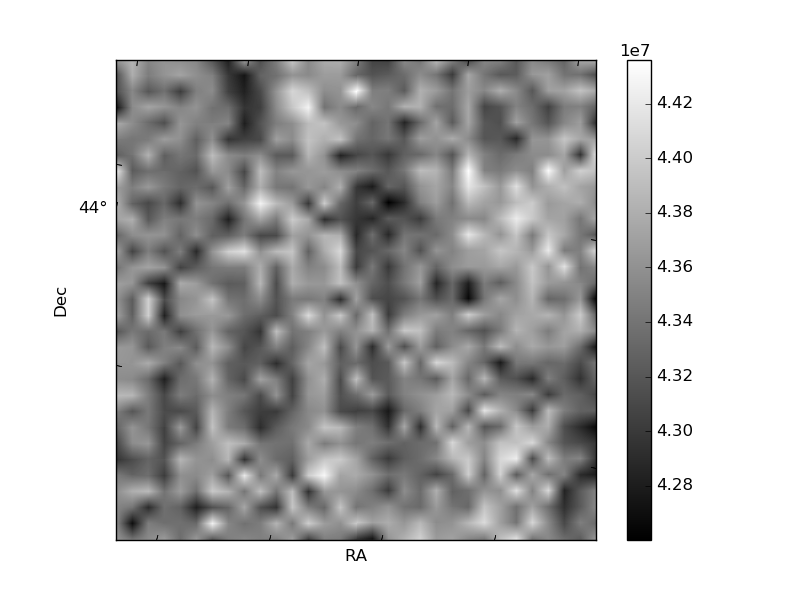
Histogram calculated using DETX and DETY for each event in the final _common_clean file
| Quadrant A | 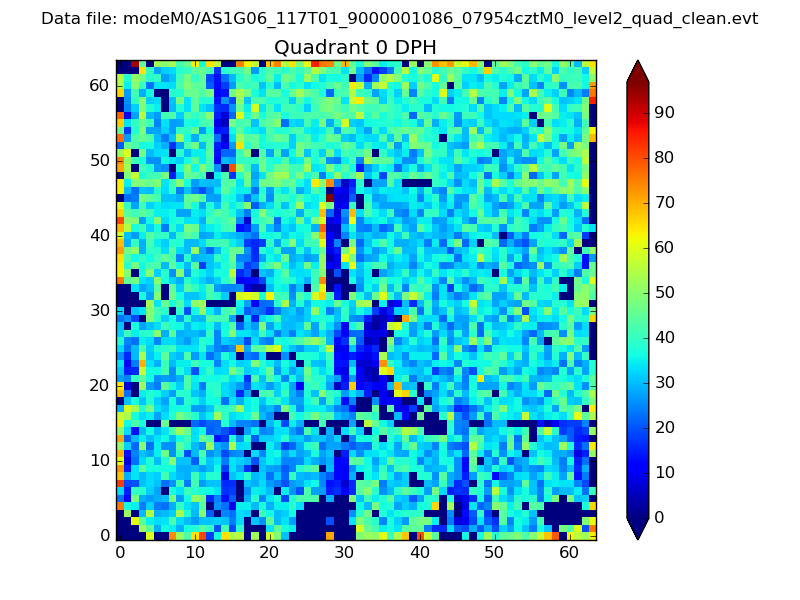 |
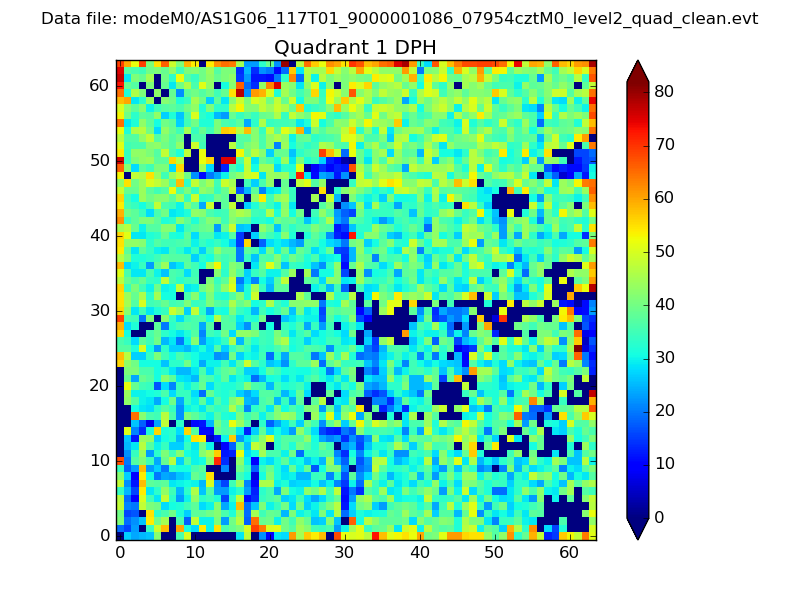 |
Quadrant B |
|---|---|---|---|
| Quadrant D | 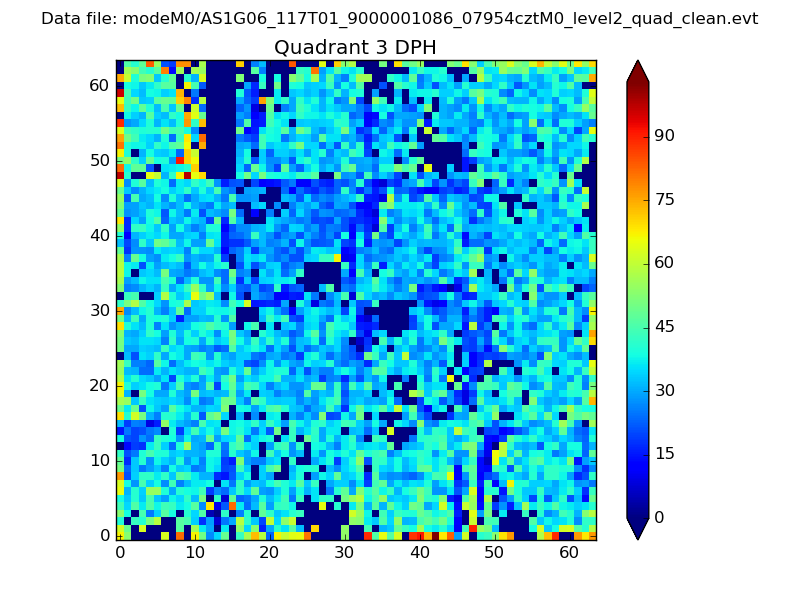 |
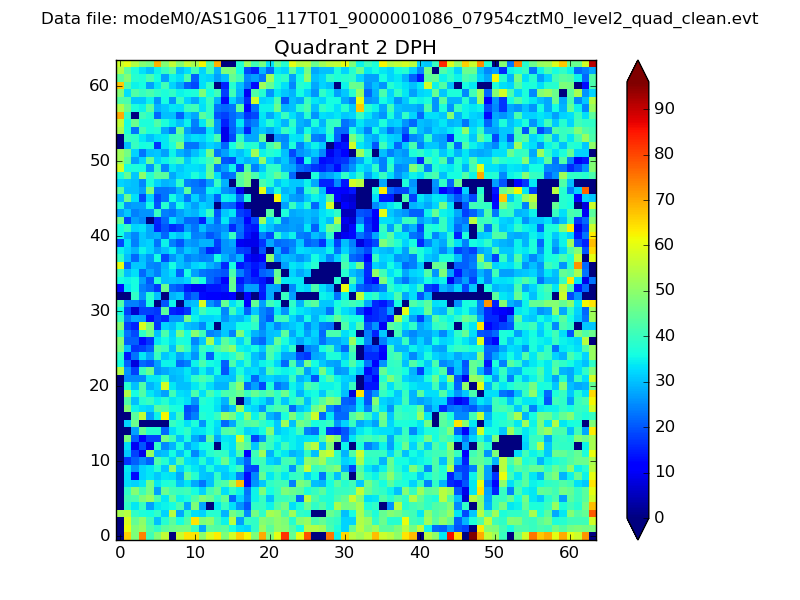 |
Quadrant C |
| Plot type | Count rate plots | Images |
|---|---|---|
| Comparison with Poisson distribution Blue bars denote a histogram of data divided into 1 sec bins. Red curve is a Poisson curve with rate = median count rate of data. |
 |
 |
| Quadrant-wise count rates Data is divided into 100 sec bins |
 |
|
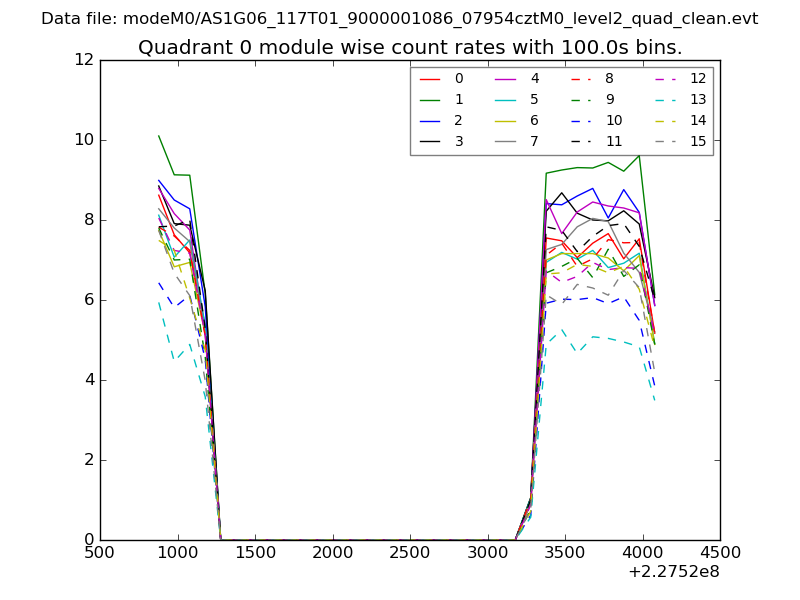
| Module-wise count rates for Quadrant A Data is divided into 100 sec bins |
 |
 |
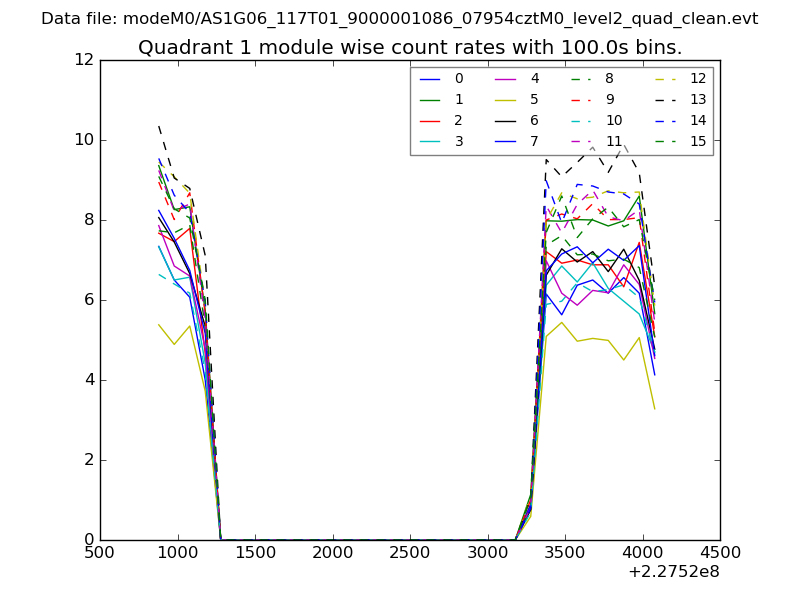
| Module-wise count rates for Quadrant B Data is divided into 100 sec bins |
 |
 |
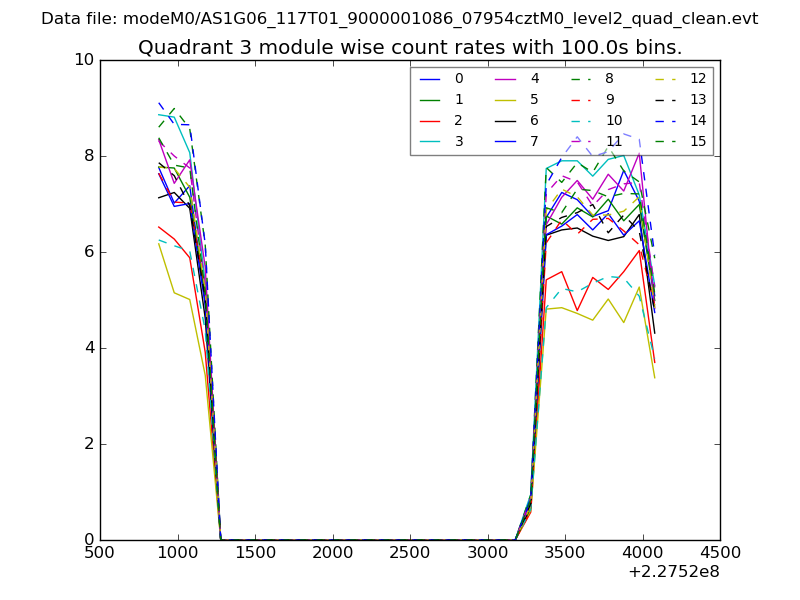
| Module-wise count rates for Quadrant C Data is divided into 100 sec bins |
 |
 |
| Module-wise count rates for Quadrant D Data is divided into 100 sec bins |
 |
 |
| Parameter | Plot |
|---|---|
| CZT HV Monitor | 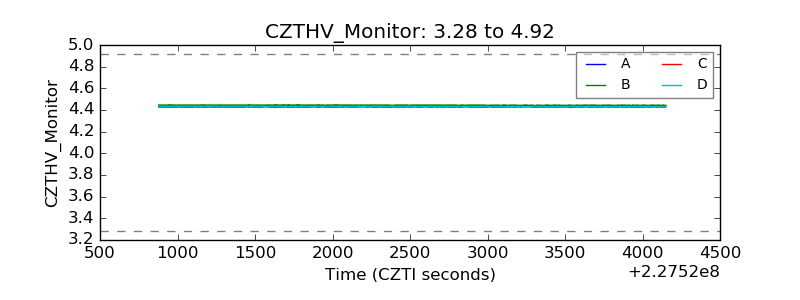 |
| D_VDD | 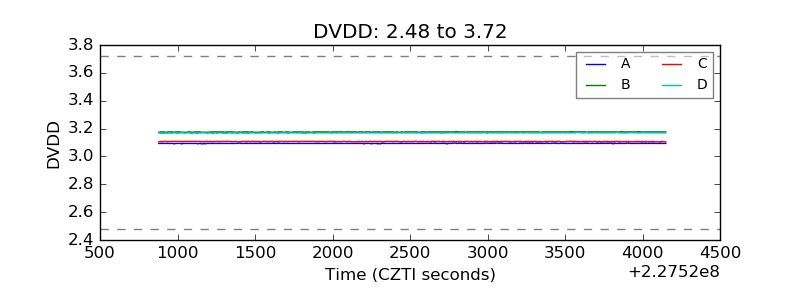 |
| Temperature 1 | 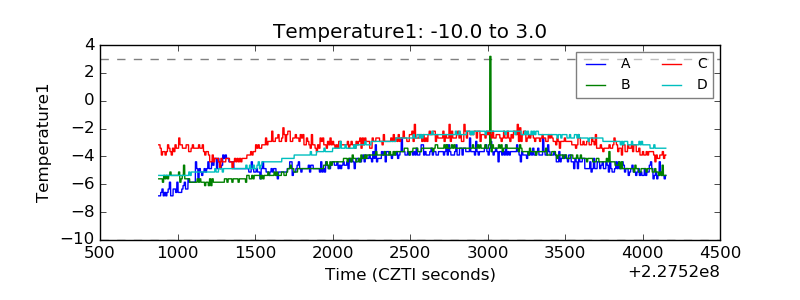 |
| Veto HV Monitor | 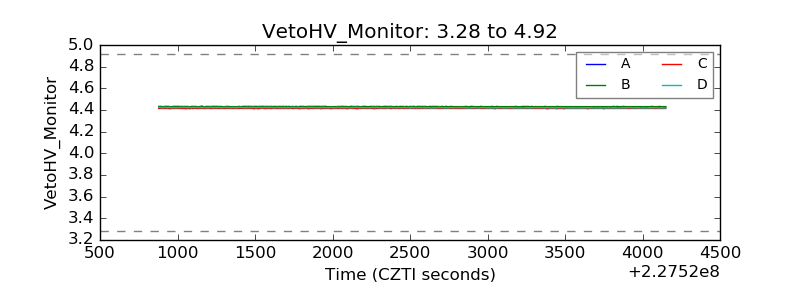 |
| Veto LLD | 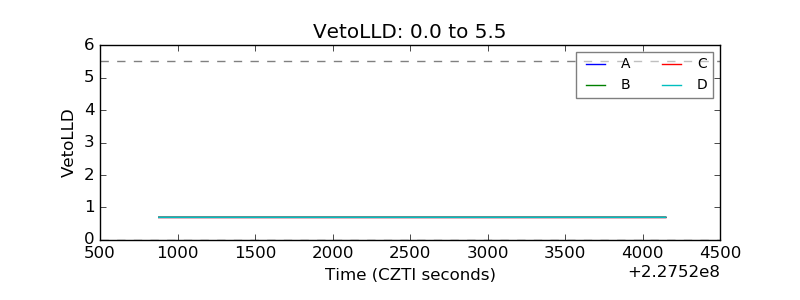 |
| Alpha Counter |  |
| _CPM_Rate | 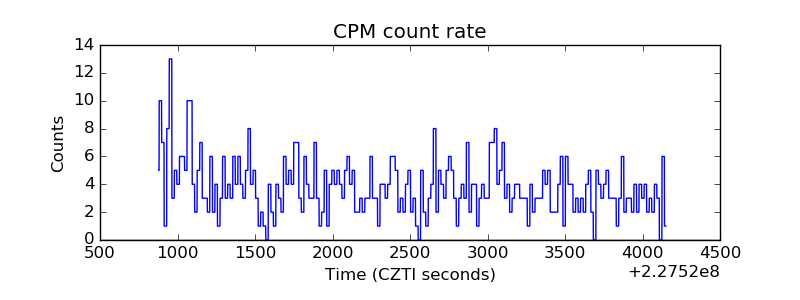 |
| CZT Counter | 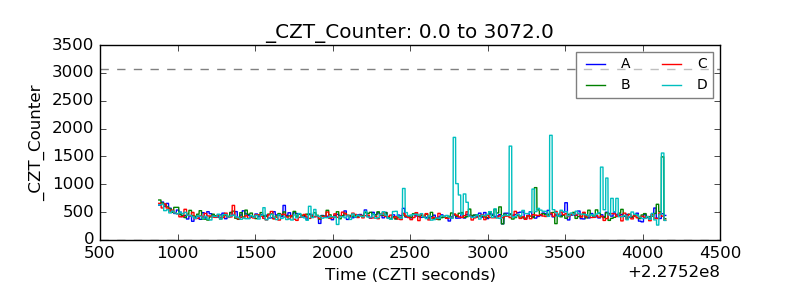 |
| +2.5 Volts monitor |  |
| +5 Volts monitor |  |
| _ROLL_ROT | 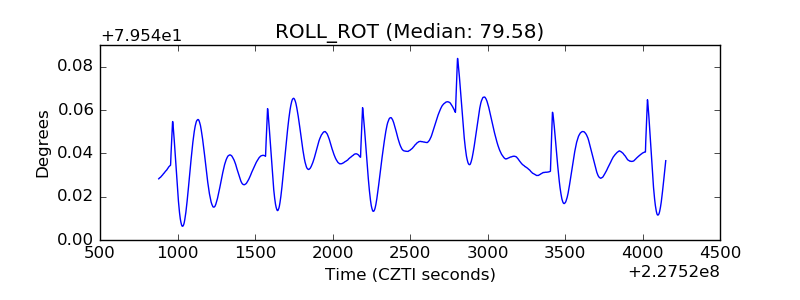 |
| _Roll_DEC | 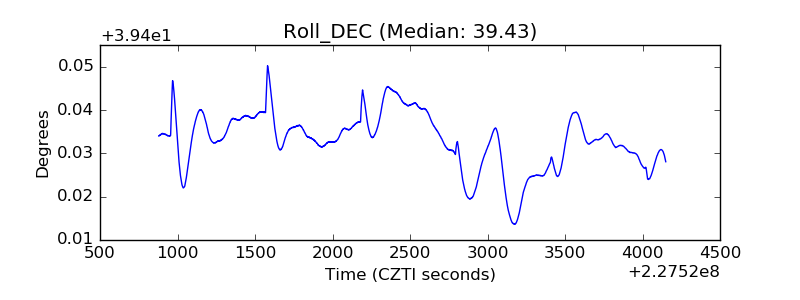 |
| _Roll_RA | 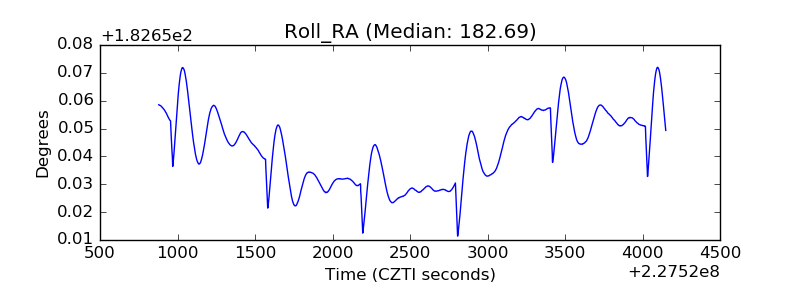 |
| Veto Counter | 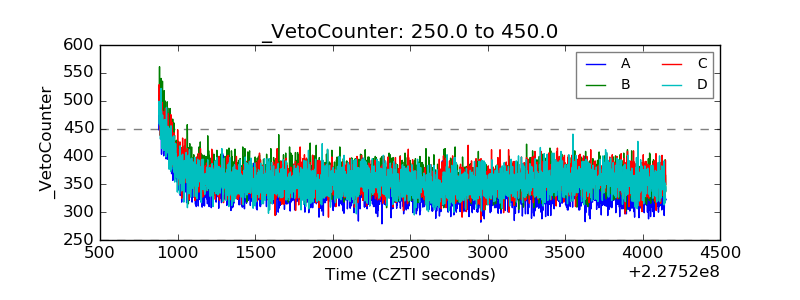 |