| Param | Original file | Final file |
|---|---|---|
| Filename | modeM0/AS1G06_071T01_9000001088cztM0_level2.fits | modeM0/AS1G06_071T01_9000001088cztM0_level2_quad_clean.evt |
| Size (bytes) | 142,606,080 | 99,492,480 |
| Size | 136.0 MB | 94.9 MB |
| Events in quadrant A | 843,886 | 499,607 |
| Events in quadrant B | 819,526 | 497,804 |
| Events in quadrant C | 838,948 | 476,578 |
| Events in quadrant D | 714,070 | 435,773 |
| Mode M9 | |||
|---|---|---|---|
| Quadrant | BADHDUFLAG | Total packets | Discarded packets |
| A | 0 | 15 | 0 |
| B | 0 | 15 | 0 |
| C | 0 | 15 | 0 |
| D | 0 | 15 | 0 |
| Mode M0 | |||
|---|---|---|---|
| Quadrant | BADHDUFLAG | Total packets | Discarded packets |
| A | 0 | 34072 | 0 |
| B | 0 | 35314 | 0 |
| C | 0 | 33174 | 0 |
| D | 0 | 39217 | 0 |
| Mode SS | |||
|---|---|---|---|
| Quadrant | BADHDUFLAG | Total packets | Discarded packets |
| A | 0 | 328 | 0 |
| B | 0 | 328 | 0 |
| C | 0 | 328 | 0 |
| D | 0 | 328 | 0 |
| Quadrant | Total seconds | Saturated seconds | Saturation percentage |
|---|---|---|---|
| A | 15967 | 369 | 2.311016% |
| B | 15968 | 409 | 2.561373% |
| C | 15966 | 211 | 1.321558% |
| D | 15962 | 571 | 3.577246% |
Noise dominated data is calculated using 1-second bins in cleaned event files. If a bin has >2000 counts, and if more than 50% of those come from <1% of pixels, then it is considered to be noise-dominated and hence unusable.
| Quadrant | # 1 sec bins | Bins with >0 counts | Bins with >2000 counts | High rate bins dominated by noise | Noise dominated (total time) | Noise dominated (detector-on time) | Marked lightcurve |
|---|---|---|---|---|---|---|---|
| A | 17594 | 15965 | 0 | 0 | 0.00% | 0.00% | 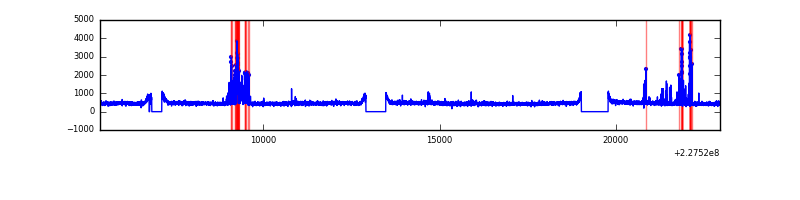 |
| B | 17594 | 15966 | 0 | 0 | 0.00% | 0.00% |  |
| C | 17594 | 15969 | 0 | 0 | 0.00% | 0.00% | 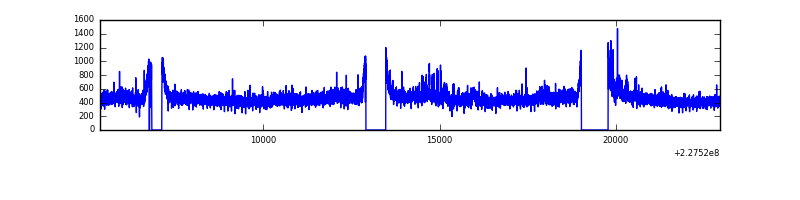 |
| D | 17594 | 15967 | 0 | 0 | 0.00% | 0.00% |  |
Top three noisy pixels from each quadrant. If the there are fewer than three noisy pixels in the level2.evt file, extra rows are filled as -1
| Pixel properties | Quadrant properties | ||||||
|---|---|---|---|---|---|---|---|
| Quadrant | DetID | PixID | Counts | Sigma | Mean | Median | Sigma |
| A | 14 | 188 | 863 | 11.52 | 218 | 203 | 57.2 |
| A | 0 | 29 | 826 | 10.88 | 218 | 203 | 57.2 |
| A | 14 | 204 | 739 | 9.36 | 218 | 203 | 57.2 |
| B | 2 | 9 | 757 | 11.87 | 216 | 205 | 46.5 |
| B | 14 | 254 | 579 | 8.04 | 216 | 205 | 46.5 |
| B | 2 | 8 | 564 | 7.72 | 216 | 205 | 46.5 |
| C | 12 | 241 | 604 | 6.66 | 221 | 205 | 59.9 |
| C | 2 | 191 | 549 | 5.74 | 221 | 205 | 59.9 |
| C | 7 | 111 | 548 | 5.72 | 221 | 205 | 59.9 |
| D | 6 | 231 | 551 | 6.43 | 204 | 185 | 56.9 |
| D | 6 | 38 | 535 | 6.15 | 204 | 185 | 56.9 |
| D | 7 | 5 | 516 | 5.81 | 204 | 185 | 56.9 |
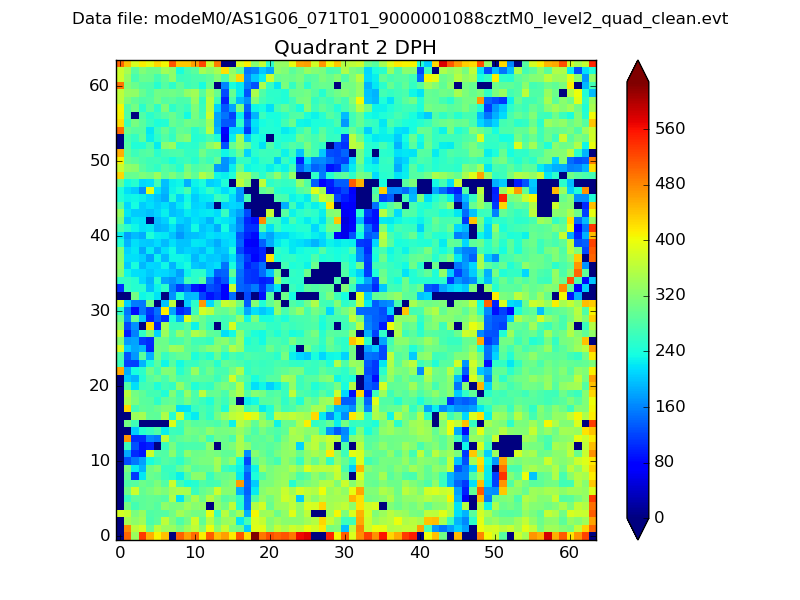
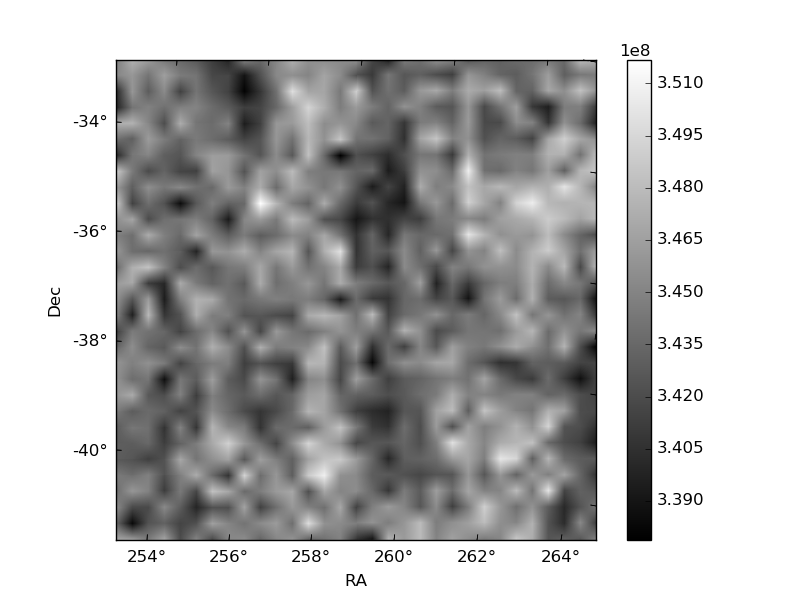
Histogram calculated using DETX and DETY for each event in the final _common_clean file
| Quadrant A | 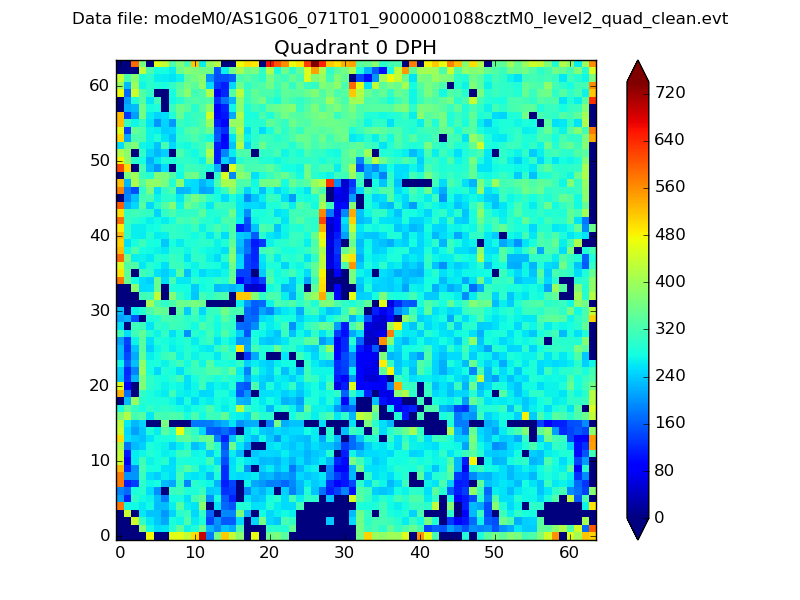 |
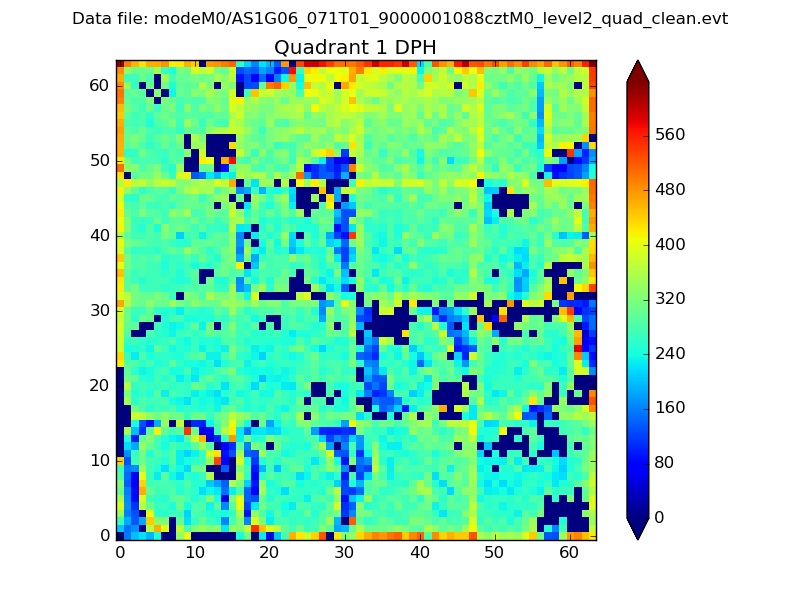 |
Quadrant B |
|---|---|---|---|
| Quadrant D | 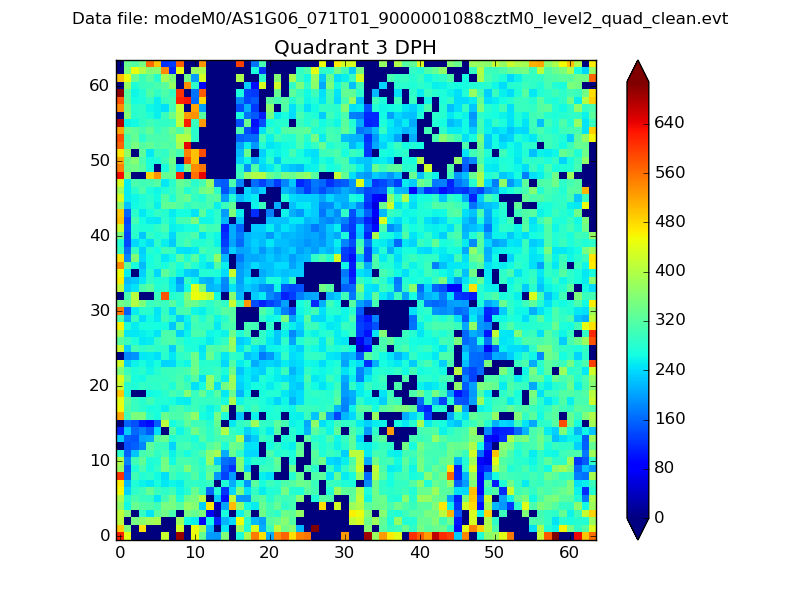 |
 |
Quadrant C |
| Plot type | Count rate plots | Images |
|---|---|---|
| Comparison with Poisson distribution Blue bars denote a histogram of data divided into 1 sec bins. Red curve is a Poisson curve with rate = median count rate of data. |
 |
 |
| Quadrant-wise count rates Data is divided into 100 sec bins |
 |
|
| Module-wise count rates for Quadrant A Data is divided into 100 sec bins |
 |
 |
| Module-wise count rates for Quadrant B Data is divided into 100 sec bins |
 |
 |
| Module-wise count rates for Quadrant C Data is divided into 100 sec bins |
 |
 |
| Module-wise count rates for Quadrant D Data is divided into 100 sec bins |
 |
 |
| Parameter | Plot |
|---|---|
| CZT HV Monitor |  |
| D_VDD | 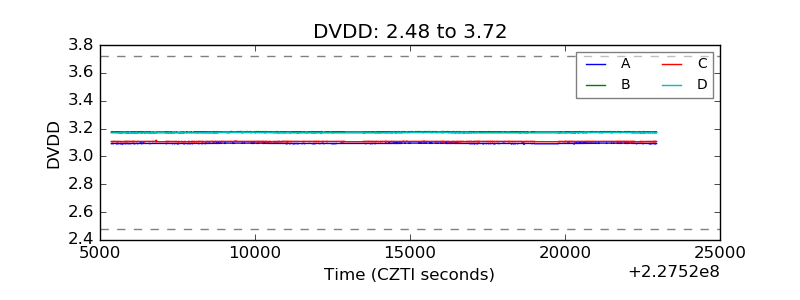 |
| Temperature 1 | 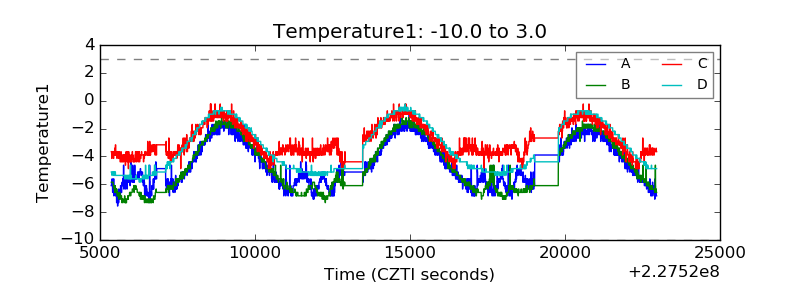 |
| Veto HV Monitor |  |
| Veto LLD |  |
| Alpha Counter | 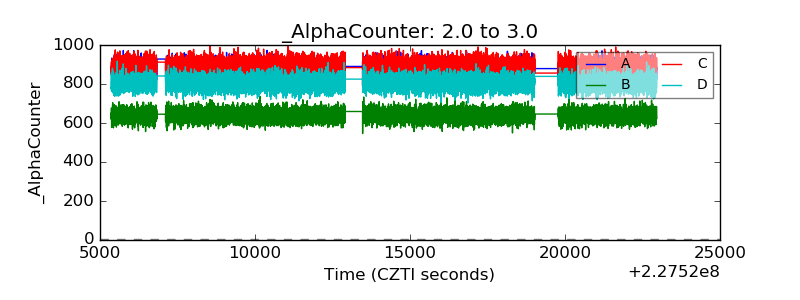 |
| _CPM_Rate |  |
| CZT Counter |  |
| +2.5 Volts monitor | 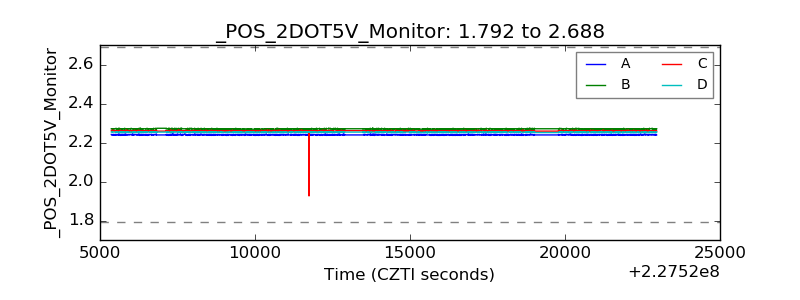 |
| +5 Volts monitor |  |
| _ROLL_ROT |  |
| _Roll_DEC |  |
| _Roll_RA |  |
| Veto Counter |  |