| Param | Original file | Final file |
|---|---|---|
| Filename | modeM0/AS1G06_071T01_9000001088_07954cztM0_level2.evt | modeM0/AS1G06_071T01_9000001088_07954cztM0_level2_quad_clean.evt |
| Size (bytes) | 490,250,880 | 87,122,880 |
| Size | 467.5 MB | 83.1 MB |
| Events in quadrant A | 3,359,956 | 550,168 |
| Events in quadrant B | 3,438,053 | 559,832 |
| Events in quadrant C | 3,022,367 | 552,970 |
| Events in quadrant D | 4,575,423 | 511,743 |
| Mode M9 | |||
|---|---|---|---|
| Quadrant | BADHDUFLAG | Total packets | Discarded packets |
| A | 0 | 3 | 0 |
| B | 0 | 3 | 0 |
| C | 0 | 3 | 0 |
| D | 0 | 3 | 0 |
| Mode M0 | |||
|---|---|---|---|
| Quadrant | BADHDUFLAG | Total packets | Discarded packets |
| A | 0 | 14547 | 5 |
| B | 0 | 14558 | 2 |
| C | 0 | 13596 | 6 |
| D | 0 | 18145 | 30 |
| Mode SS | |||
|---|---|---|---|
| Quadrant | BADHDUFLAG | Total packets | Discarded packets |
| A | 0 | 136 | 0 |
| B | 0 | 136 | 0 |
| C | 0 | 136 | 0 |
| D | 0 | 136 | 0 |
| Quadrant | Total seconds | Saturated seconds | Saturation percentage |
|---|---|---|---|
| A | 6642 | 224 | 3.372478% |
| B | 6643 | 215 | 3.236490% |
| C | 6641 | 125 | 1.882247% |
| D | 6636 | 427 | 6.434599% |
Noise dominated data is calculated using 1-second bins in cleaned event files. If a bin has >2000 counts, and if more than 50% of those come from <1% of pixels, then it is considered to be noise-dominated and hence unusable.
| Quadrant | # 1 sec bins | Bins with >0 counts | Bins with >2000 counts | High rate bins dominated by noise | Noise dominated (total time) | Noise dominated (detector-on time) | Marked lightcurve |
|---|---|---|---|---|---|---|---|
| A | 6943 | 6644 | 37 | 37 | 0.53% | 0.56% | 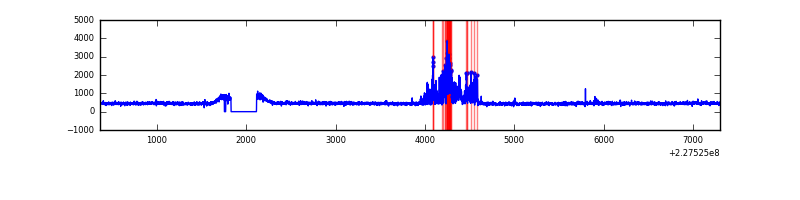 |
| B | 6943 | 6645 | 34 | 34 | 0.49% | 0.51% | 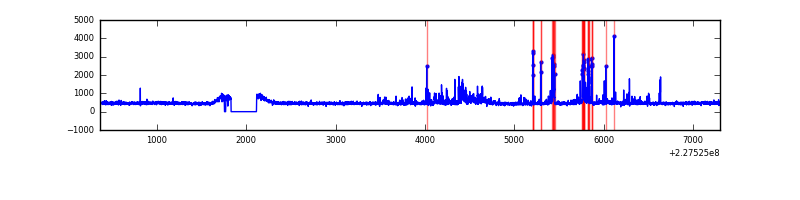 |
| C | 6943 | 6645 | 0 | 0 | 0.00% | 0.00% | 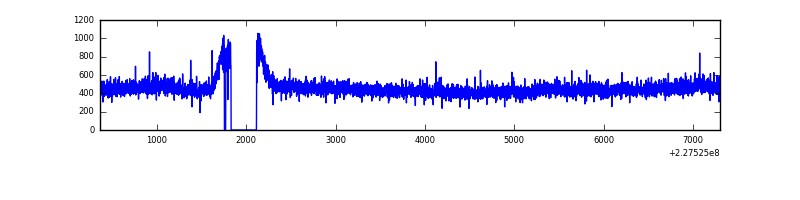 |
| D | 6943 | 6644 | 207 | 207 | 2.98% | 3.12% | 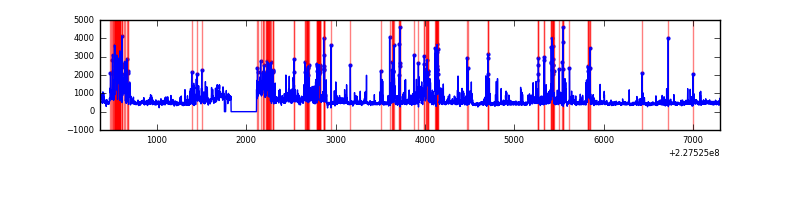 |
Top three noisy pixels from each quadrant. If the there are fewer than three noisy pixels in the level2.evt file, extra rows are filled as -1
| Pixel properties | Quadrant properties | ||||||
|---|---|---|---|---|---|---|---|
| Quadrant | DetID | PixID | Counts | Sigma | Mean | Median | Sigma |
| A | 15 | 223 | 333578 | 2101.13 | 773 | 753 | 158.4 |
| A | 13 | 14 | 13198 | 78.57 | 773 | 753 | 158.4 |
| A | 3 | 1 | 11674 | 68.94 | 773 | 753 | 158.4 |
| B | 4 | 239 | 269606 | 1773.88 | 783 | 763 | 151.6 |
| B | 11 | 51 | 46077 | 298.99 | 783 | 763 | 151.6 |
| B | 10 | 16 | 34007 | 219.35 | 783 | 763 | 151.6 |
| C | 1 | 16 | 28911 | 158.08 | 763 | 767 | 178.0 |
| C | 14 | 67 | 12107 | 63.7 | 763 | 767 | 178.0 |
| C | 13 | 61 | 5750 | 27.99 | 763 | 767 | 178.0 |
| D | 1 | 52 | 1076530 | 5918.08 | 744 | 720 | 181.8 |
| D | 13 | 104 | 252299 | 1383.95 | 744 | 720 | 181.8 |
| D | 2 | 136 | 112333 | 613.99 | 744 | 720 | 181.8 |
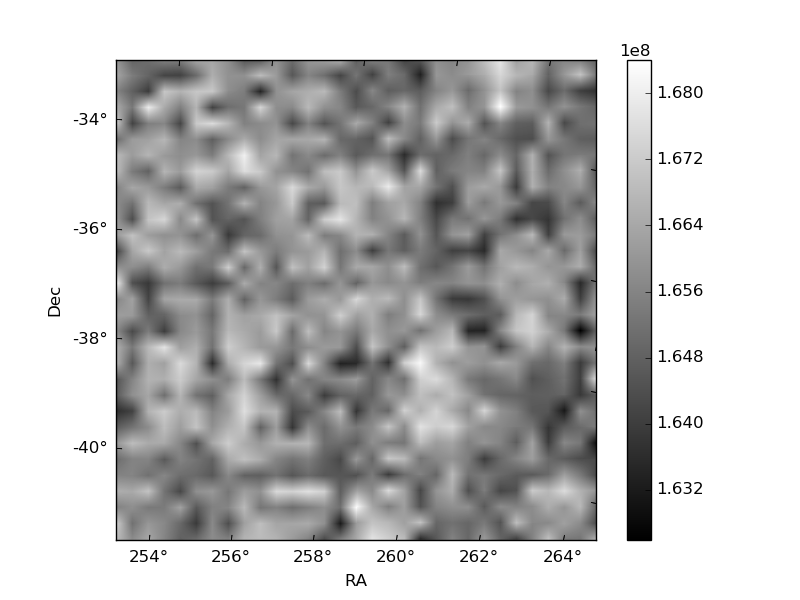
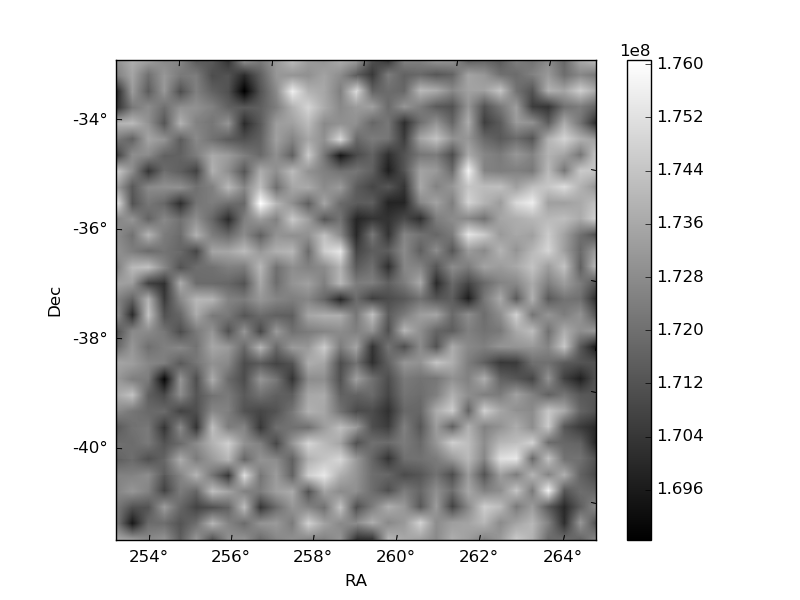
Histogram calculated using DETX and DETY for each event in the final _common_clean file
| Quadrant A | 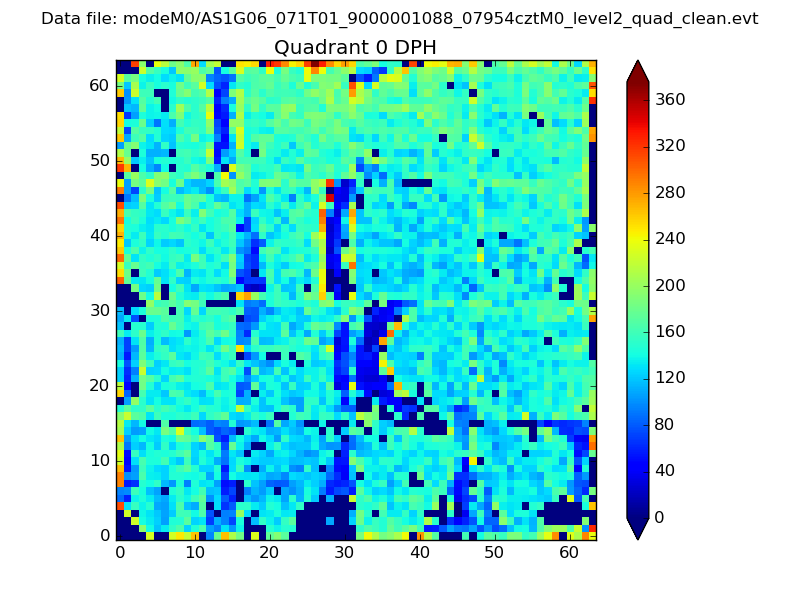 |
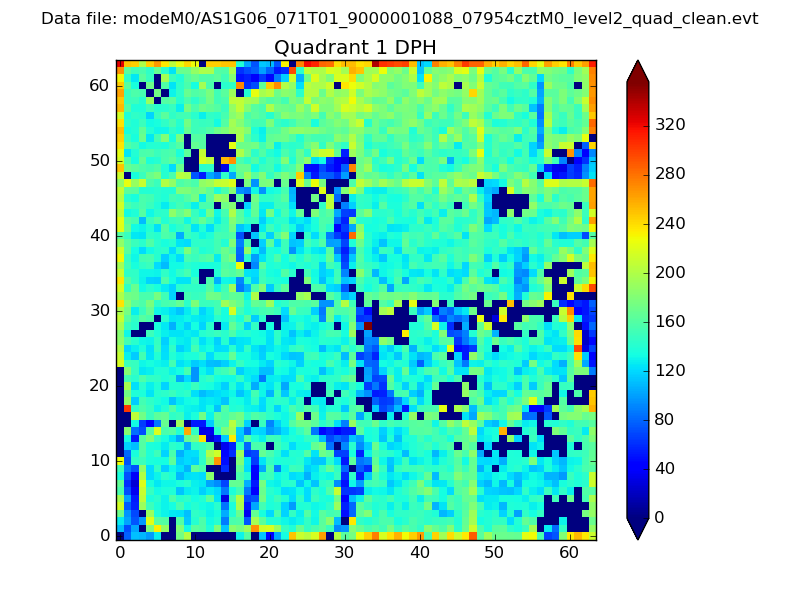 |
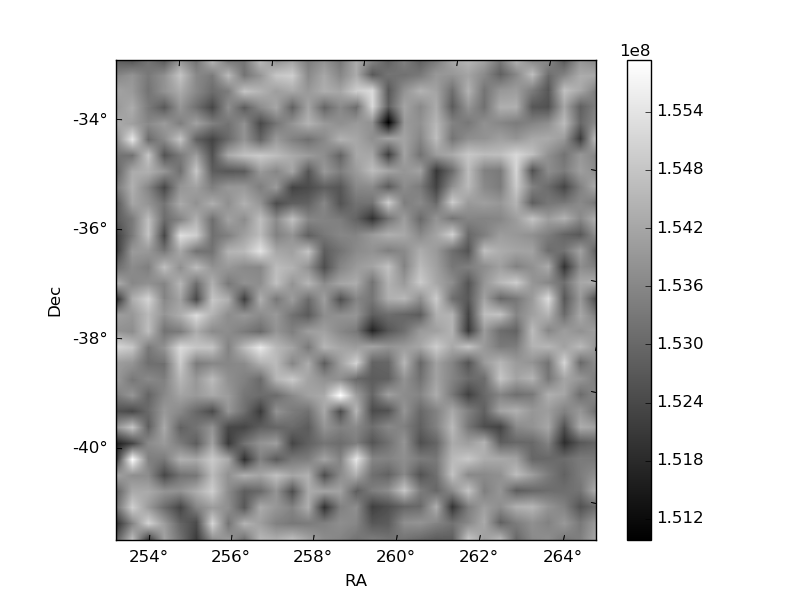
Quadrant B |
|---|---|---|---|
| Quadrant D | 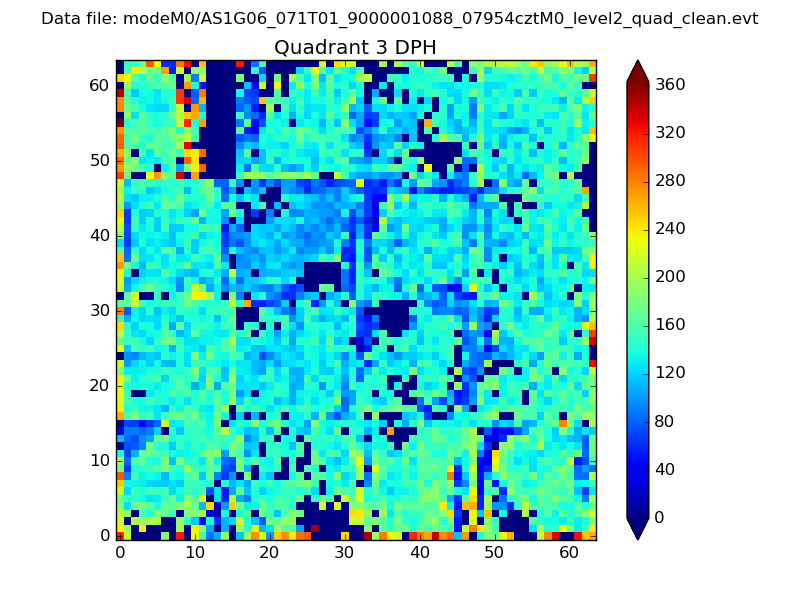 |
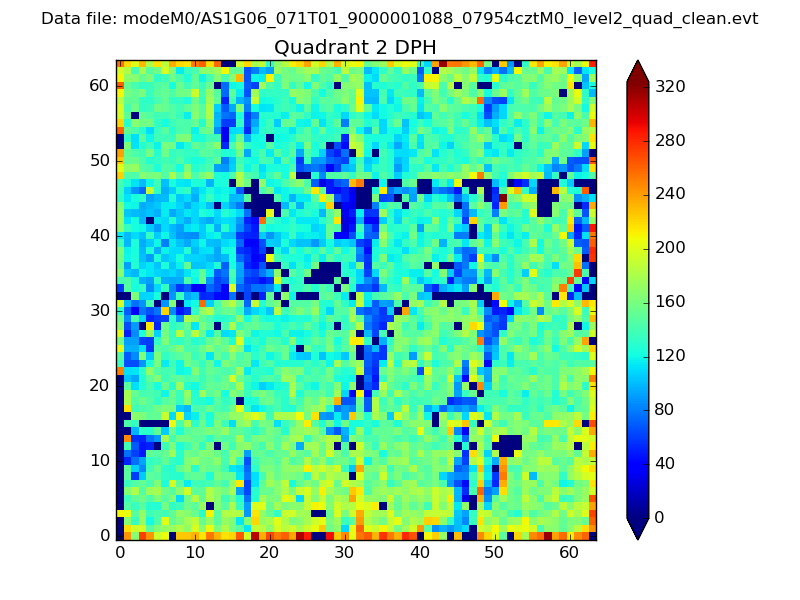 |
Quadrant C |
| Plot type | Count rate plots | Images |
|---|---|---|
| Comparison with Poisson distribution Blue bars denote a histogram of data divided into 1 sec bins. Red curve is a Poisson curve with rate = median count rate of data. |
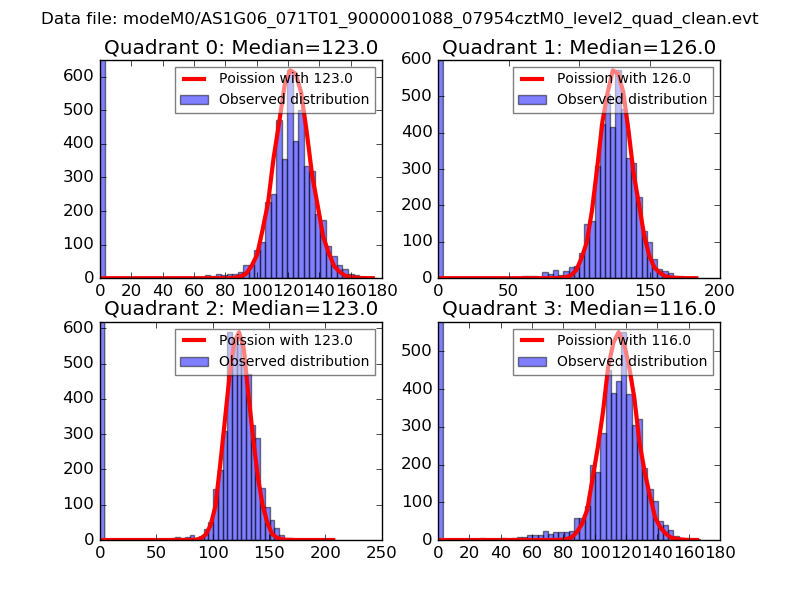 |
 |
| Quadrant-wise count rates Data is divided into 100 sec bins |
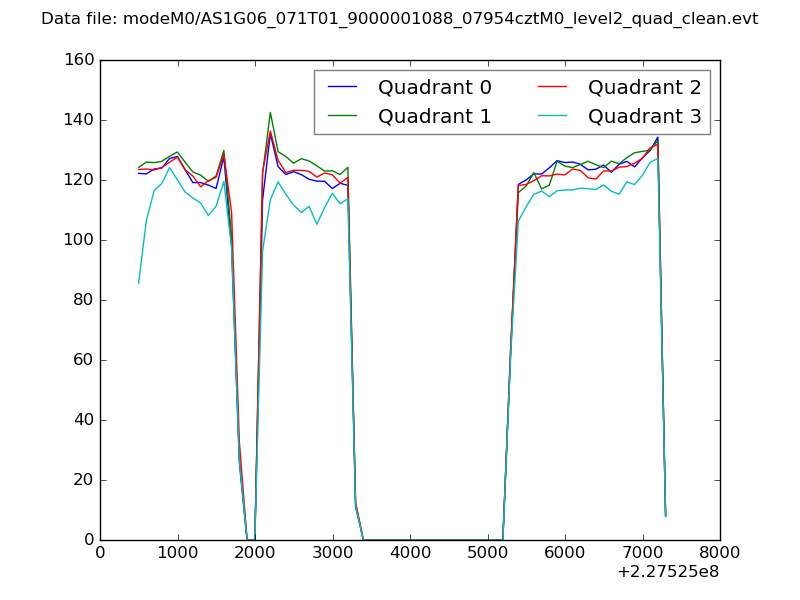 |
|
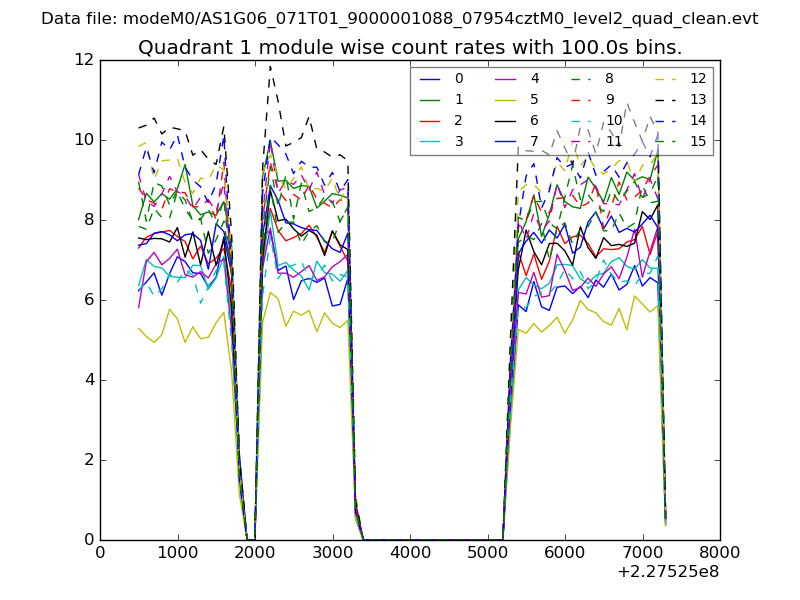
| Module-wise count rates for Quadrant A Data is divided into 100 sec bins |
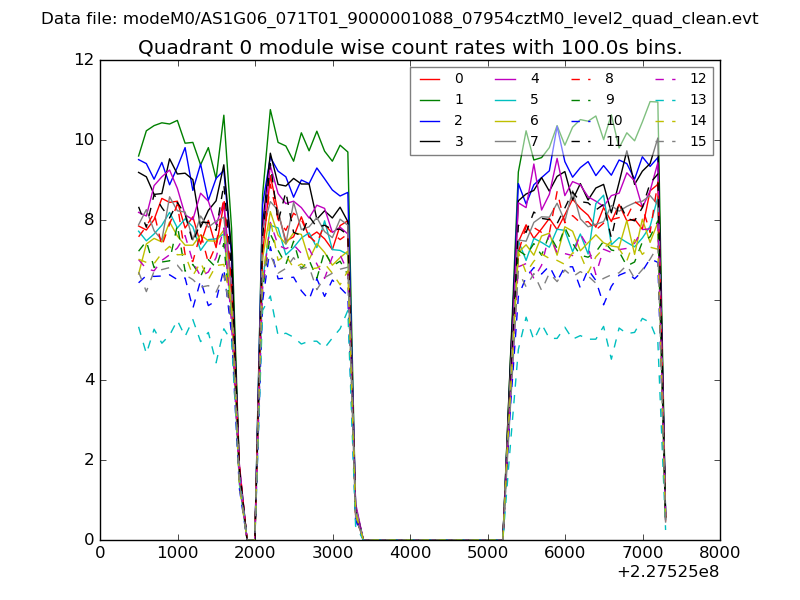 |
 |
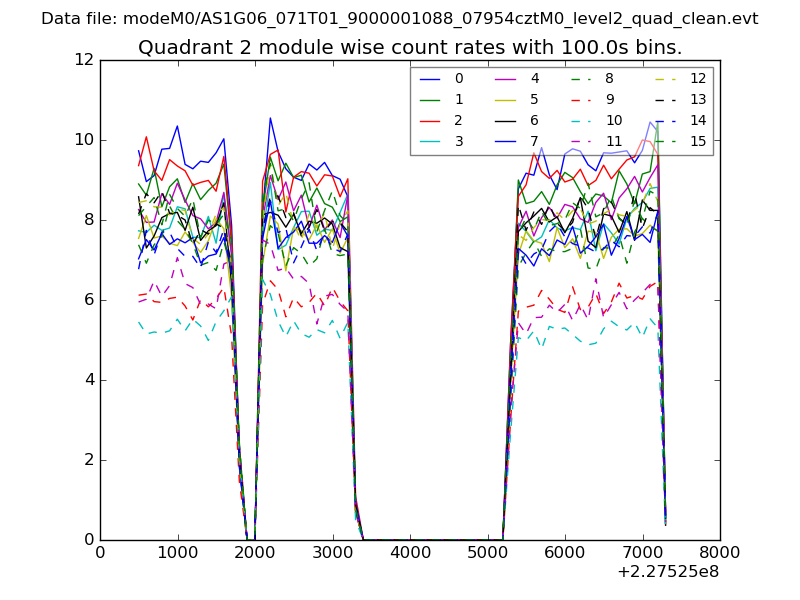
| Module-wise count rates for Quadrant B Data is divided into 100 sec bins |
 |
 |
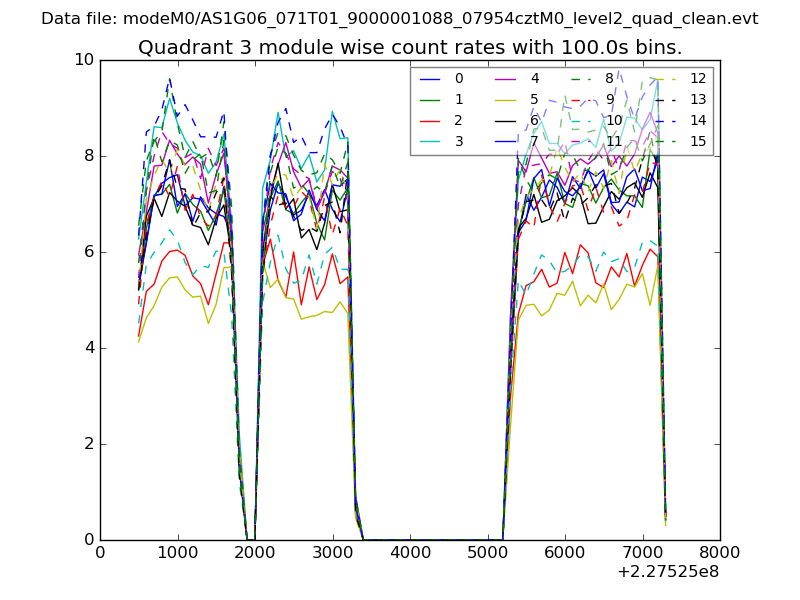
| Module-wise count rates for Quadrant C Data is divided into 100 sec bins |
 |
 |
| Module-wise count rates for Quadrant D Data is divided into 100 sec bins |
 |
 |
| Parameter | Plot |
|---|---|
| CZT HV Monitor | 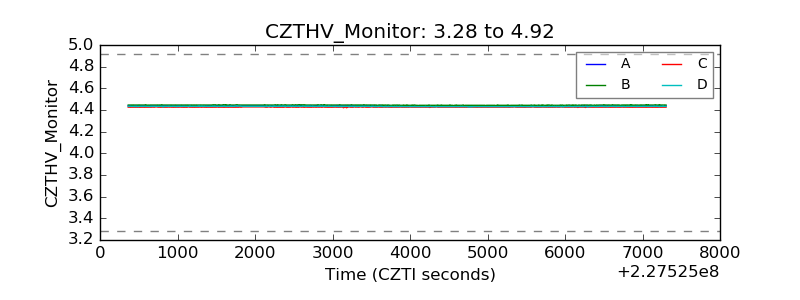 |
| D_VDD |  |
| Temperature 1 | 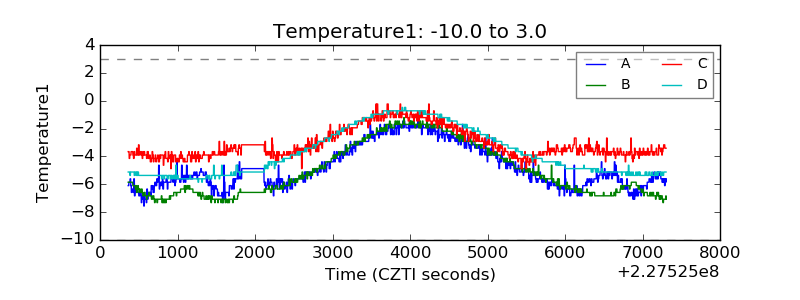 |
| Veto HV Monitor | 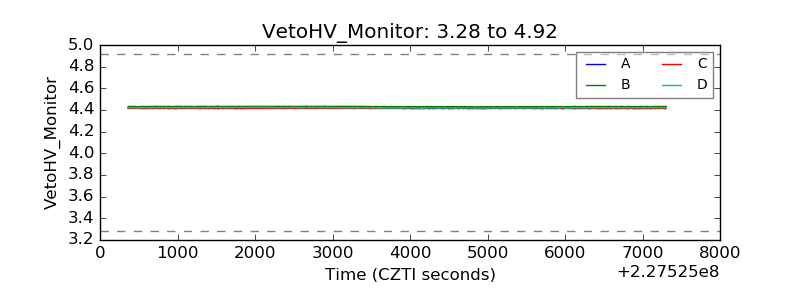 |
| Veto LLD | 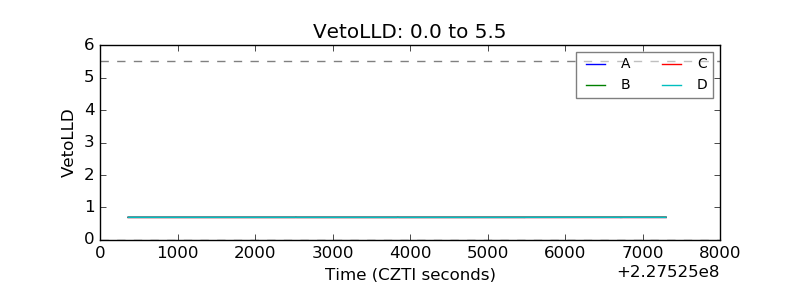 |
| Alpha Counter | 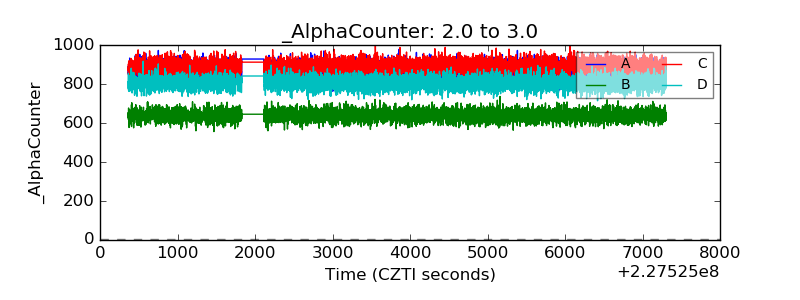 |
| _CPM_Rate | 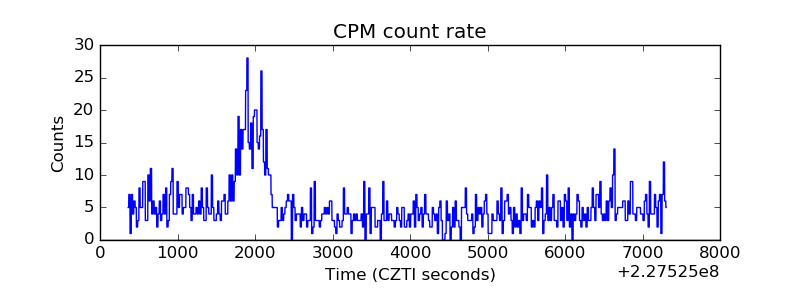 |
| CZT Counter | 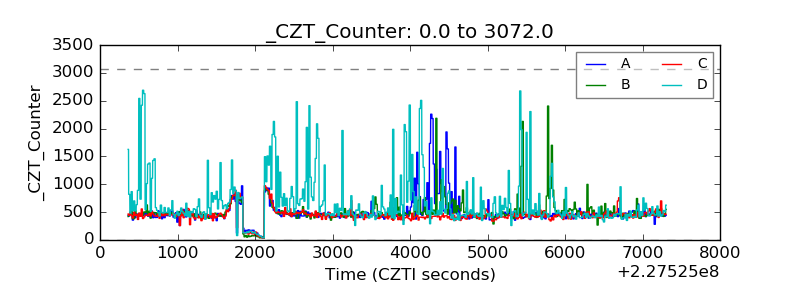 |
| +2.5 Volts monitor |  |
| +5 Volts monitor | 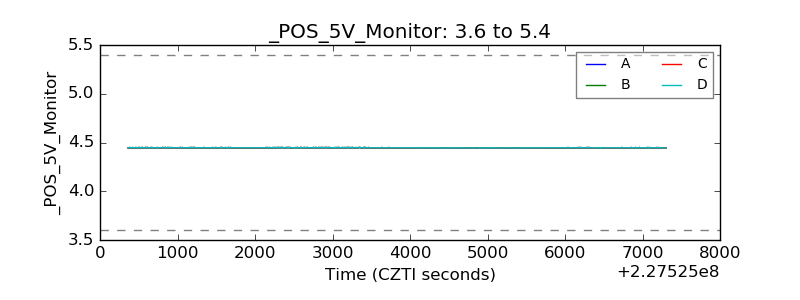 |
| _ROLL_ROT | 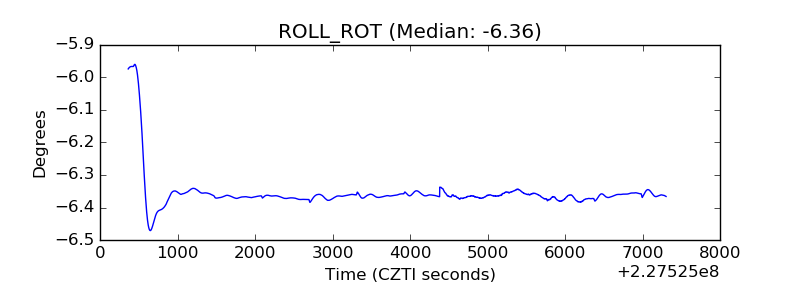 |
| _Roll_DEC | 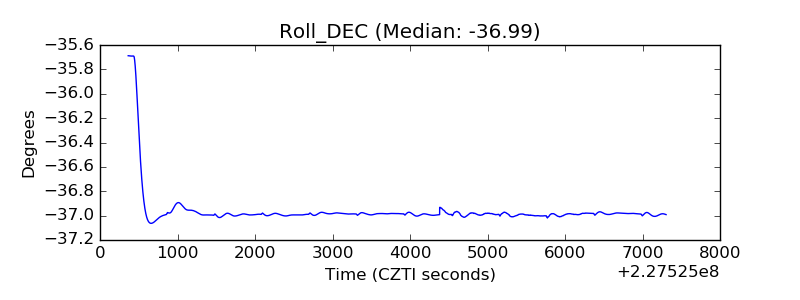 |
| _Roll_RA |  |
| Veto Counter | 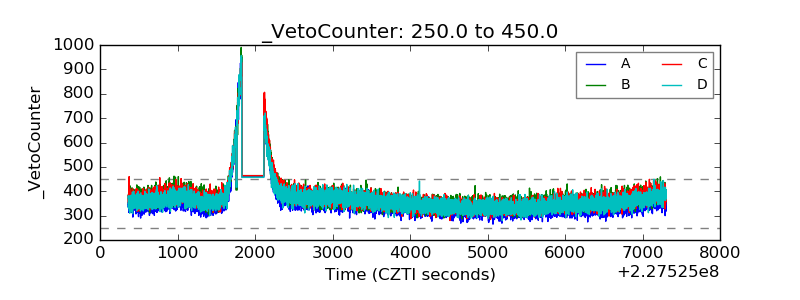 |