| Param | Original file | Final file |
|---|---|---|
| Filename | modeM0/AS1G06_077T01_9000001090cztM0_level2.fits | modeM0/AS1G06_077T01_9000001090cztM0_level2_quad_clean.evt |
| Size (bytes) | 1,402,174,080 | 1,372,273,920 |
| Size | 1.3 GB | 1.3 GB |
| Events in quadrant A | 8,202,204 | 7,705,216 |
| Events in quadrant B | 8,340,696 | 8,385,853 |
| Events in quadrant C | 8,327,672 | 7,884,156 |
| Events in quadrant D | 7,134,942 | 7,138,247 |
| Mode SS | |||
|---|---|---|---|
| Quadrant | BADHDUFLAG | Total packets | Discarded packets |
| A | 0 | 3104 | 0 |
| B | 0 | 3098 | 0 |
| C | 0 | 3108 | 0 |
| D | 0 | 3104 | 0 |
| Mode M0 | |||
|---|---|---|---|
| Quadrant | BADHDUFLAG | Total packets | Discarded packets |
| A | 0 | 381224 | 0 |
| B | 0 | 320845 | 0 |
| C | 0 | 373015 | 0 |
| D | 0 | 402210 | 0 |
| Mode M9 | |||
|---|---|---|---|
| Quadrant | BADHDUFLAG | Total packets | Discarded packets |
| A | 0 | 231 | 0 |
| B | 0 | 231 | 0 |
| C | 0 | 231 | 0 |
| D | 0 | 231 | 0 |
| Quadrant | Total seconds | Saturated seconds | Saturation percentage |
|---|---|---|---|
| A | 152498 | 10492 | 6.880090% |
| B | 152473 | 2772 | 1.818027% |
| C | 152499 | 7065 | 4.632817% |
| D | 152465 | 10983 | 7.203621% |
Noise dominated data is calculated using 1-second bins in cleaned event files. If a bin has >2000 counts, and if more than 50% of those come from <1% of pixels, then it is considered to be noise-dominated and hence unusable.
| Quadrant | # 1 sec bins | Bins with >0 counts | Bins with >2000 counts | High rate bins dominated by noise | Noise dominated (total time) | Noise dominated (detector-on time) | Marked lightcurve |
|---|---|---|---|---|---|---|---|
| A | 175897 | 151826 | 0 | 0 | 0.00% | 0.00% |  |
| B | 175898 | 152759 | 0 | 0 | 0.00% | 0.00% | 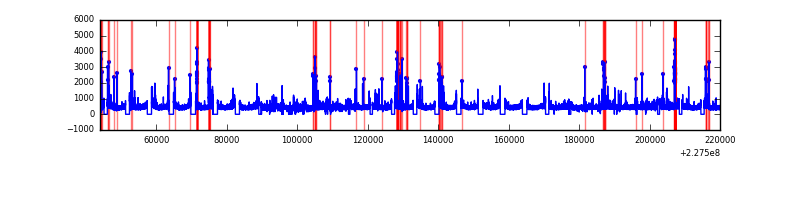 |
| C | 175898 | 152557 | 0 | 0 | 0.00% | 0.00% |  |
| D | 175898 | 152529 | 0 | 0 | 0.00% | 0.00% |  |
Top three noisy pixels from each quadrant. If the there are fewer than three noisy pixels in the level2.evt file, extra rows are filled as -1
| Pixel properties | Quadrant properties | ||||||
|---|---|---|---|---|---|---|---|
| Quadrant | DetID | PixID | Counts | Sigma | Mean | Median | Sigma |
| A | 0 | 29 | 7917 | 10.98 | 2132 | 1981 | 540.6 |
| A | 7 | 110 | 6761 | 8.84 | 2132 | 1981 | 540.6 |
| A | 0 | 30 | 6365 | 8.11 | 2132 | 1981 | 540.6 |
| B | 2 | 9 | 7223 | 11.73 | 2197 | 2081 | 438.4 |
| B | 3 | 17 | 5686 | 8.22 | 2197 | 2081 | 438.4 |
| B | 12 | 226 | 5631 | 8.1 | 2197 | 2081 | 438.4 |
| C | 1 | 80 | 6125 | 7.07 | 2200 | 2031 | 578.8 |
| C | 1 | 81 | 6057 | 6.96 | 2200 | 2031 | 578.8 |
| C | 12 | 241 | 6034 | 6.92 | 2200 | 2031 | 578.8 |
| D | 3 | 14 | 5463 | 6.61 | 2033 | 1839 | 548.6 |
| D | 6 | 231 | 5245 | 6.21 | 2033 | 1839 | 548.6 |
| D | 7 | 5 | 5095 | 5.93 | 2033 | 1839 | 548.6 |
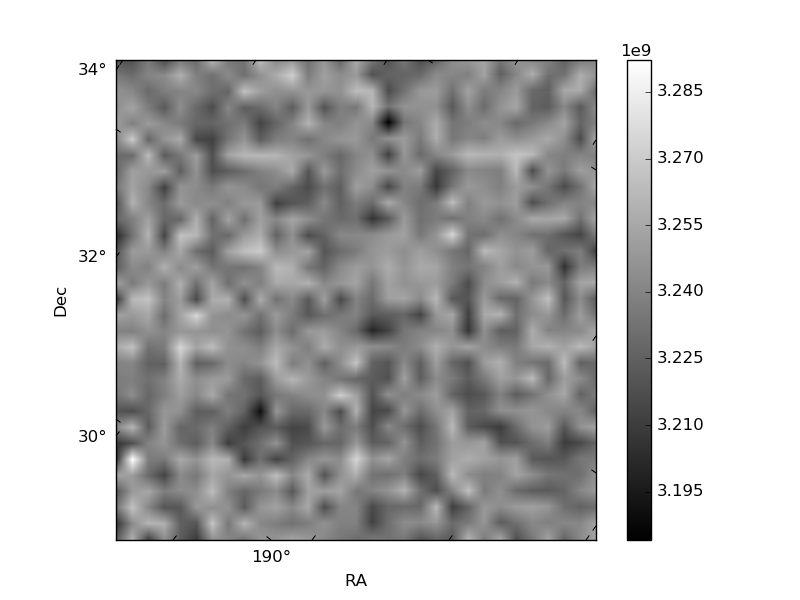
Histogram calculated using DETX and DETY for each event in the final _common_clean file
| Quadrant A | 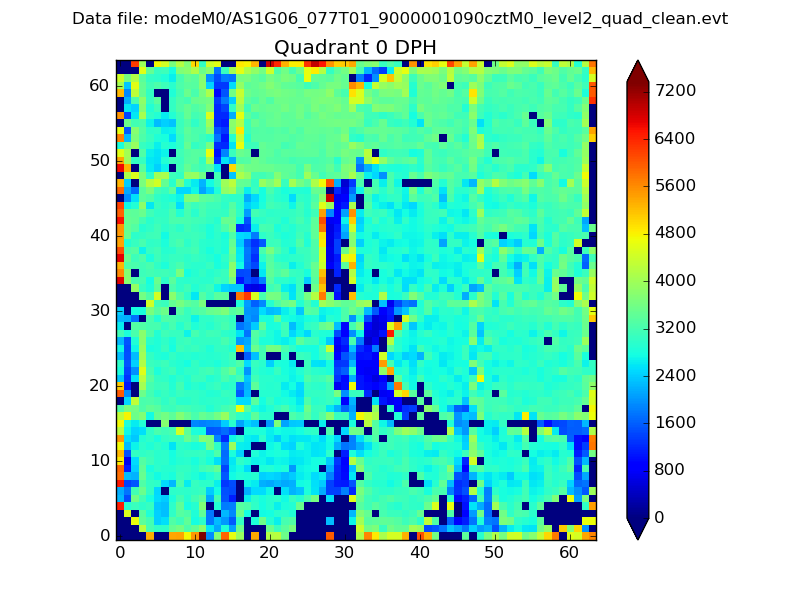 |
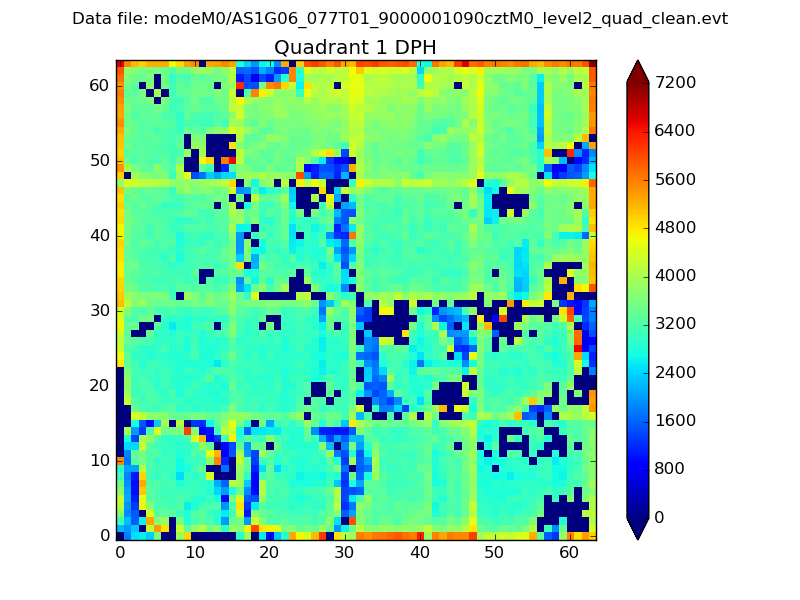 |
Quadrant B |
|---|---|---|---|
| Quadrant D |  |
 |
Quadrant C |
| Plot type | Count rate plots | Images |
|---|---|---|
| Comparison with Poisson distribution Blue bars denote a histogram of data divided into 1 sec bins. Red curve is a Poisson curve with rate = median count rate of data. |
 |
 |
| Quadrant-wise count rates Data is divided into 100 sec bins |
 |
|
| Module-wise count rates for Quadrant A Data is divided into 100 sec bins |
 |
 |
| Module-wise count rates for Quadrant B Data is divided into 100 sec bins |
 |
 |
| Module-wise count rates for Quadrant C Data is divided into 100 sec bins |
 |
 |
| Module-wise count rates for Quadrant D Data is divided into 100 sec bins |
 |
 |
| Parameter | Plot |
|---|---|
| CZT HV Monitor |  |
| D_VDD | 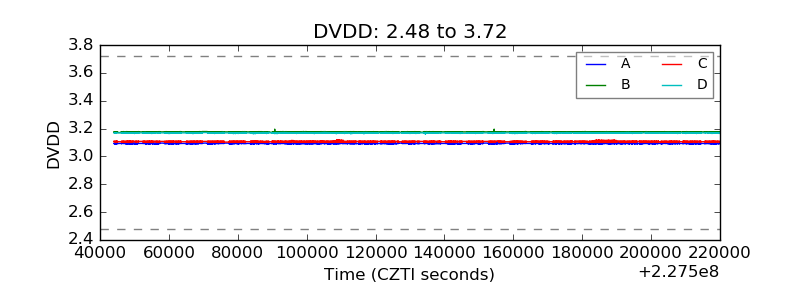 |
| Temperature 1 |  |
| Veto HV Monitor |  |
| Veto LLD |  |
| Alpha Counter |  |
| _CPM_Rate |  |
| CZT Counter |  |
| +2.5 Volts monitor | 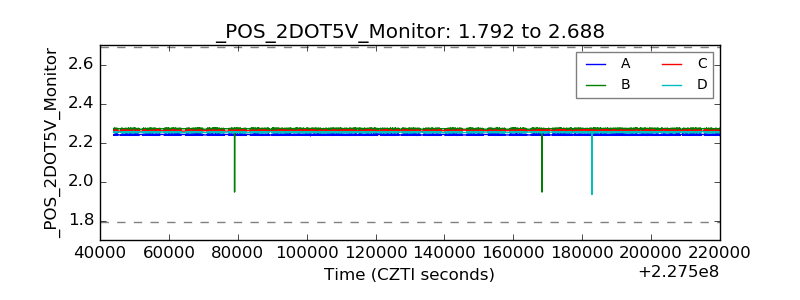 |
| +5 Volts monitor |  |
| _ROLL_ROT | 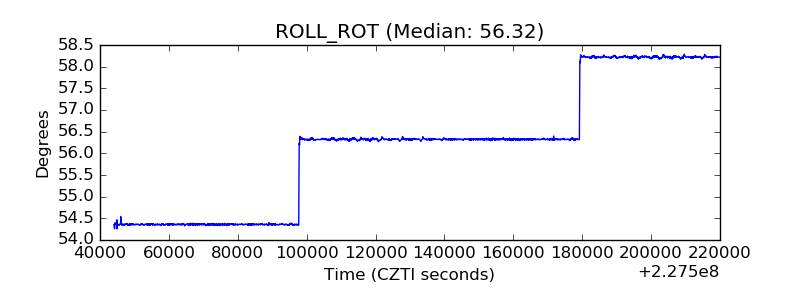 |
| _Roll_DEC |  |
| _Roll_RA | 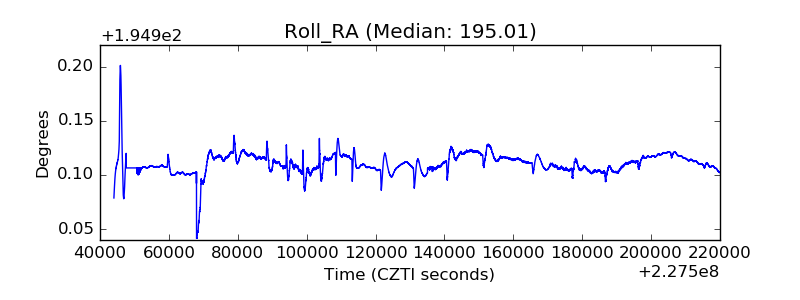 |
| Veto Counter |  |