| Param | Original file | Final file |
|---|---|---|
| Filename | modeM0/AS1G06_077T01_9000001090_07961cztM0_level2.evt | modeM0/AS1G06_077T01_9000001090_07961cztM0_level2_quad_clean.evt |
| Size (bytes) | 523,676,160 | 81,924,480 |
| Size | 499.4 MB | 78.1 MB |
| Events in quadrant A | 3,110,514 | 539,324 |
| Events in quadrant B | 3,187,838 | 564,983 |
| Events in quadrant C | 5,732,373 | 413,868 |
| Events in quadrant D | 3,403,242 | 524,814 |
| Mode SS | |||
|---|---|---|---|
| Quadrant | BADHDUFLAG | Total packets | Discarded packets |
| A | 0 | 130 | 0 |
| B | 0 | 130 | 0 |
| C | 0 | 130 | 0 |
| D | 0 | 130 | 0 |
| Mode M0 | |||
|---|---|---|---|
| Quadrant | BADHDUFLAG | Total packets | Discarded packets |
| A | 0 | 13400 | 3 |
| B | 0 | 13603 | 2 |
| C | 0 | 21182 | 2 |
| D | 0 | 14412 | 2 |
| Mode M9 | |||
|---|---|---|---|
| Quadrant | BADHDUFLAG | Total packets | Discarded packets |
| A | 0 | 26 | 0 |
| B | 0 | 26 | 0 |
| C | 0 | 26 | 0 |
| D | 0 | 26 | 0 |
| Quadrant | Total seconds | Saturated seconds | Saturation percentage |
|---|---|---|---|
| A | 6263 | 67 | 1.069775% |
| B | 6263 | 114 | 1.820214% |
| C | 6263 | 1294 | 20.661025% |
| D | 6263 | 104 | 1.660546% |
Noise dominated data is calculated using 1-second bins in cleaned event files. If a bin has >2000 counts, and if more than 50% of those come from <1% of pixels, then it is considered to be noise-dominated and hence unusable.
| Quadrant | # 1 sec bins | Bins with >0 counts | Bins with >2000 counts | High rate bins dominated by noise | Noise dominated (total time) | Noise dominated (detector-on time) | Marked lightcurve |
|---|---|---|---|---|---|---|---|
| A | 8928 | 6266 | 5 | 5 | 0.06% | 0.08% | 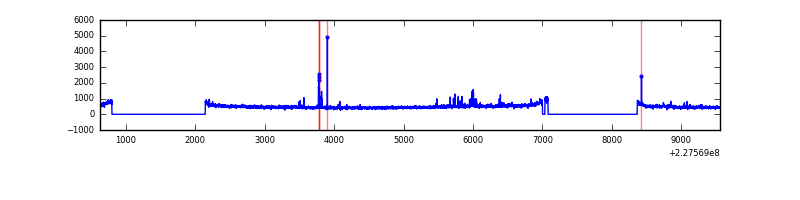 |
| B | 8928 | 6266 | 22 | 22 | 0.25% | 0.35% | 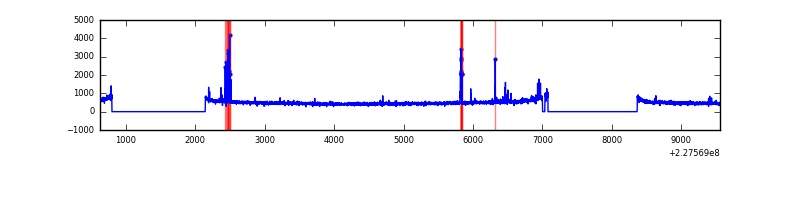 |
| C | 8928 | 6265 | 1182 | 1182 | 13.24% | 18.87% | 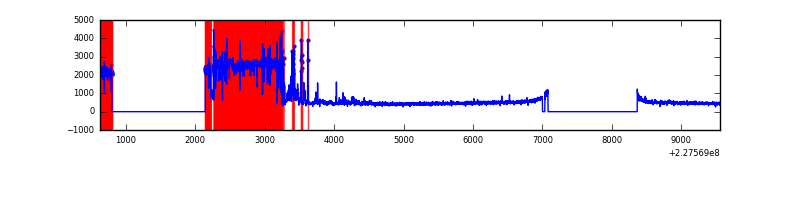 |
| D | 8928 | 6266 | 38 | 38 | 0.43% | 0.61% | 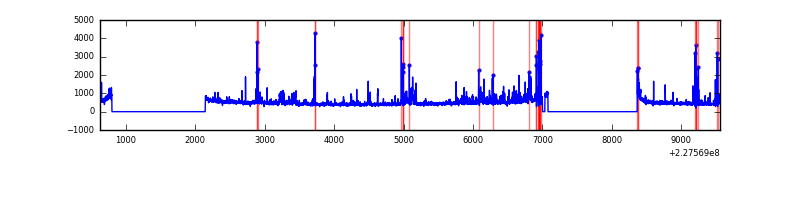 |
Top three noisy pixels from each quadrant. If the there are fewer than three noisy pixels in the level2.evt file, extra rows are filled as -1
| Pixel properties | Quadrant properties | ||||||
|---|---|---|---|---|---|---|---|
| Quadrant | DetID | PixID | Counts | Sigma | Mean | Median | Sigma |
| A | 0 | 254 | 54172 | 340.14 | 774 | 759 | 157.0 |
| A | 15 | 239 | 39402 | 246.08 | 774 | 759 | 157.0 |
| A | 13 | 248 | 19057 | 116.52 | 774 | 759 | 157.0 |
| B | 4 | 80 | 52499 | 347.19 | 788 | 770 | 149.0 |
| B | 10 | 16 | 40791 | 268.61 | 788 | 770 | 149.0 |
| B | 4 | 239 | 21204 | 137.15 | 788 | 770 | 149.0 |
| C | 9 | 68 | 3096541 | 21030.64 | 634 | 637 | 147.2 |
| C | 1 | 16 | 156609 | 1059.53 | 634 | 637 | 147.2 |
| C | 13 | 61 | 4702 | 27.61 | 634 | 637 | 147.2 |
| D | 5 | 233 | 212919 | 1150.76 | 753 | 731 | 184.4 |
| D | 1 | 52 | 189942 | 1026.15 | 753 | 731 | 184.4 |
| D | 12 | 233 | 61592 | 330.07 | 753 | 731 | 184.4 |
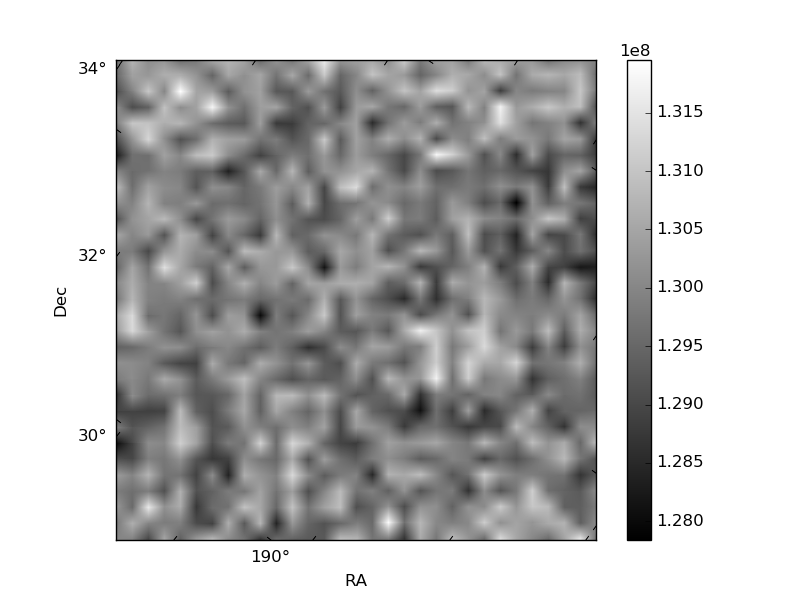
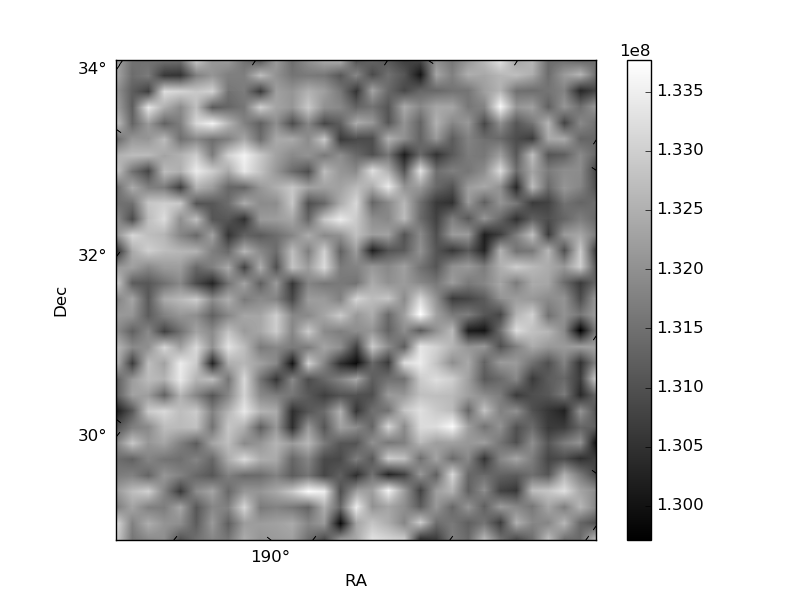
Histogram calculated using DETX and DETY for each event in the final _common_clean file
| Quadrant A |  |
 |
Quadrant B |
|---|---|---|---|
| Quadrant D |  |
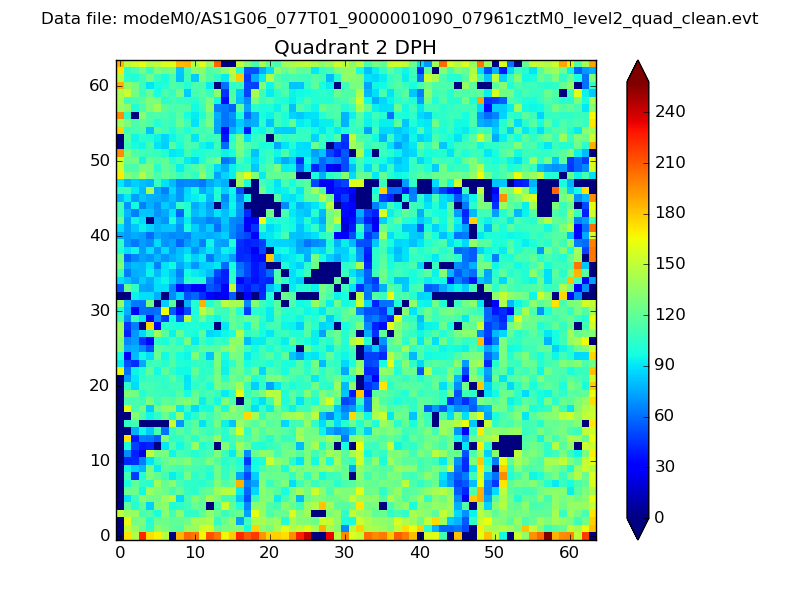 |
Quadrant C |
| Plot type | Count rate plots | Images |
|---|---|---|
| Comparison with Poisson distribution Blue bars denote a histogram of data divided into 1 sec bins. Red curve is a Poisson curve with rate = median count rate of data. |
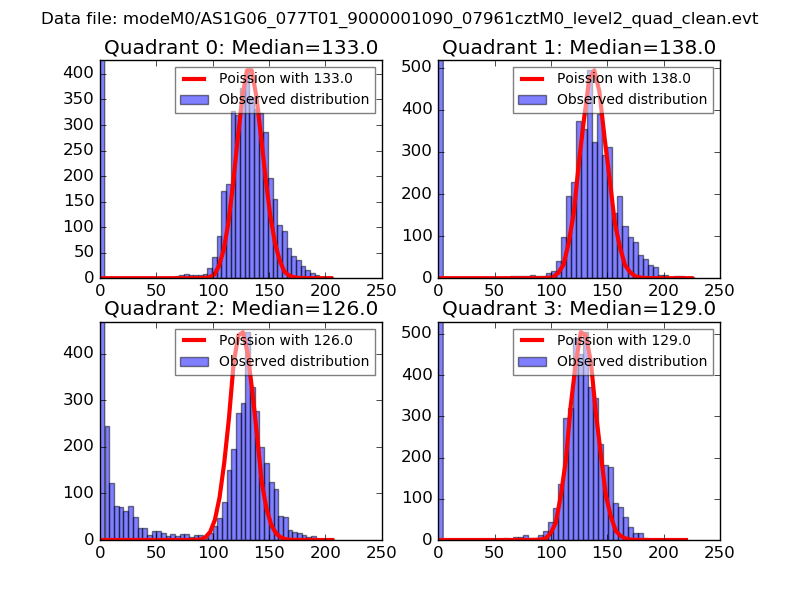 |
 |
| Quadrant-wise count rates Data is divided into 100 sec bins |
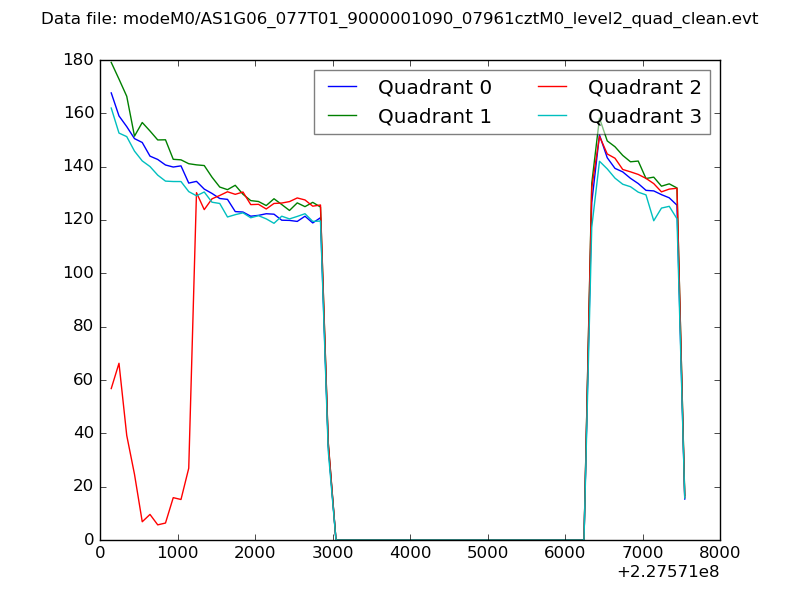 |
|
| Module-wise count rates for Quadrant A Data is divided into 100 sec bins |
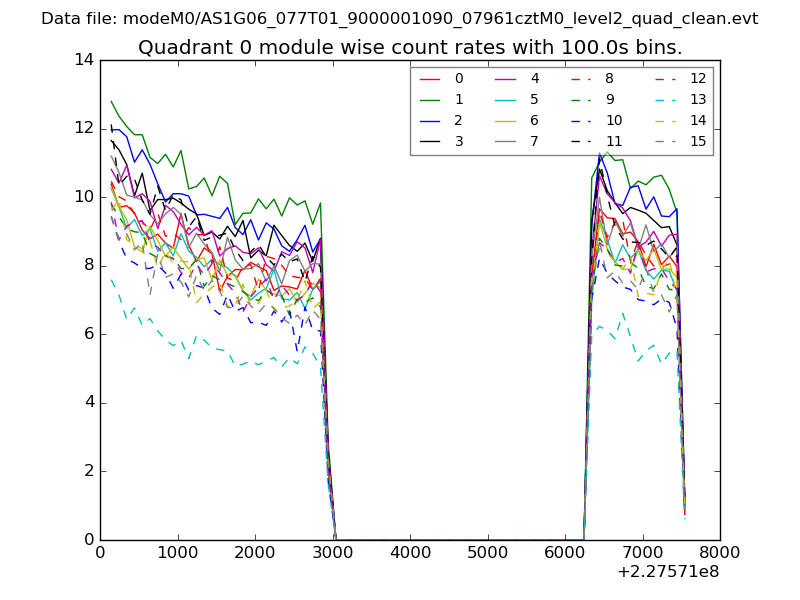 |
 |
| Module-wise count rates for Quadrant B Data is divided into 100 sec bins |
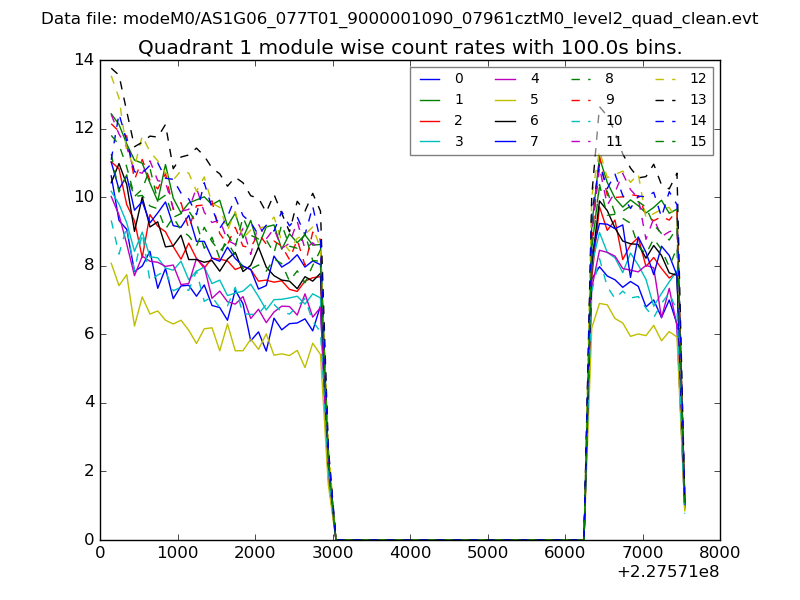 |
 |
| Module-wise count rates for Quadrant C Data is divided into 100 sec bins |
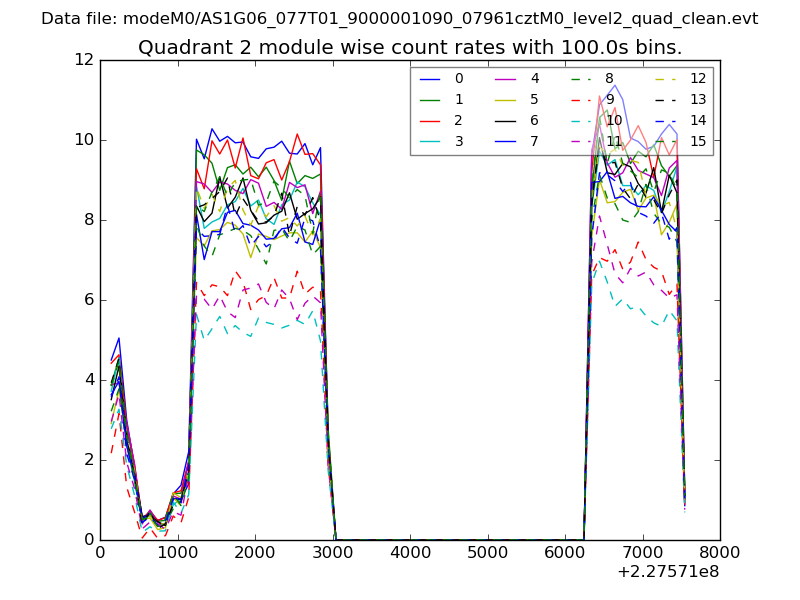 |
 |
| Module-wise count rates for Quadrant D Data is divided into 100 sec bins |
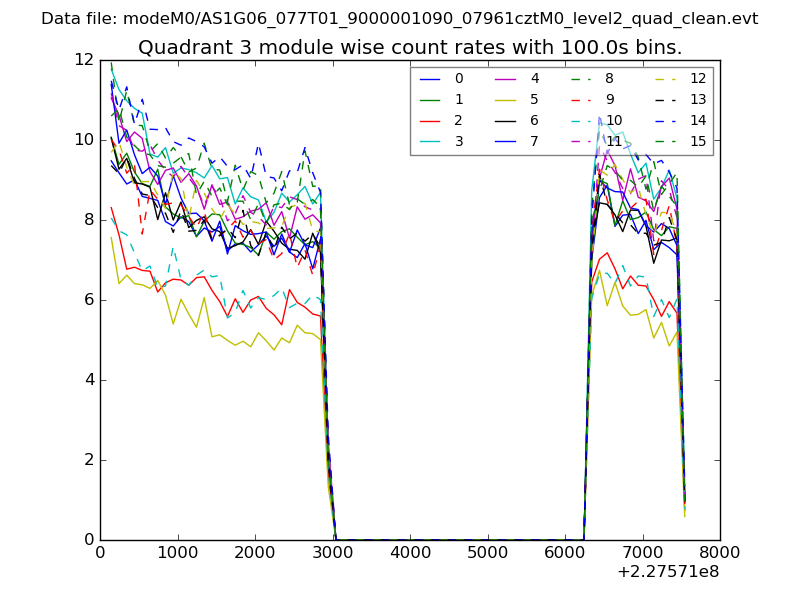 |
 |
| Parameter | Plot |
|---|---|
| CZT HV Monitor | 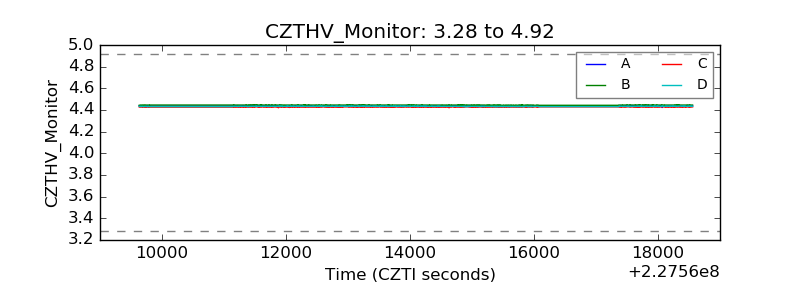 |
| D_VDD |  |
| Temperature 1 |  |
| Veto HV Monitor | 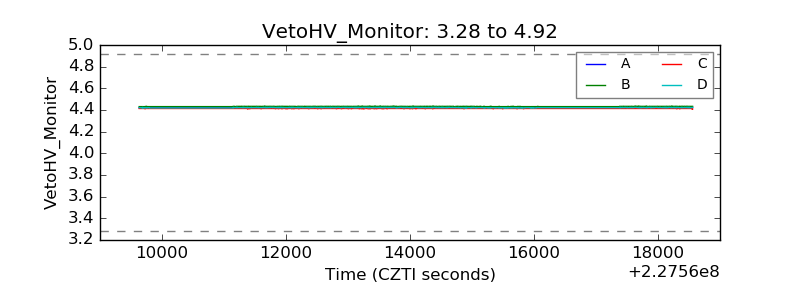 |
| Veto LLD |  |
| Alpha Counter | 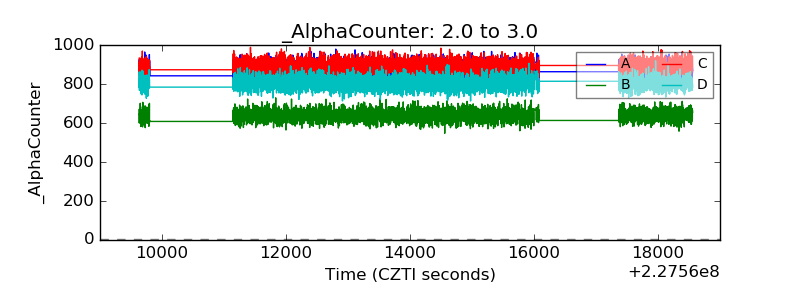 |
| _CPM_Rate | 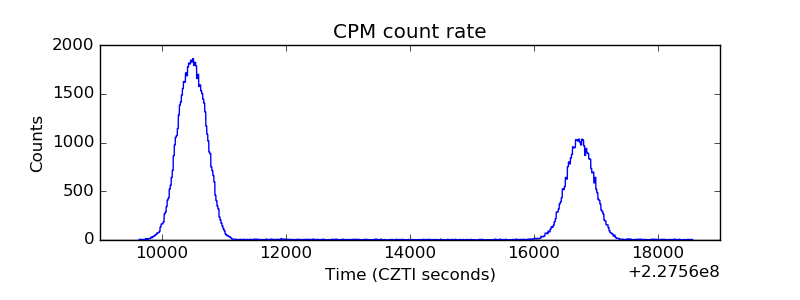 |
| CZT Counter |  |
| +2.5 Volts monitor |  |
| +5 Volts monitor |  |
| _ROLL_ROT | 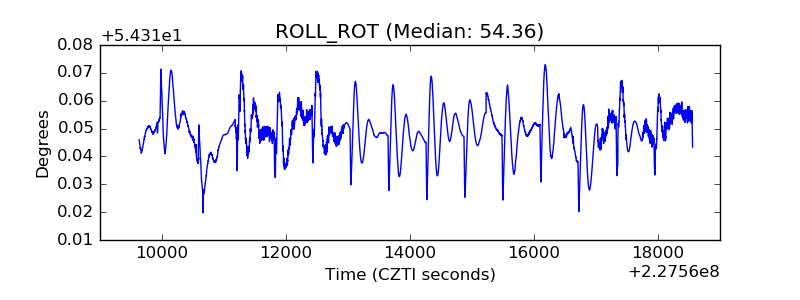 |
| _Roll_DEC | 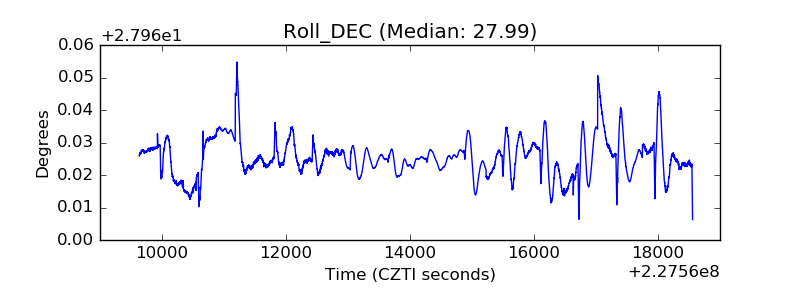 |
| _Roll_RA | 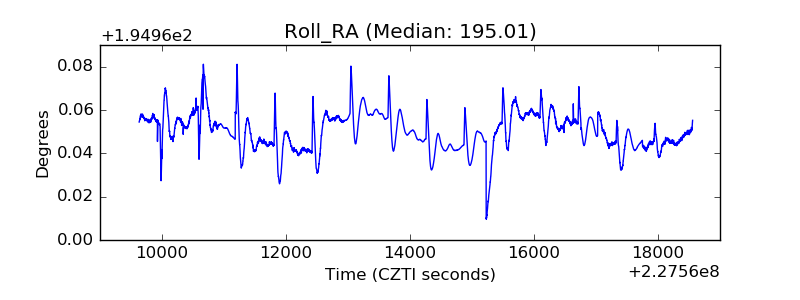 |
| Veto Counter | 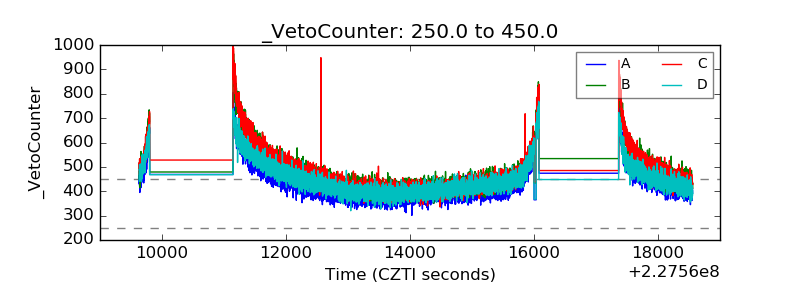 |