| Param | Original file | Final file |
|---|---|---|
| Filename | modeM0/AS1G06_077T01_9000001090_07962cztM0_level2.evt | modeM0/AS1G06_077T01_9000001090_07962cztM0_level2_quad_clean.evt |
| Size (bytes) | 1,452,280,320 | 210,792,960 |
| Size | 1.4 GB | 201.0 MB |
| Events in quadrant A | 8,191,322 | 1,365,724 |
| Events in quadrant B | 8,040,885 | 1,425,516 |
| Events in quadrant C | 17,640,959 | 1,147,011 |
| Events in quadrant D | 9,005,029 | 1,317,073 |
| Mode SS | |||
|---|---|---|---|
| Quadrant | BADHDUFLAG | Total packets | Discarded packets |
| A | 0 | 334 | 0 |
| B | 0 | 334 | 0 |
| C | 0 | 334 | 0 |
| D | 0 | 334 | 0 |
| Mode M0 | |||
|---|---|---|---|
| Quadrant | BADHDUFLAG | Total packets | Discarded packets |
| A | 0 | 35322 | 4 |
| B | 0 | 34867 | 5 |
| C | 0 | 63678 | 3 |
| D | 0 | 38201 | 3 |
| Mode M9 | |||
|---|---|---|---|
| Quadrant | BADHDUFLAG | Total packets | Discarded packets |
| A | 0 | 38 | 0 |
| B | 0 | 38 | 0 |
| C | 0 | 38 | 0 |
| D | 0 | 38 | 0 |
| Quadrant | Total seconds | Saturated seconds | Saturation percentage |
|---|---|---|---|
| A | 16350 | 209 | 1.278287% |
| B | 16349 | 147 | 0.899138% |
| C | 16350 | 4334 | 26.507645% |
| D | 16350 | 320 | 1.957187% |
Noise dominated data is calculated using 1-second bins in cleaned event files. If a bin has >2000 counts, and if more than 50% of those come from <1% of pixels, then it is considered to be noise-dominated and hence unusable.
| Quadrant | # 1 sec bins | Bins with >0 counts | Bins with >2000 counts | High rate bins dominated by noise | Noise dominated (total time) | Noise dominated (detector-on time) | Marked lightcurve |
|---|---|---|---|---|---|---|---|
| A | 20205 | 16354 | 91 | 91 | 0.45% | 0.56% |  |
| B | 20205 | 16354 | 24 | 24 | 0.12% | 0.15% | 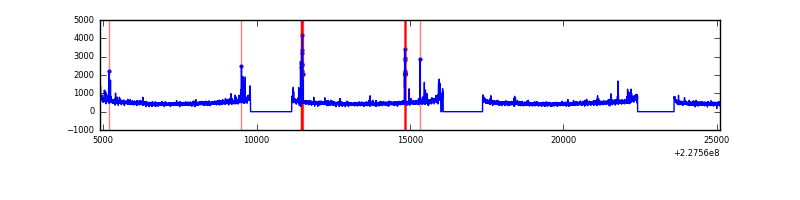 |
| C | 20205 | 16353 | 4044 | 4044 | 20.01% | 24.73% | 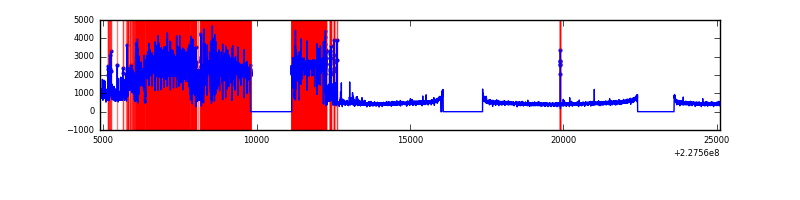 |
| D | 20205 | 16354 | 162 | 162 | 0.80% | 0.99% | 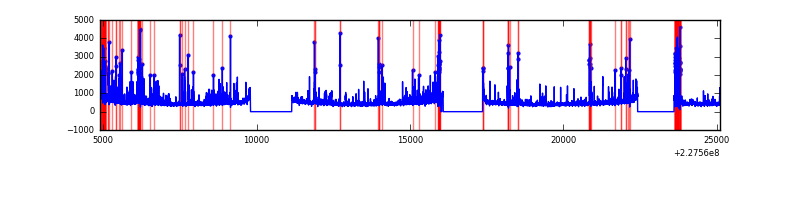 |
Top three noisy pixels from each quadrant. If the there are fewer than three noisy pixels in the level2.evt file, extra rows are filled as -1
| Pixel properties | Quadrant properties | ||||||
|---|---|---|---|---|---|---|---|
| Quadrant | DetID | PixID | Counts | Sigma | Mean | Median | Sigma |
| A | 0 | 254 | 454936 | 1145.68 | 1972 | 1932 | 395.4 |
| A | 15 | 234 | 45078 | 109.12 | 1972 | 1932 | 395.4 |
| A | 15 | 239 | 41788 | 100.8 | 1972 | 1932 | 395.4 |
| B | 10 | 16 | 91810 | 239.91 | 2011 | 1963 | 374.5 |
| B | 4 | 80 | 56802 | 146.43 | 2011 | 1963 | 374.5 |
| B | 5 | 255 | 42120 | 107.23 | 2011 | 1963 | 374.5 |
| C | 9 | 68 | 10859826 | 28964.36 | 1637 | 1651 | 374.9 |
| C | 1 | 16 | 368978 | 979.85 | 1637 | 1651 | 374.9 |
| C | 1 | 3 | 20079 | 49.16 | 1637 | 1651 | 374.9 |
| D | 1 | 52 | 941469 | 2035.31 | 1912 | 1860 | 461.7 |
| D | 13 | 104 | 342048 | 736.89 | 1912 | 1860 | 461.7 |
| D | 5 | 233 | 289515 | 623.1 | 1912 | 1860 | 461.7 |
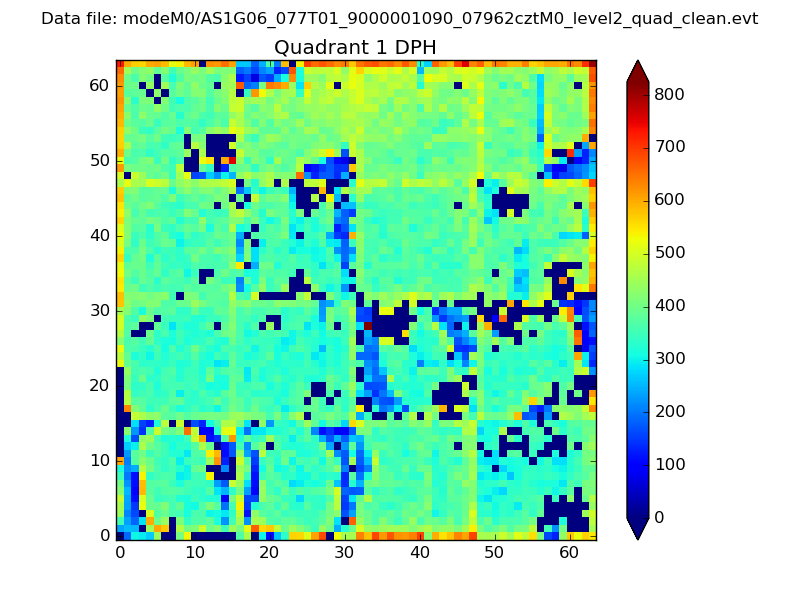
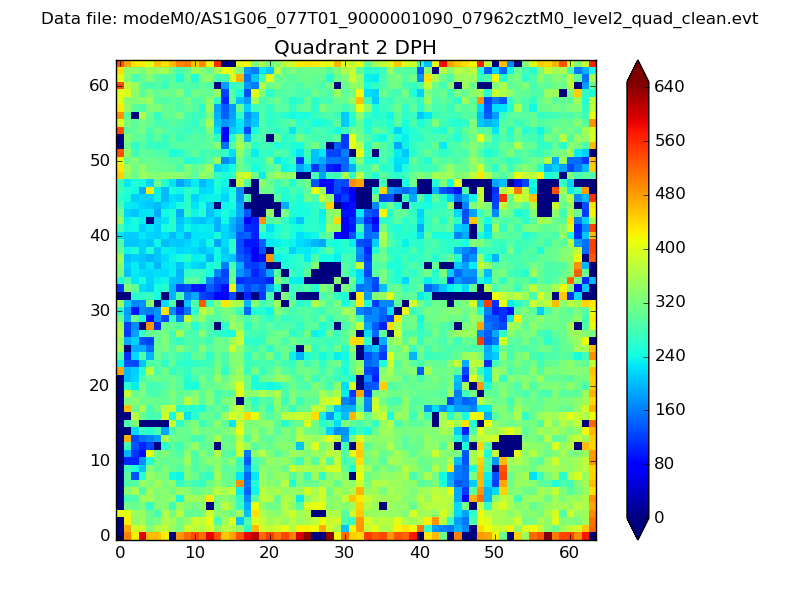
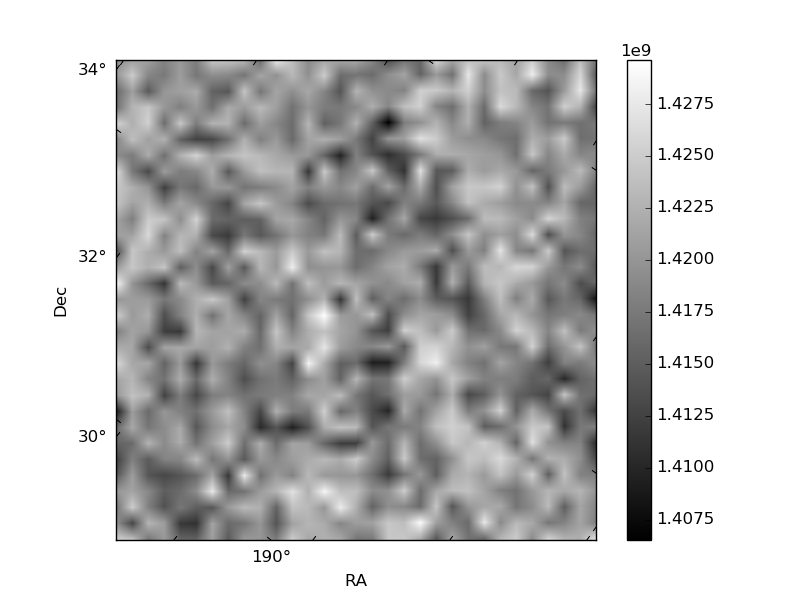
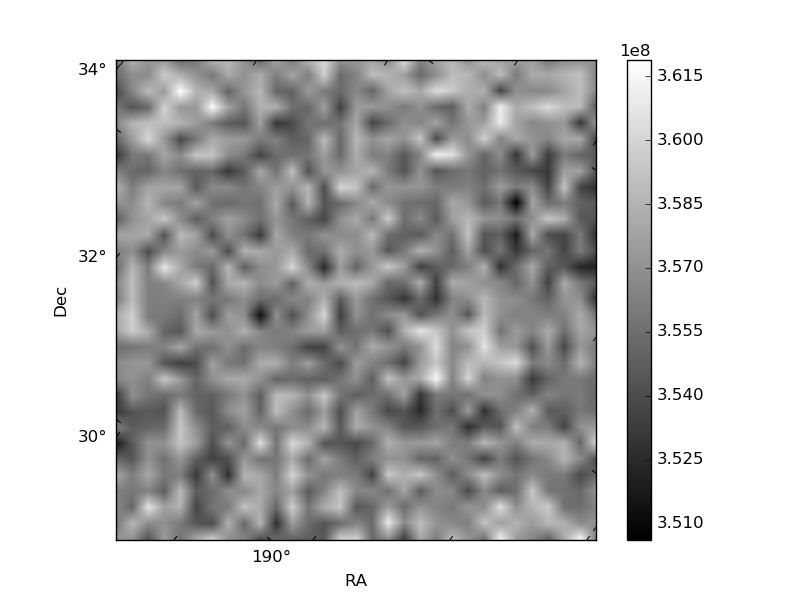
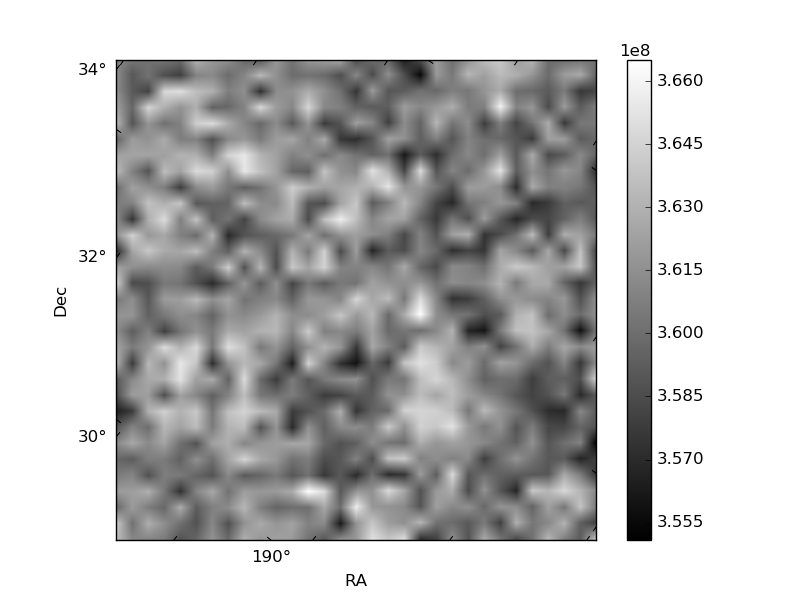
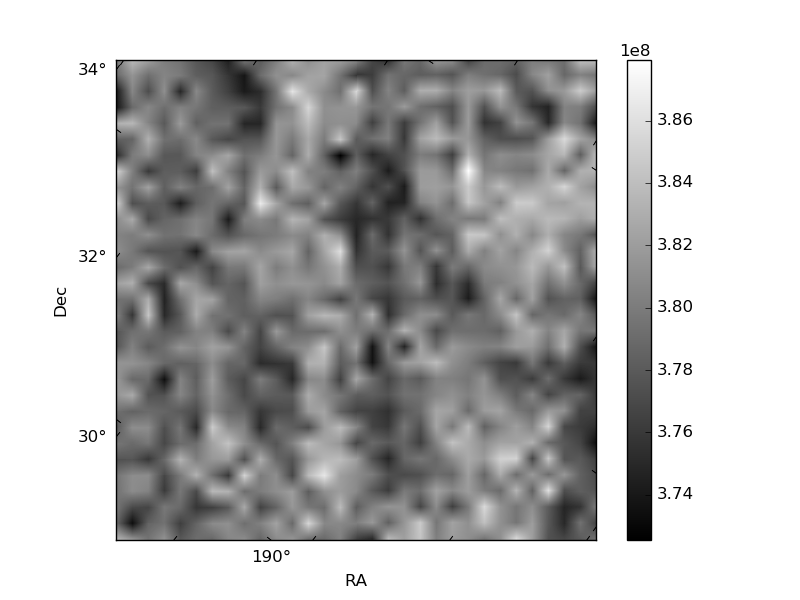
Histogram calculated using DETX and DETY for each event in the final _common_clean file
| Quadrant A | 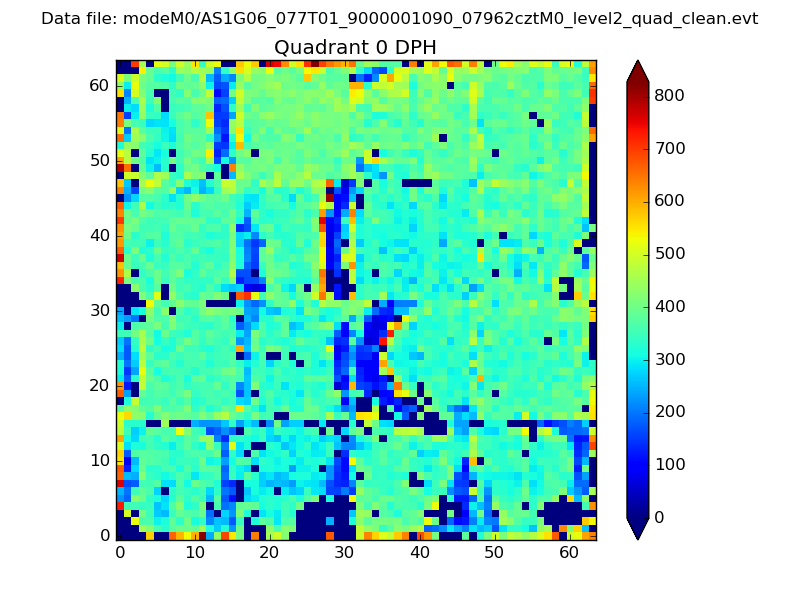 |
 |
Quadrant B |
|---|---|---|---|
| Quadrant D | 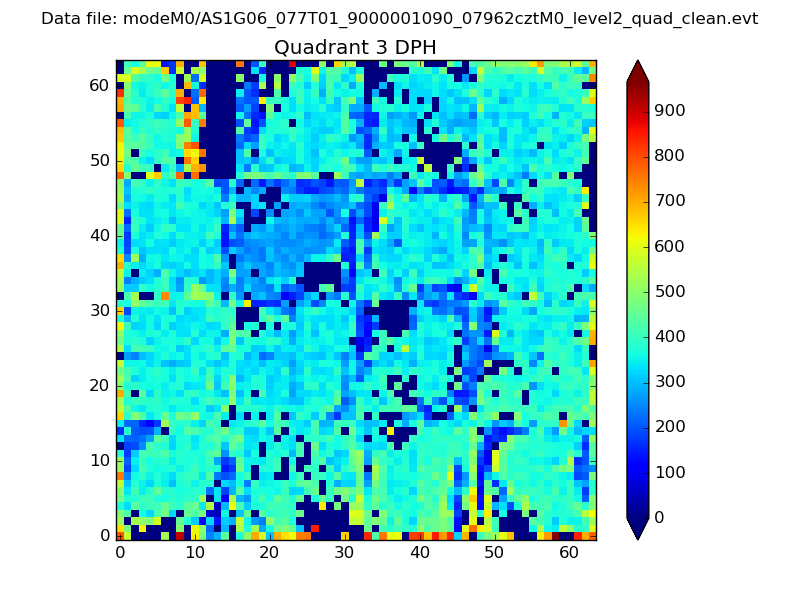 |
 |
Quadrant C |
| Plot type | Count rate plots | Images |
|---|---|---|
| Comparison with Poisson distribution Blue bars denote a histogram of data divided into 1 sec bins. Red curve is a Poisson curve with rate = median count rate of data. |
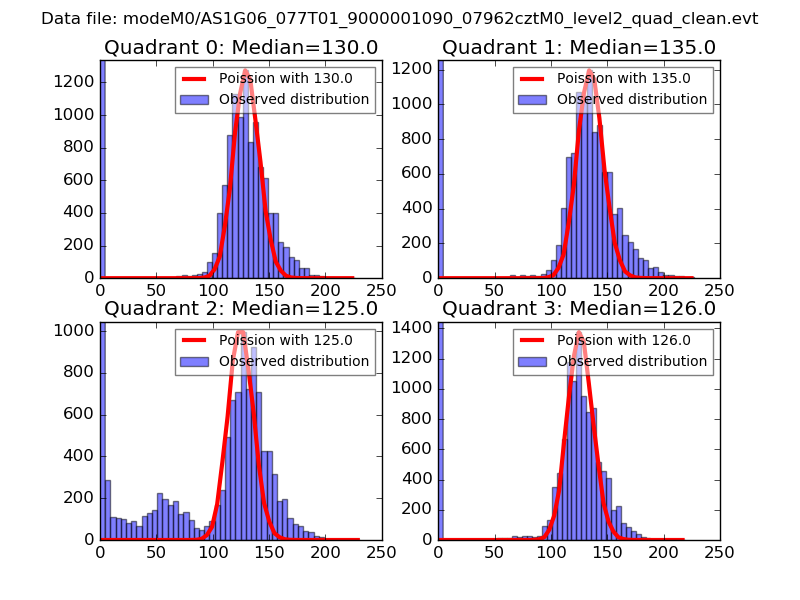 |
 |
| Quadrant-wise count rates Data is divided into 100 sec bins |
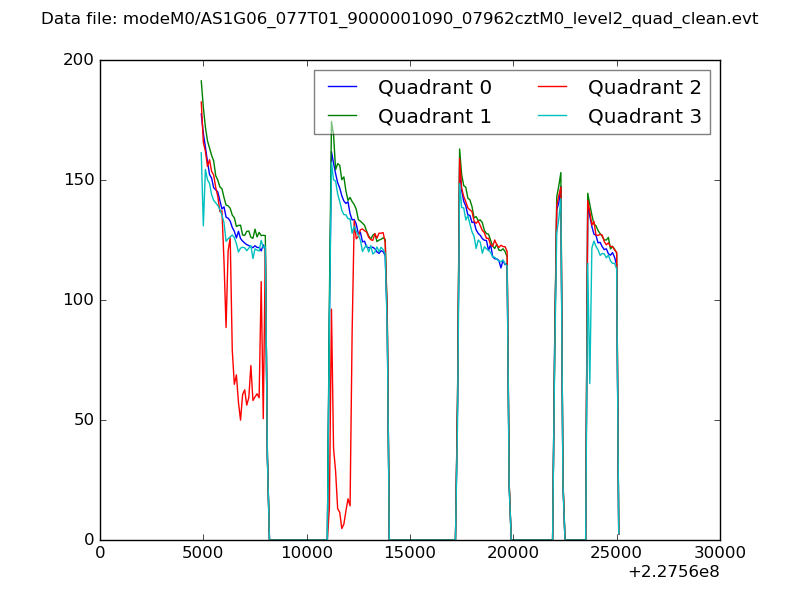 |
|
| Module-wise count rates for Quadrant A Data is divided into 100 sec bins |
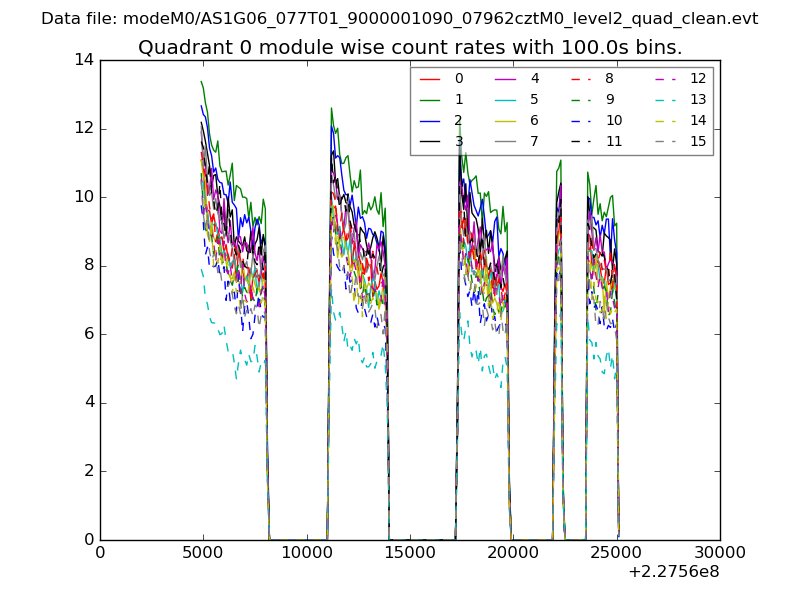 |
 |
| Module-wise count rates for Quadrant B Data is divided into 100 sec bins |
 |
 |
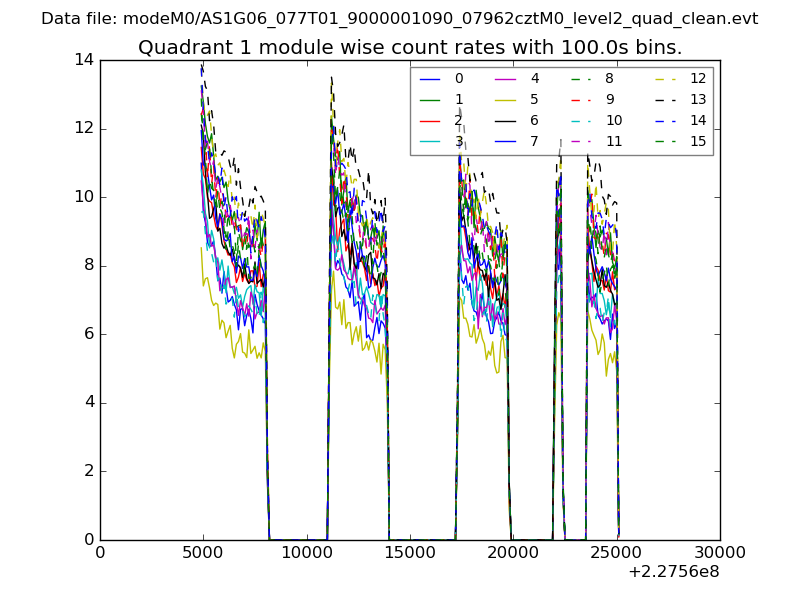
| Module-wise count rates for Quadrant C Data is divided into 100 sec bins |
 |
 |
| Module-wise count rates for Quadrant D Data is divided into 100 sec bins |
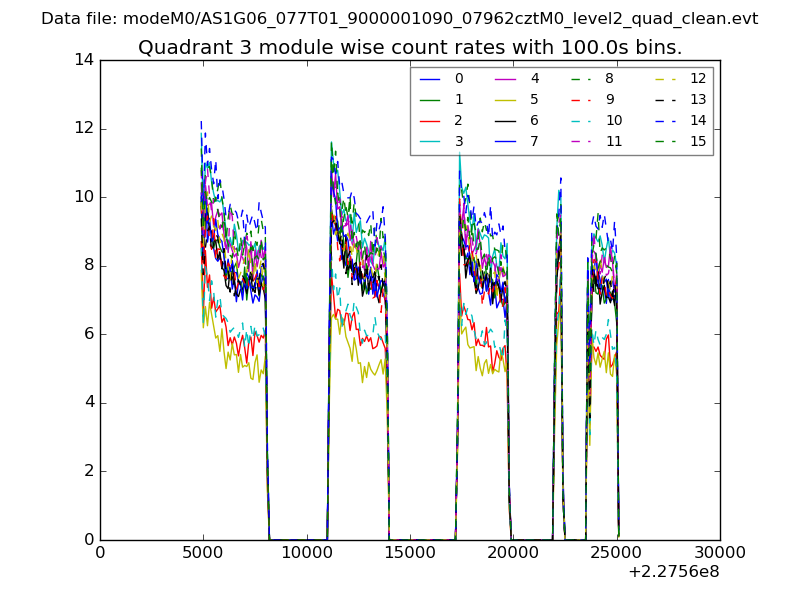 |
 |
| Parameter | Plot |
|---|---|
| CZT HV Monitor |  |
| D_VDD | 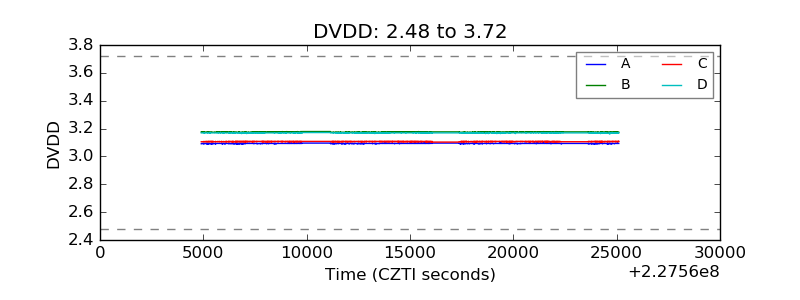 |
| Temperature 1 | 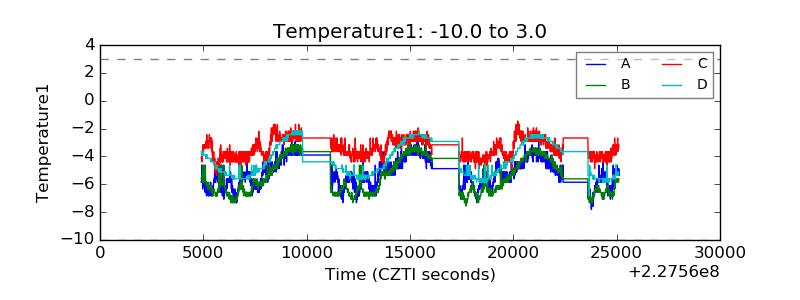 |
| Veto HV Monitor | 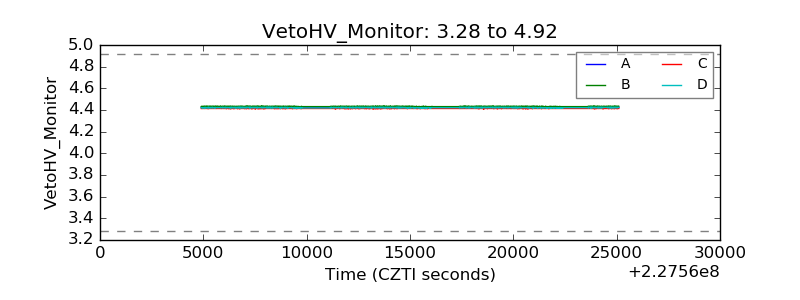 |
| Veto LLD | 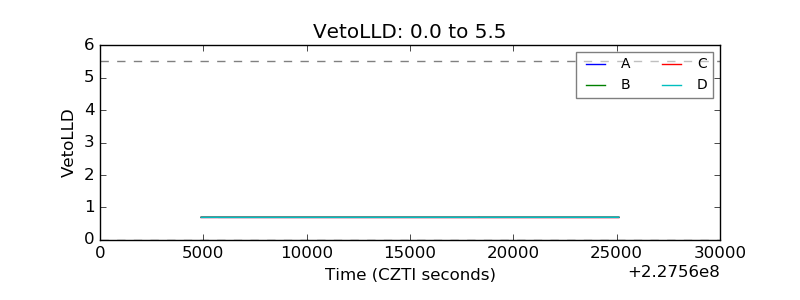 |
| Alpha Counter | 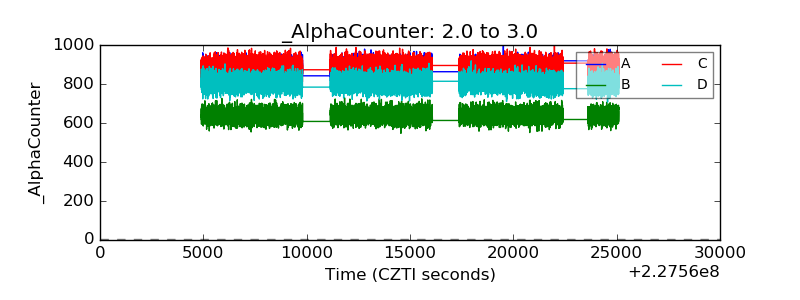 |
| _CPM_Rate | 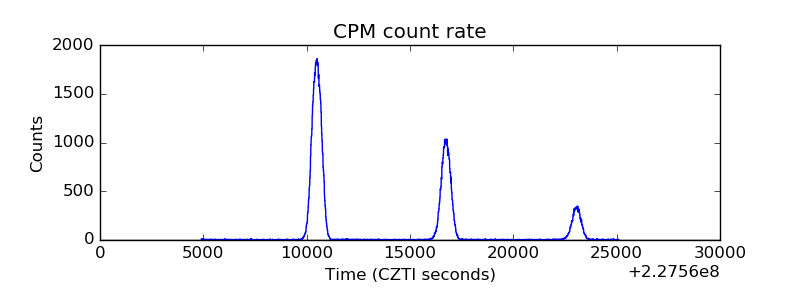 |
| CZT Counter | 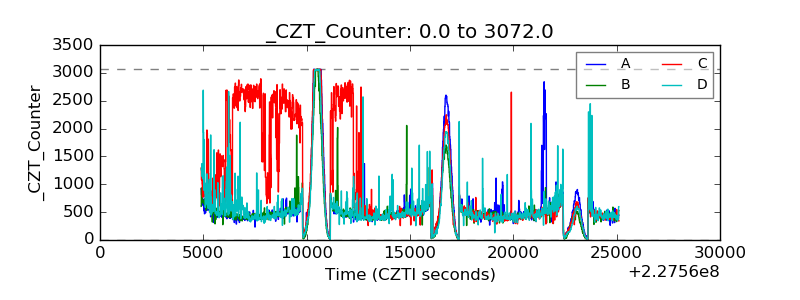 |
| +2.5 Volts monitor |  |
| +5 Volts monitor |  |
| _ROLL_ROT | 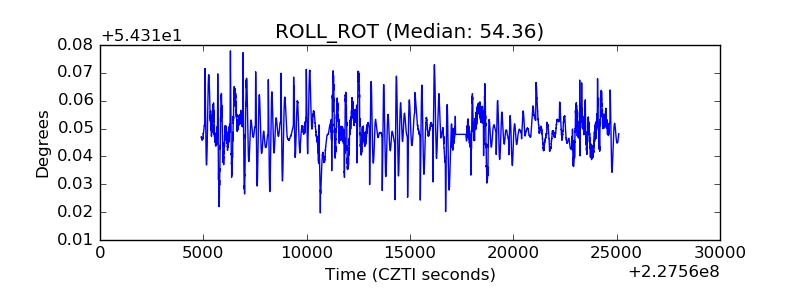 |
| _Roll_DEC | 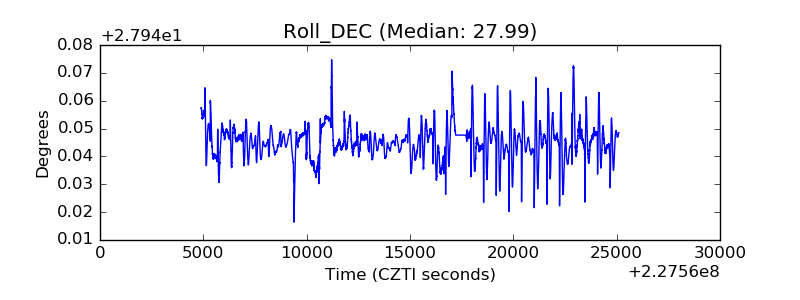 |
| _Roll_RA | 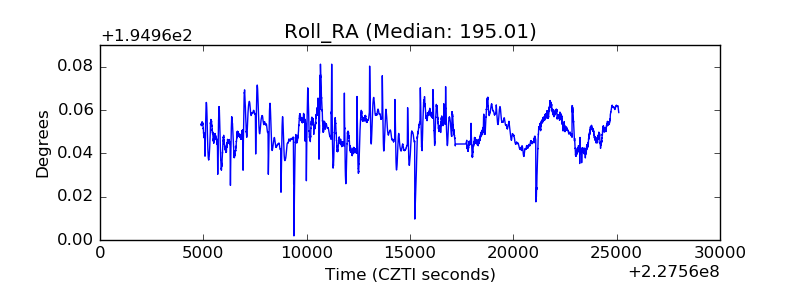 |
| Veto Counter |  |