| Param | Original file | Final file |
|---|---|---|
| Filename | modeM0/AS1G06_077T01_9000001090_07963cztM0_level2.evt | modeM0/AS1G06_077T01_9000001090_07963cztM0_level2_quad_clean.evt |
| Size (bytes) | 2,499,076,800 | 422,455,680 |
| Size | 2.3 GB | 402.9 MB |
| Events in quadrant A | 15,237,220 | 2,691,387 |
| Events in quadrant B | 15,375,812 | 2,797,035 |
| Events in quadrant C | 25,385,893 | 2,514,959 |
| Events in quadrant D | 17,554,865 | 2,621,173 |
| Mode SS | |||
|---|---|---|---|
| Quadrant | BADHDUFLAG | Total packets | Discarded packets |
| A | 0 | 644 | 0 |
| B | 0 | 644 | 2 |
| C | 0 | 644 | 0 |
| D | 0 | 644 | 0 |
| Mode M0 | |||
|---|---|---|---|
| Quadrant | BADHDUFLAG | Total packets | Discarded packets |
| A | 0 | 66748 | 7 |
| B | 0 | 66934 | 6 |
| C | 0 | 97019 | 6 |
| D | 0 | 74294 | 8 |
| Mode M9 | |||
|---|---|---|---|
| Quadrant | BADHDUFLAG | Total packets | Discarded packets |
| A | 0 | 70 | 0 |
| B | 0 | 70 | 0 |
| C | 0 | 70 | 0 |
| D | 0 | 70 | 0 |
| Quadrant | Total seconds | Saturated seconds | Saturation percentage |
|---|---|---|---|
| A | 31579 | 378 | 1.196998% |
| B | 31579 | 332 | 1.051332% |
| C | 31579 | 4615 | 14.614142% |
| D | 31578 | 724 | 2.292735% |
Noise dominated data is calculated using 1-second bins in cleaned event files. If a bin has >2000 counts, and if more than 50% of those come from <1% of pixels, then it is considered to be noise-dominated and hence unusable.
| Quadrant | # 1 sec bins | Bins with >0 counts | Bins with >2000 counts | High rate bins dominated by noise | Noise dominated (total time) | Noise dominated (detector-on time) | Marked lightcurve |
|---|---|---|---|---|---|---|---|
| A | 38679 | 31587 | 94 | 94 | 0.24% | 0.30% | 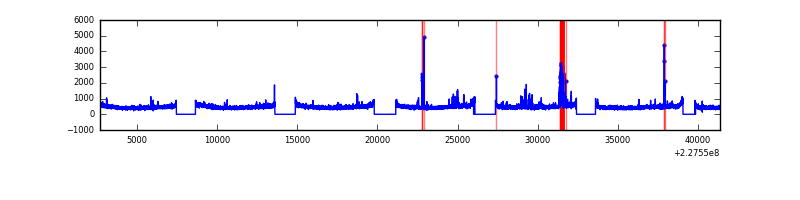 |
| B | 38679 | 31587 | 27 | 27 | 0.07% | 0.09% | 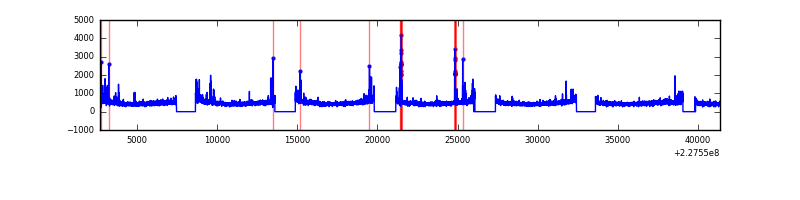 |
| C | 38679 | 31586 | 4169 | 4169 | 10.78% | 13.20% | 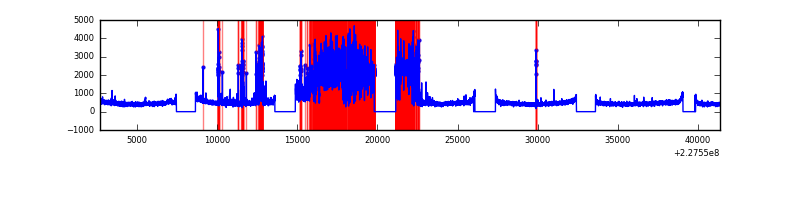 |
| D | 38679 | 31587 | 361 | 361 | 0.93% | 1.14% | 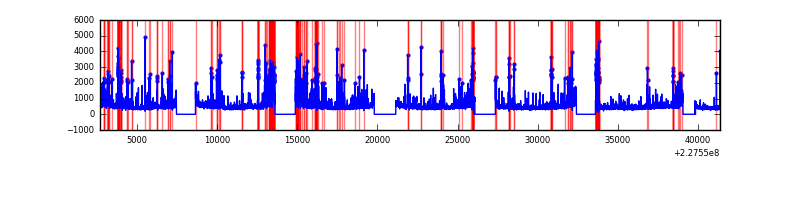 |
Top three noisy pixels from each quadrant. If the there are fewer than three noisy pixels in the level2.evt file, extra rows are filled as -1
| Pixel properties | Quadrant properties | ||||||
|---|---|---|---|---|---|---|---|
| Quadrant | DetID | PixID | Counts | Sigma | Mean | Median | Sigma |
| A | 0 | 254 | 477356 | 622.77 | 3781 | 3702 | 760.6 |
| A | 15 | 239 | 55948 | 68.69 | 3781 | 3702 | 760.6 |
| A | 13 | 248 | 47984 | 58.22 | 3781 | 3702 | 760.6 |
| B | 5 | 255 | 129590 | 174.99 | 3844 | 3753 | 719.1 |
| B | 10 | 16 | 112261 | 150.89 | 3844 | 3753 | 719.1 |
| B | 4 | 239 | 101335 | 135.7 | 3844 | 3753 | 719.1 |
| C | 9 | 68 | 11400847 | 14564.93 | 3419 | 3443 | 782.5 |
| C | 1 | 16 | 552201 | 701.27 | 3419 | 3443 | 782.5 |
| C | 8 | 208 | 72181 | 87.84 | 3419 | 3443 | 782.5 |
| D | 1 | 52 | 2107705 | 2313.6 | 3667 | 3575 | 909.5 |
| D | 5 | 233 | 529042 | 577.78 | 3667 | 3575 | 909.5 |
| D | 13 | 104 | 463470 | 505.68 | 3667 | 3575 | 909.5 |
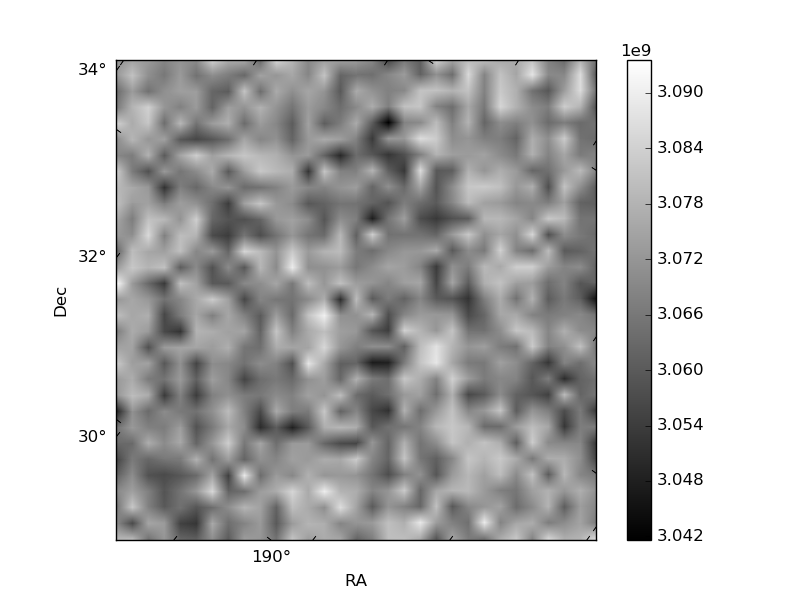
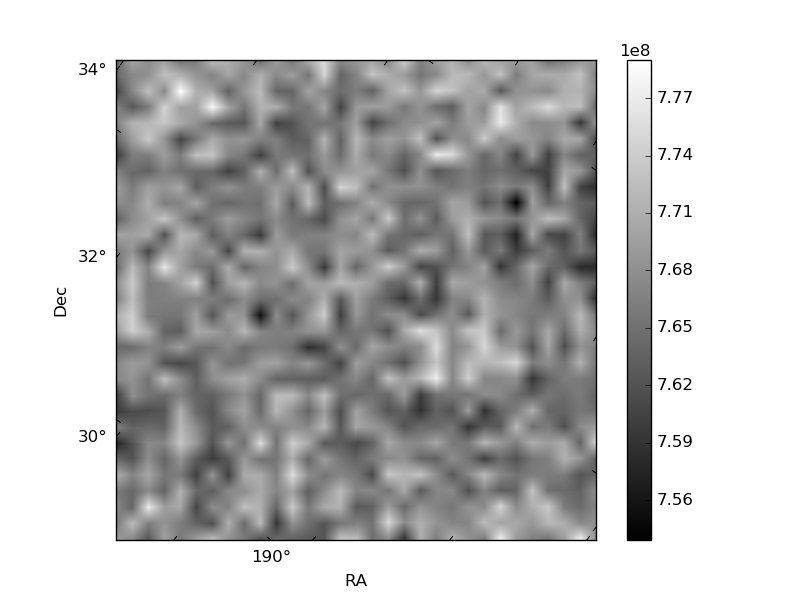
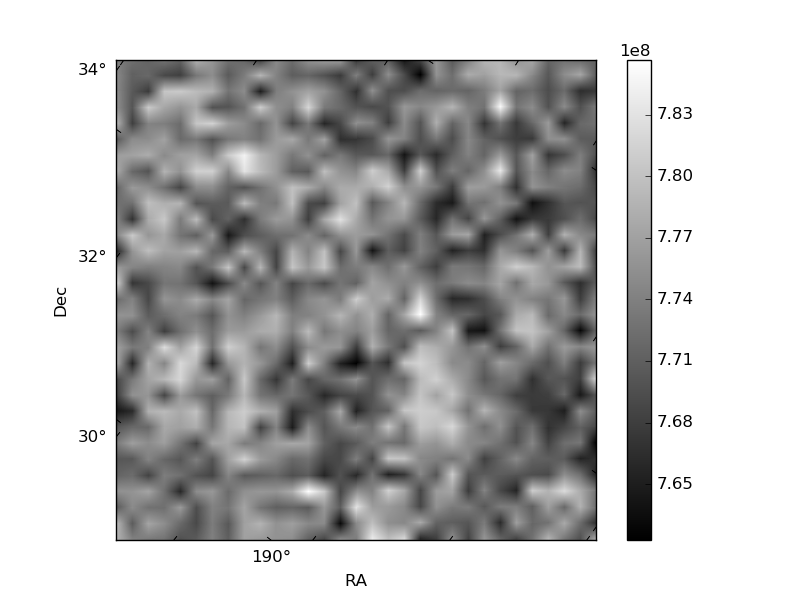
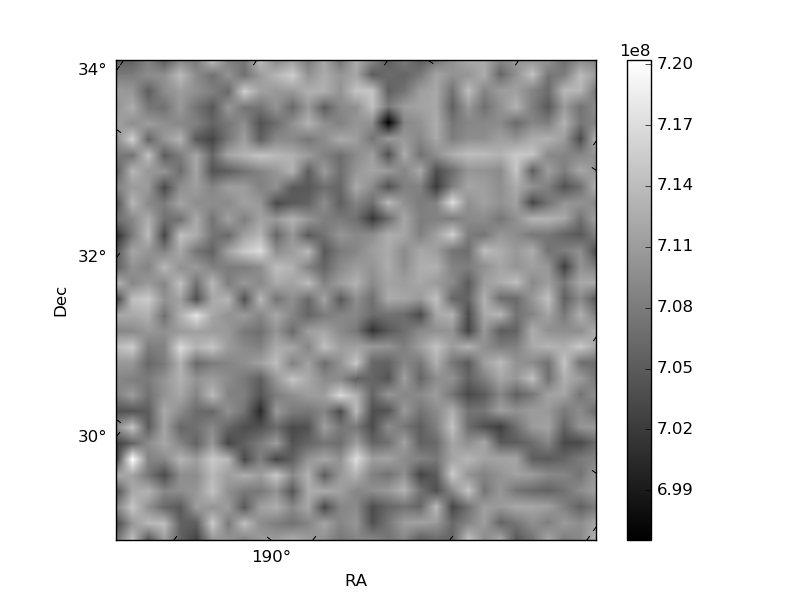
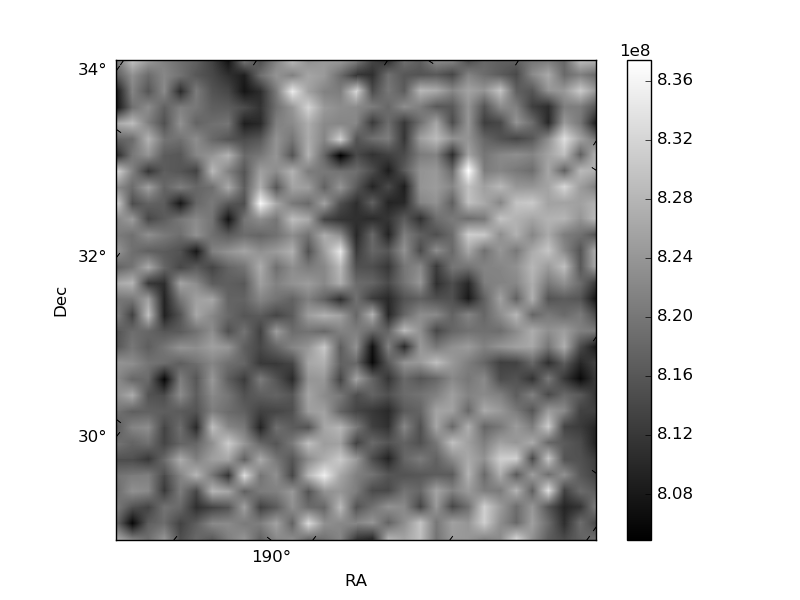
Histogram calculated using DETX and DETY for each event in the final _common_clean file
| Quadrant A | 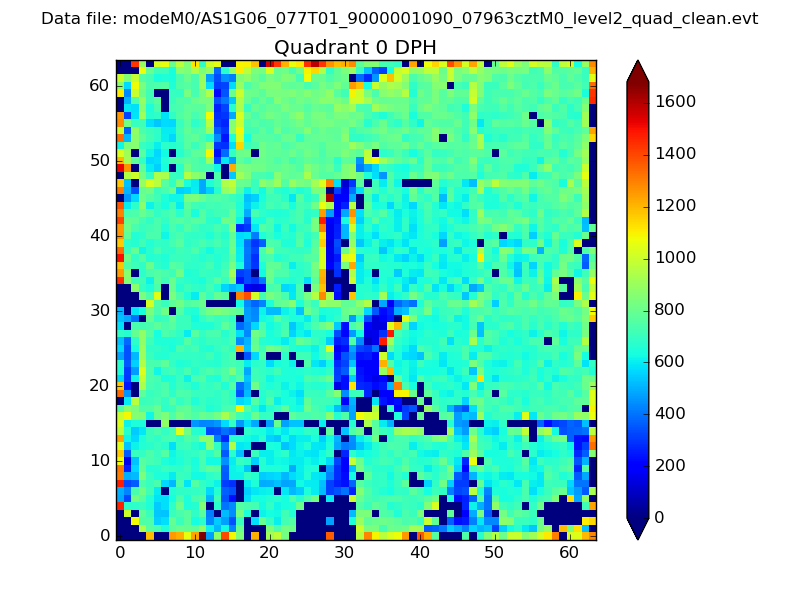 |
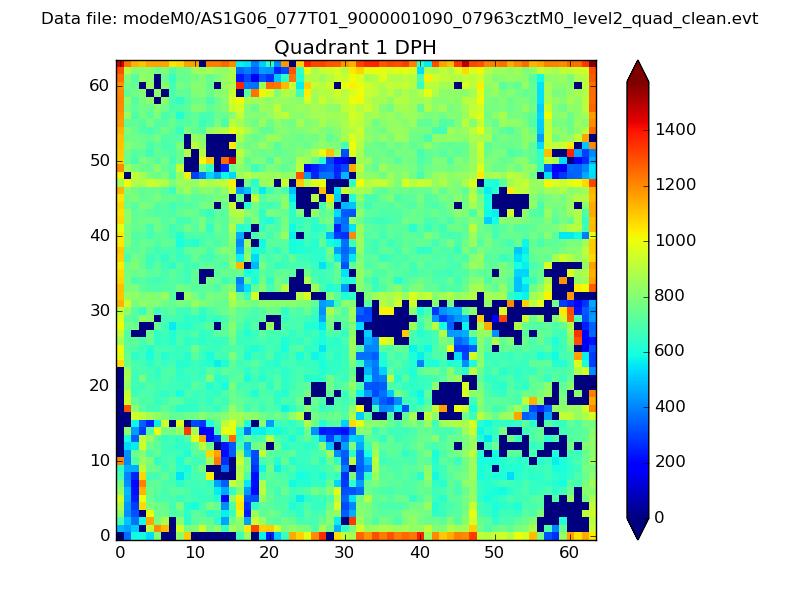 |
Quadrant B |
|---|---|---|---|
| Quadrant D | 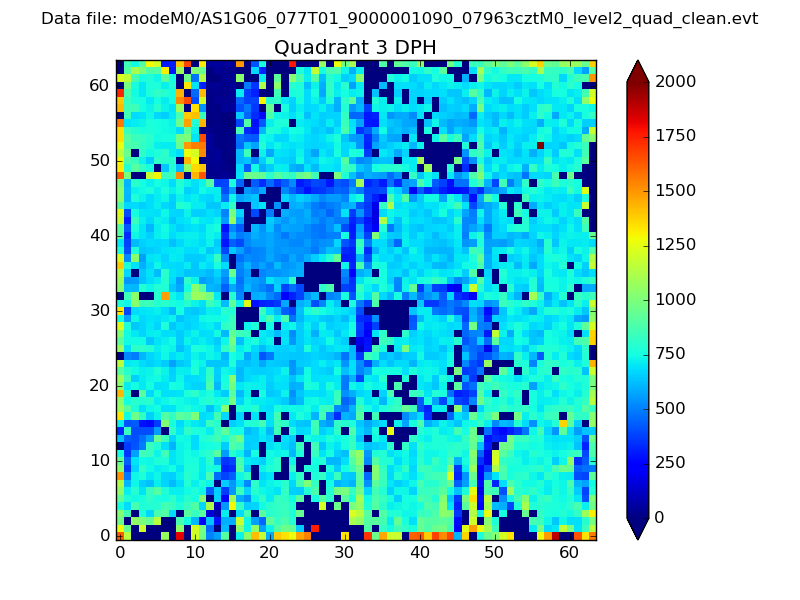 |
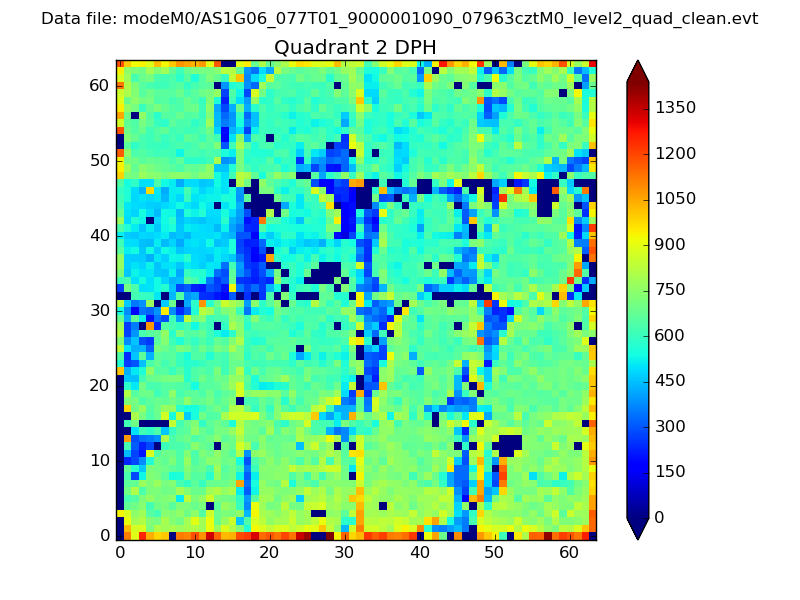 |
Quadrant C |
| Plot type | Count rate plots | Images |
|---|---|---|
| Comparison with Poisson distribution Blue bars denote a histogram of data divided into 1 sec bins. Red curve is a Poisson curve with rate = median count rate of data. |
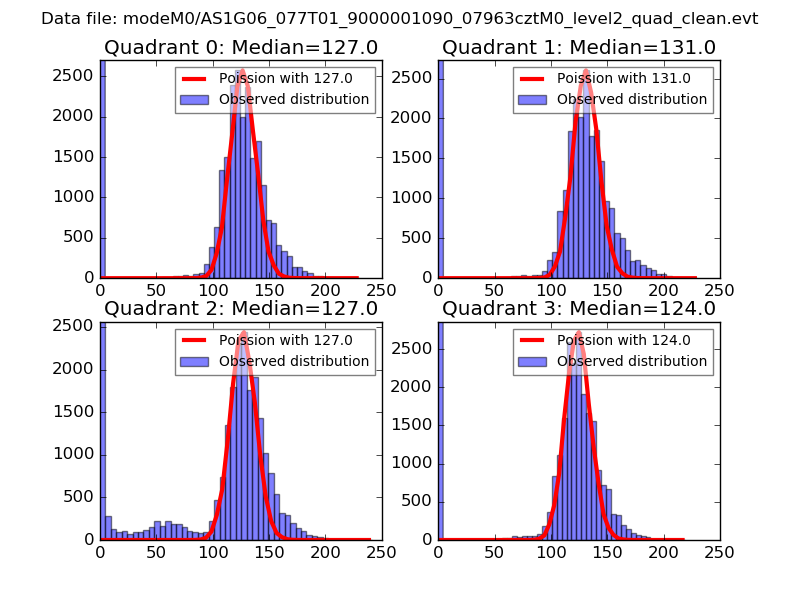 |
 |
| Quadrant-wise count rates Data is divided into 100 sec bins |
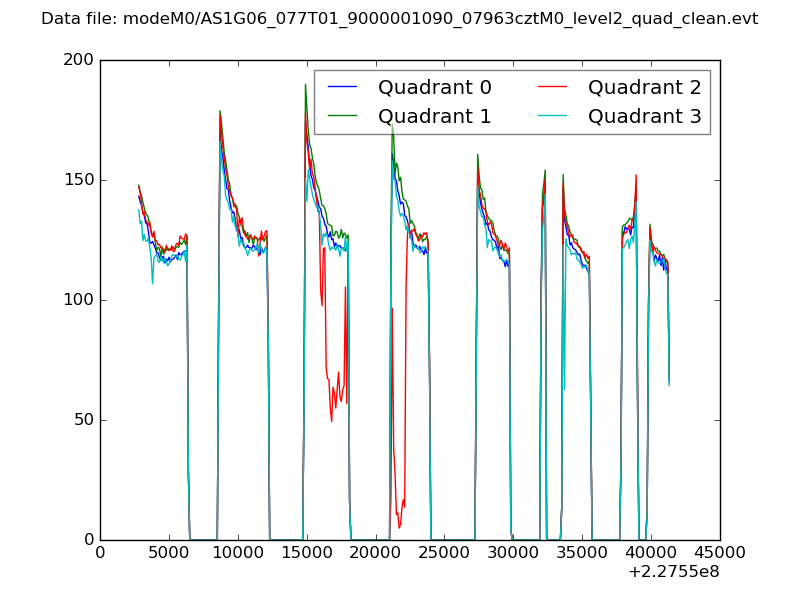 |
|
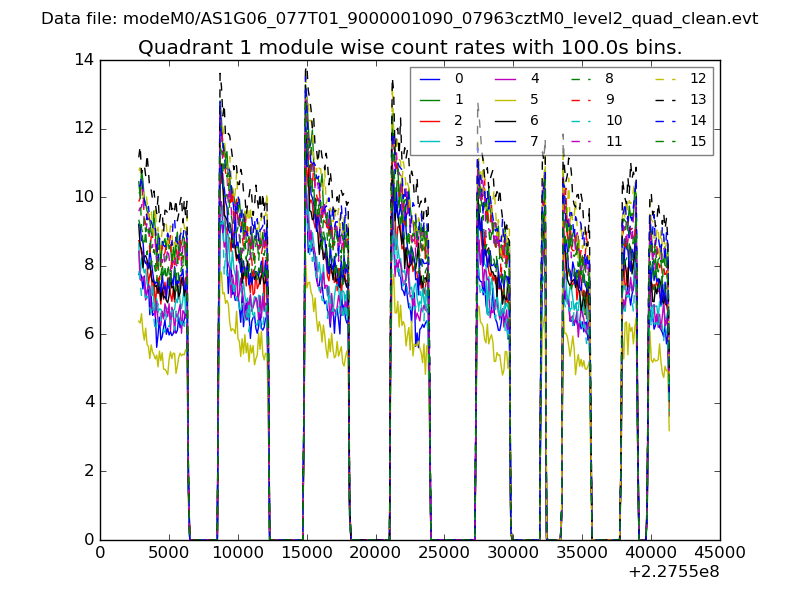
| Module-wise count rates for Quadrant A Data is divided into 100 sec bins |
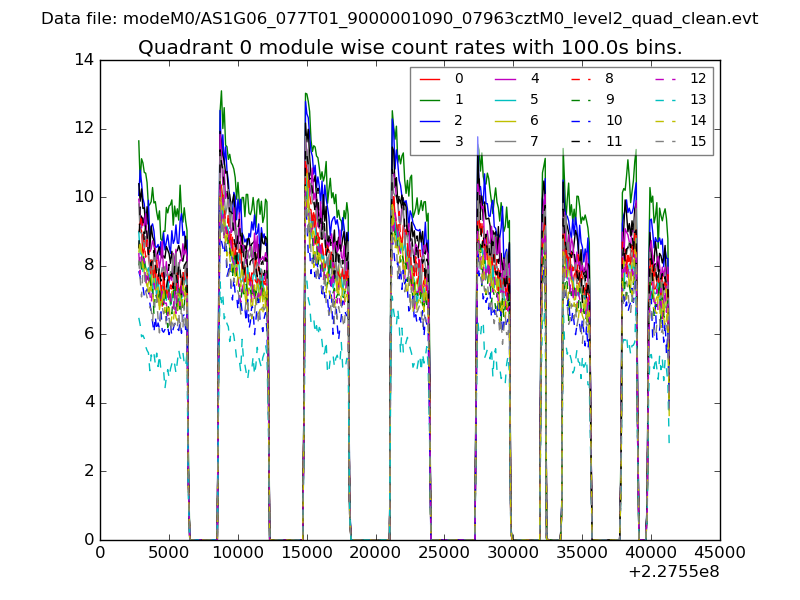 |
 |
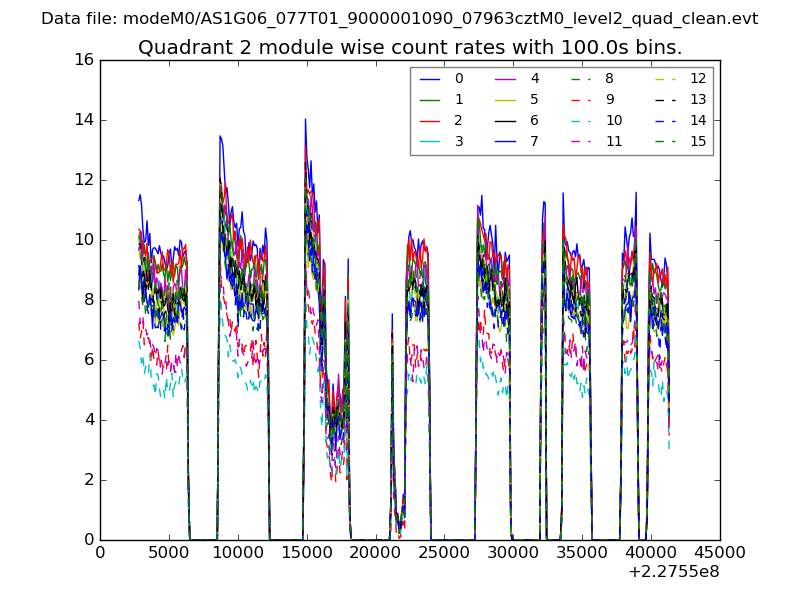
| Module-wise count rates for Quadrant B Data is divided into 100 sec bins |
 |
 |
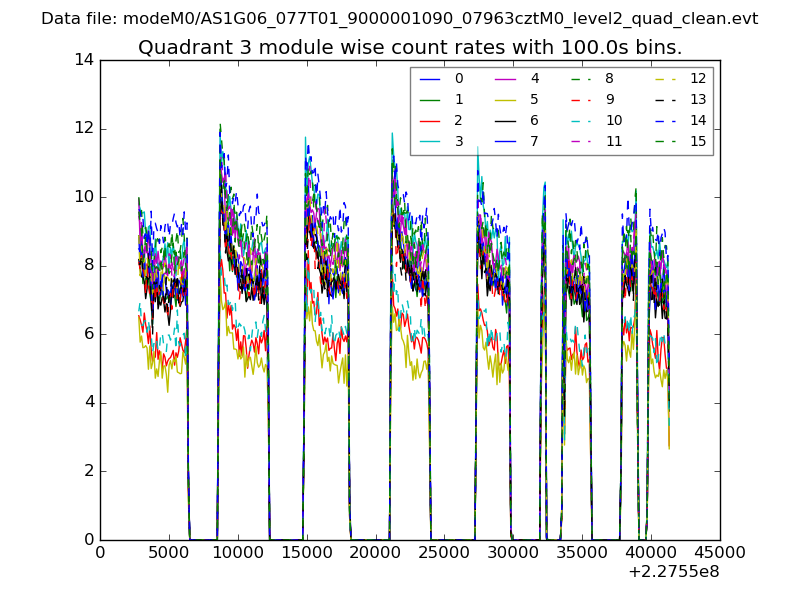
| Module-wise count rates for Quadrant C Data is divided into 100 sec bins |
 |
 |
| Module-wise count rates for Quadrant D Data is divided into 100 sec bins |
 |
 |
| Parameter | Plot |
|---|---|
| CZT HV Monitor | 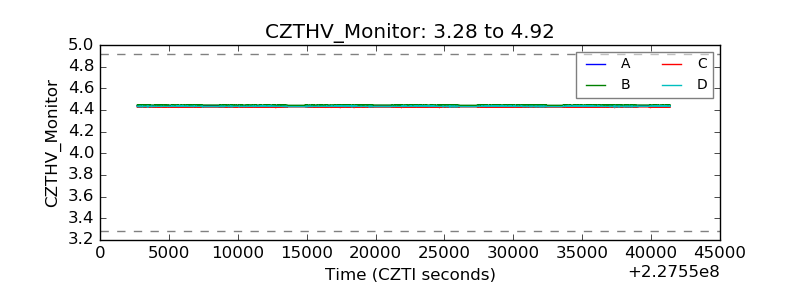 |
| D_VDD | 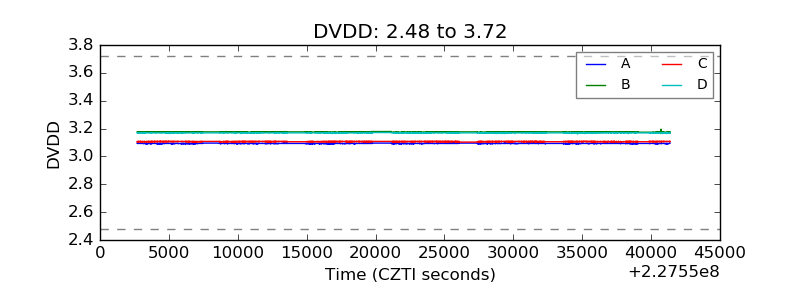 |
| Temperature 1 | 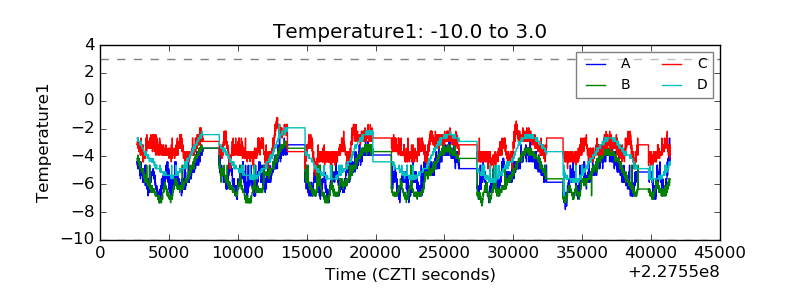 |
| Veto HV Monitor | 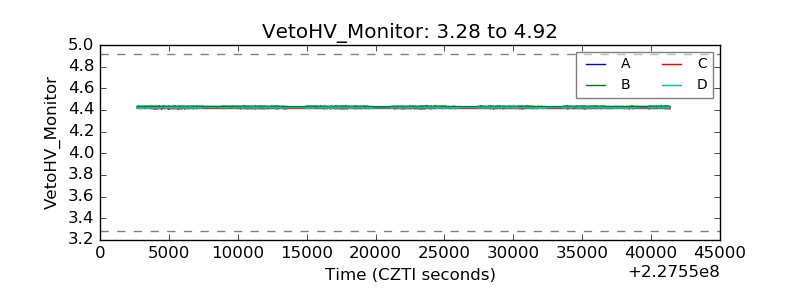 |
| Veto LLD | 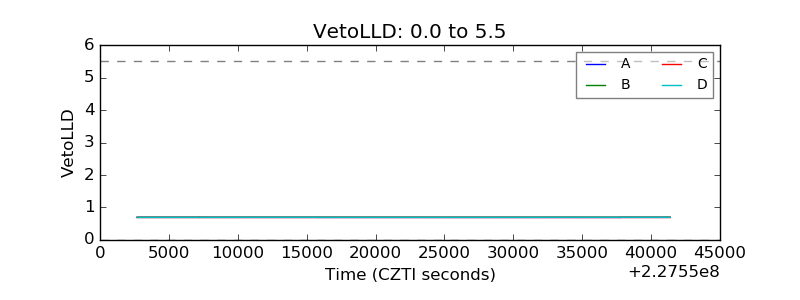 |
| Alpha Counter | 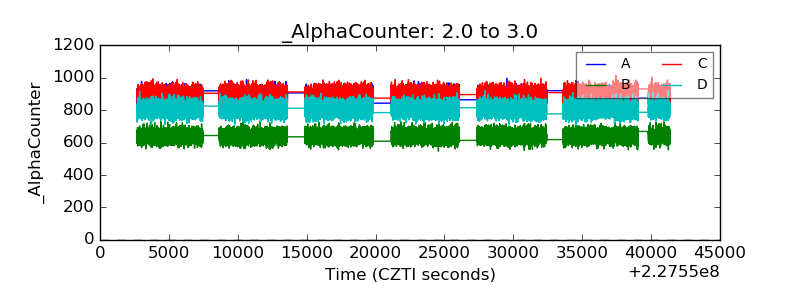 |
| _CPM_Rate | 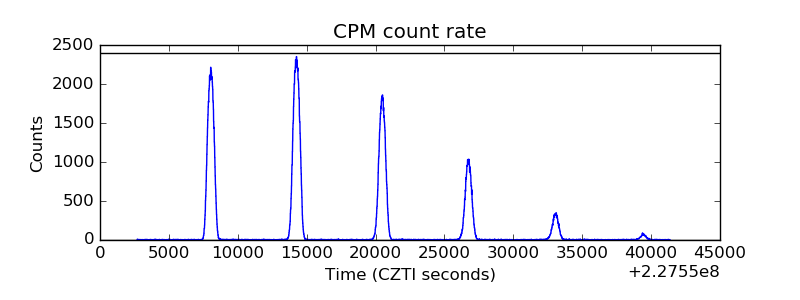 |
| CZT Counter | 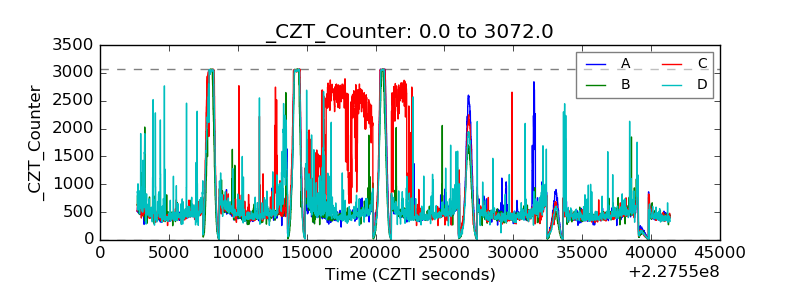 |
| +2.5 Volts monitor |  |
| +5 Volts monitor | 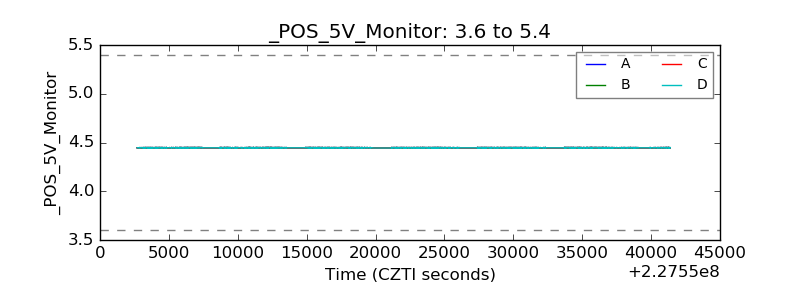 |
| _ROLL_ROT | 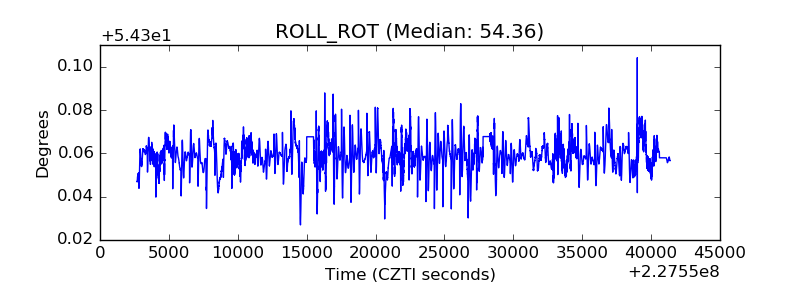 |
| _Roll_DEC | 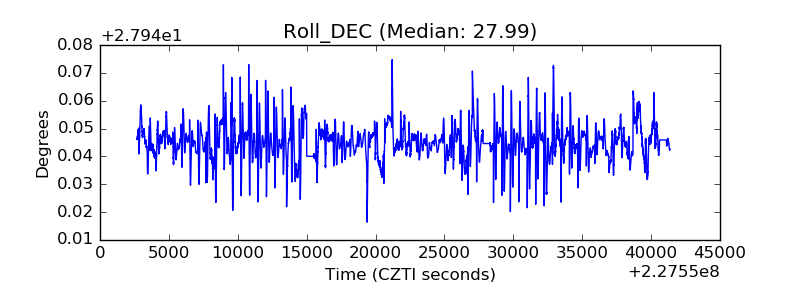 |
| _Roll_RA | 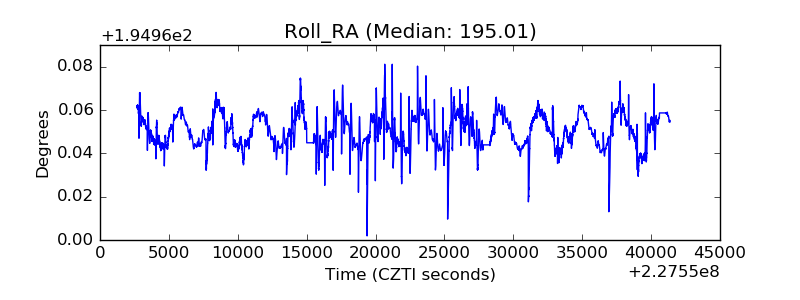 |
| Veto Counter | 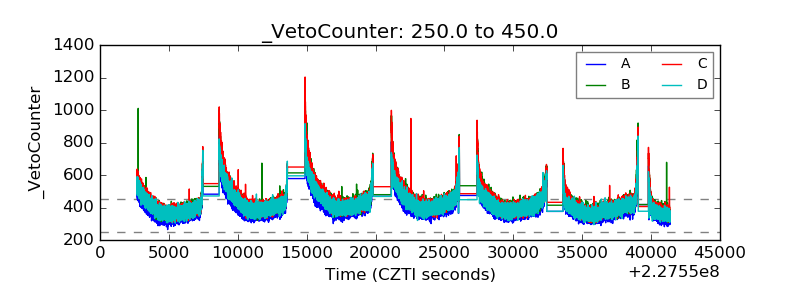 |