| Param | Original file | Final file |
|---|---|---|
| Filename | modeM0/AS1G06_077T01_9000001090_07964cztM0_level2.evt | modeM0/AS1G06_077T01_9000001090_07964cztM0_level2_quad_clean.evt |
| Size (bytes) | 582,232,320 | 111,516,480 |
| Size | 555.3 MB | 106.4 MB |
| Events in quadrant A | 5,187,013 | 649,996 |
| Events in quadrant B | 3,944,183 | 728,724 |
| Events in quadrant C | 3,820,420 | 729,295 |
| Events in quadrant D | 4,123,482 | 698,243 |
| Mode SS | |||
|---|---|---|---|
| Quadrant | BADHDUFLAG | Total packets | Discarded packets |
| A | 0 | 172 | 2 |
| B | 0 | 172 | 0 |
| C | 0 | 172 | 2 |
| D | 0 | 172 | 0 |
| Mode M0 | |||
|---|---|---|---|
| Quadrant | BADHDUFLAG | Total packets | Discarded packets |
| A | 0 | 21180 | 181 |
| B | 0 | 17399 | 145 |
| C | 0 | 17177 | 149 |
| D | 0 | 18305 | 181 |
| Mode M9 | |||
|---|---|---|---|
| Quadrant | BADHDUFLAG | Total packets | Discarded packets |
| A | 0 | 10 | 0 |
| B | 0 | 10 | 0 |
| C | 0 | 10 | 0 |
| D | 0 | 10 | 0 |
| Quadrant | Total seconds | Saturated seconds | Saturation percentage |
|---|---|---|---|
| A | 8208 | 852 | 10.380117% |
| B | 8206 | 271 | 3.302462% |
| C | 8204 | 185 | 2.254998% |
| D | 8201 | 267 | 3.255701% |
Noise dominated data is calculated using 1-second bins in cleaned event files. If a bin has >2000 counts, and if more than 50% of those come from <1% of pixels, then it is considered to be noise-dominated and hence unusable.
| Quadrant | # 1 sec bins | Bins with >0 counts | Bins with >2000 counts | High rate bins dominated by noise | Noise dominated (total time) | Noise dominated (detector-on time) | Marked lightcurve |
|---|---|---|---|---|---|---|---|
| A | 9291 | 8268 | 571 | 571 | 6.15% | 6.91% | 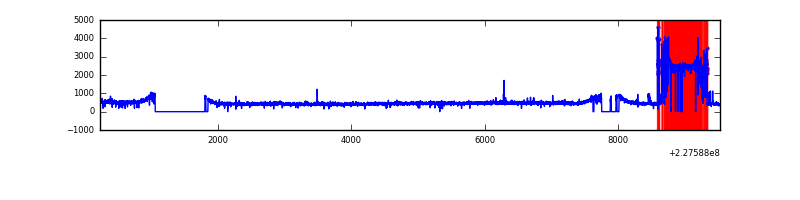 |
| B | 9291 | 8275 | 0 | 0 | 0.00% | 0.00% | 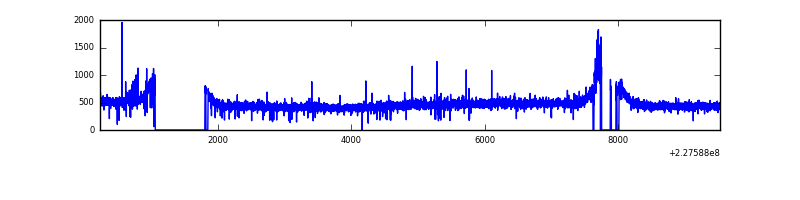 |
| C | 9291 | 8274 | 0 | 0 | 0.00% | 0.00% |  |
| D | 9291 | 8276 | 42 | 42 | 0.45% | 0.51% | 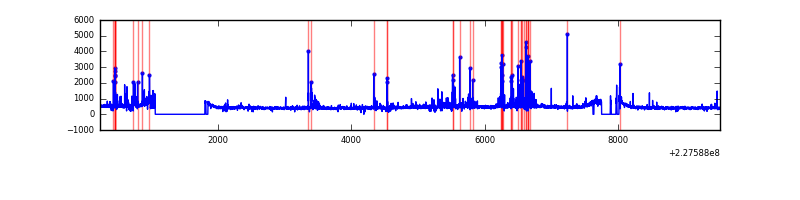 |
Top three noisy pixels from each quadrant. If the there are fewer than three noisy pixels in the level2.evt file, extra rows are filled as -1
| Pixel properties | Quadrant properties | ||||||
|---|---|---|---|---|---|---|---|
| Quadrant | DetID | PixID | Counts | Sigma | Mean | Median | Sigma |
| A | 0 | 254 | 1566368 | 8149.7 | 933 | 909 | 192.1 |
| A | 15 | 239 | 12256 | 59.07 | 933 | 909 | 192.1 |
| A | 13 | 251 | 10915 | 52.09 | 933 | 909 | 192.1 |
| B | 4 | 81 | 80941 | 413.81 | 989 | 962 | 193.3 |
| B | 12 | 111 | 21779 | 107.71 | 989 | 962 | 193.3 |
| B | 11 | 51 | 17850 | 87.38 | 989 | 962 | 193.3 |
| C | 1 | 16 | 28174 | 119.88 | 967 | 970 | 226.9 |
| C | 9 | 68 | 9812 | 38.96 | 967 | 970 | 226.9 |
| C | 13 | 61 | 7242 | 27.64 | 967 | 970 | 226.9 |
| D | 1 | 52 | 231341 | 923.19 | 953 | 927 | 249.6 |
| D | 5 | 233 | 117434 | 466.8 | 953 | 927 | 249.6 |
| D | 2 | 14 | 64759 | 255.75 | 953 | 927 | 249.6 |
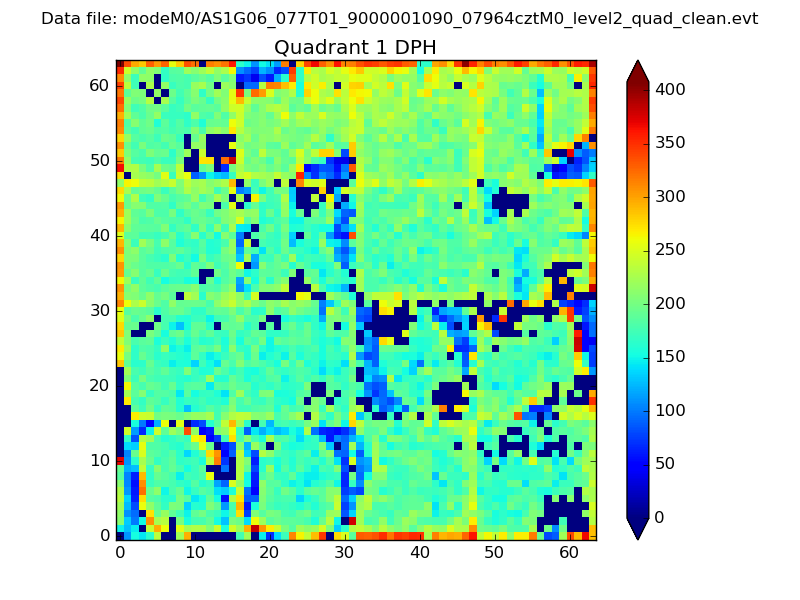
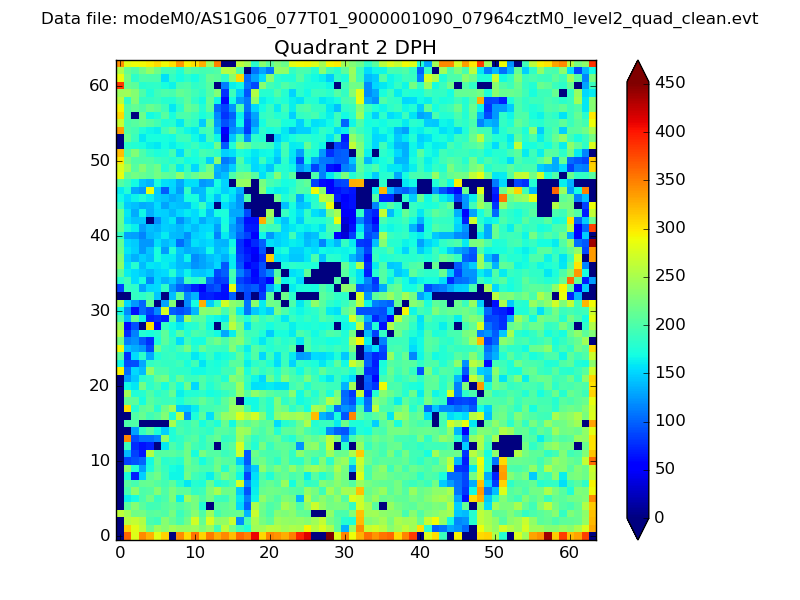
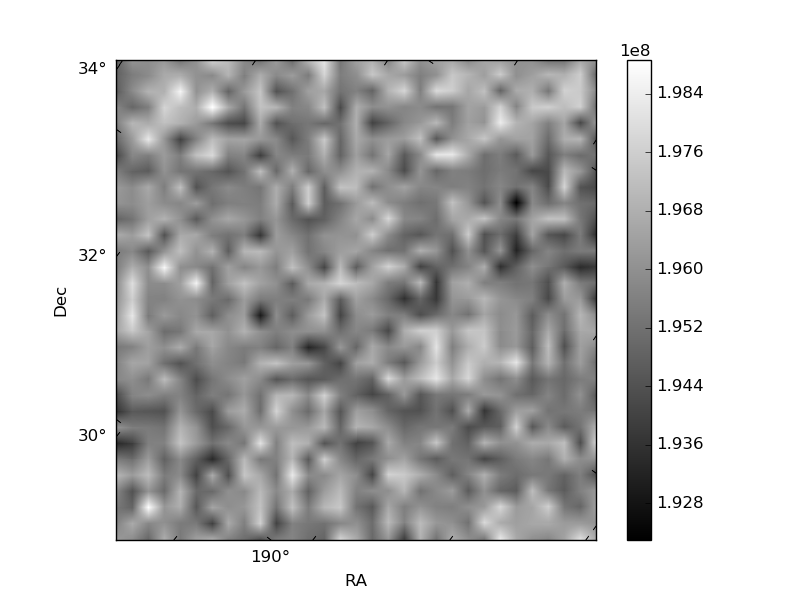
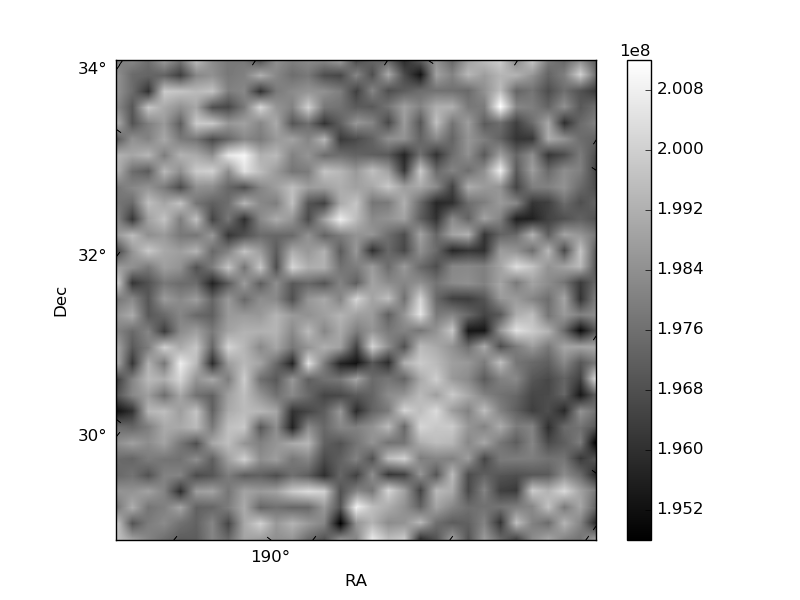
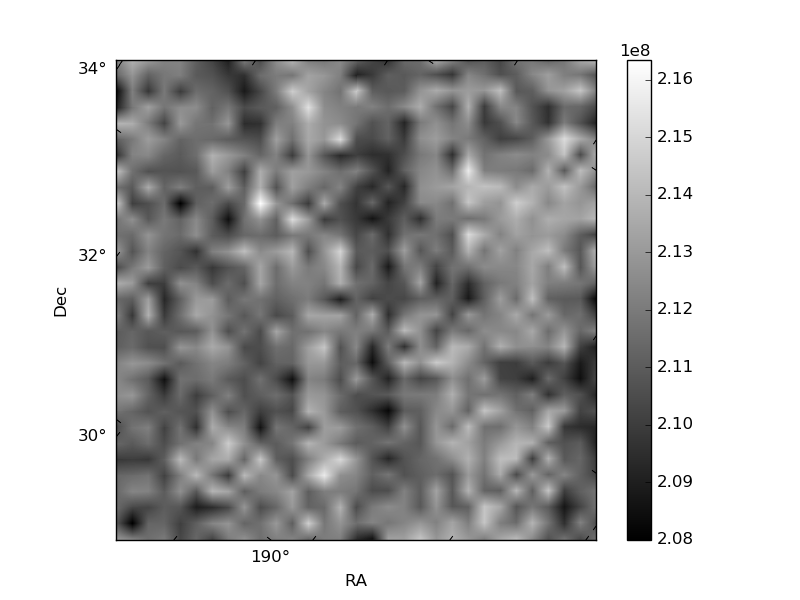
Histogram calculated using DETX and DETY for each event in the final _common_clean file
| Quadrant A | 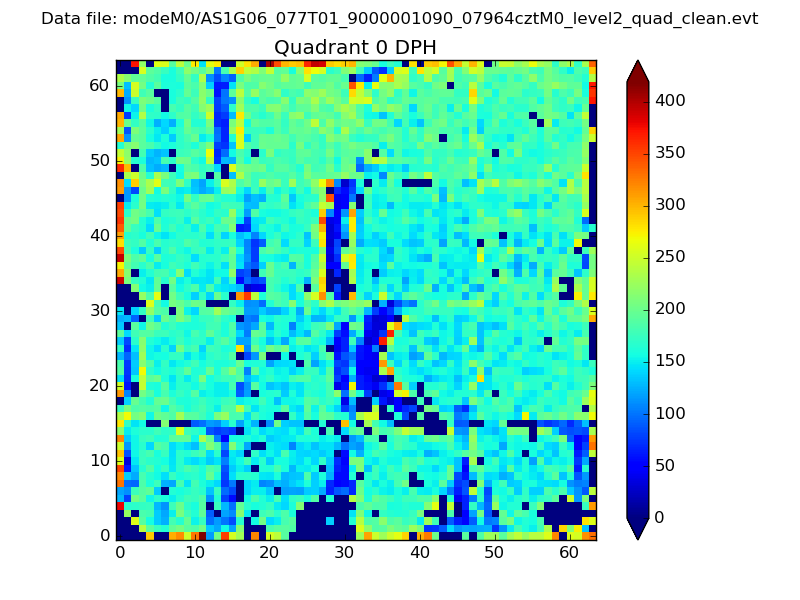 |
 |
Quadrant B |
|---|---|---|---|
| Quadrant D | 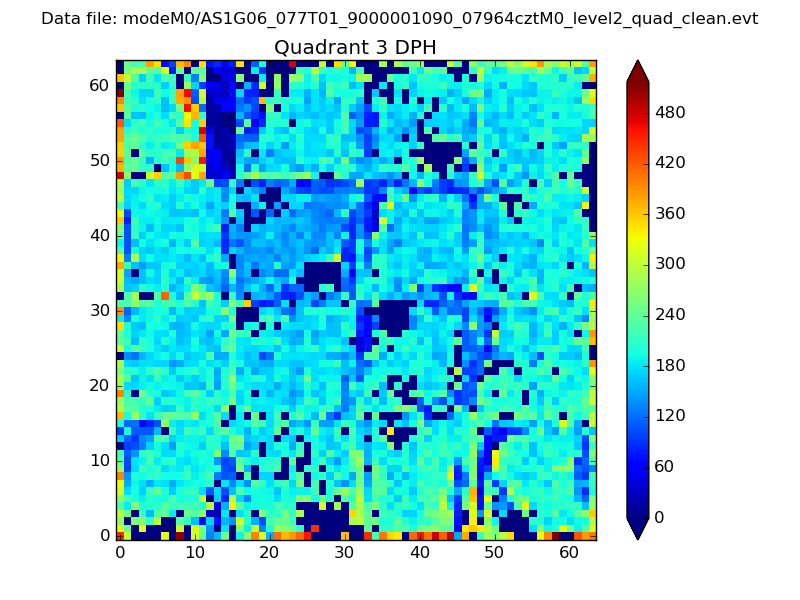 |
 |
Quadrant C |
| Plot type | Count rate plots | Images |
|---|---|---|
| Comparison with Poisson distribution Blue bars denote a histogram of data divided into 1 sec bins. Red curve is a Poisson curve with rate = median count rate of data. |
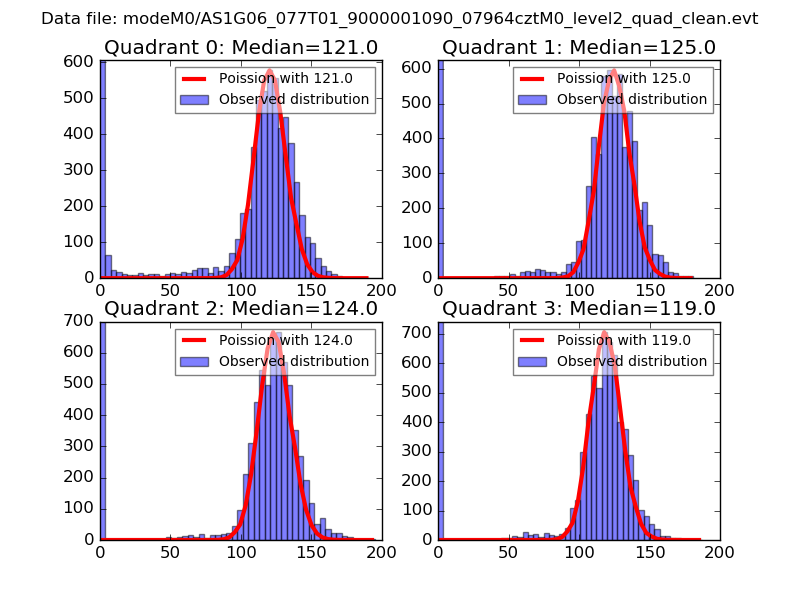 |
 |
| Quadrant-wise count rates Data is divided into 100 sec bins |
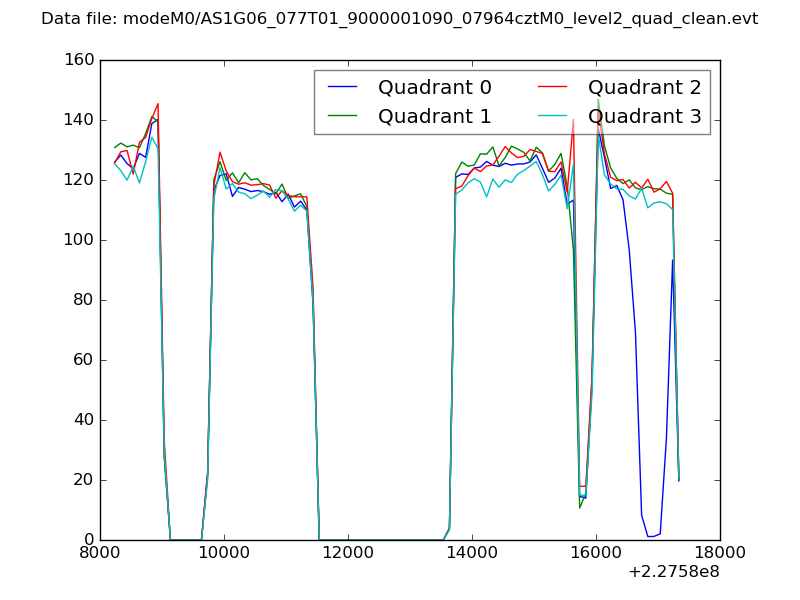 |
|
| Module-wise count rates for Quadrant A Data is divided into 100 sec bins |
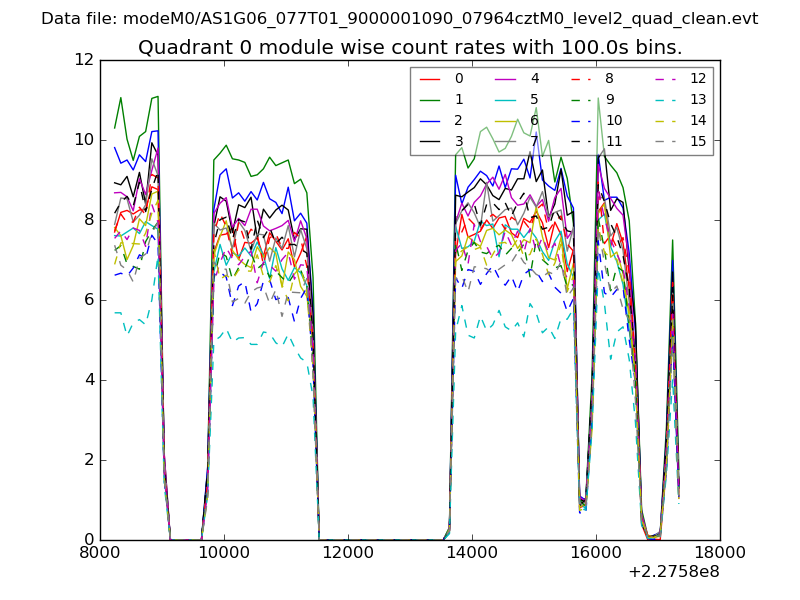 |
 |
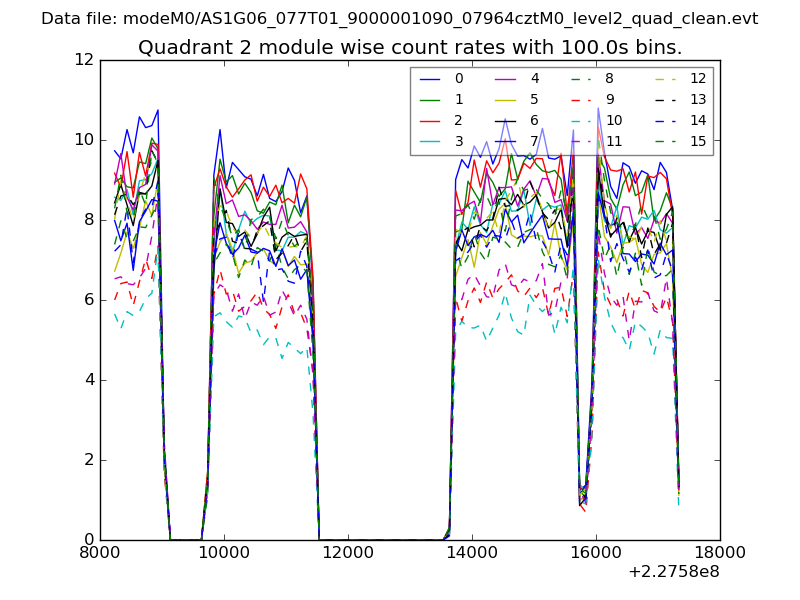
| Module-wise count rates for Quadrant B Data is divided into 100 sec bins |
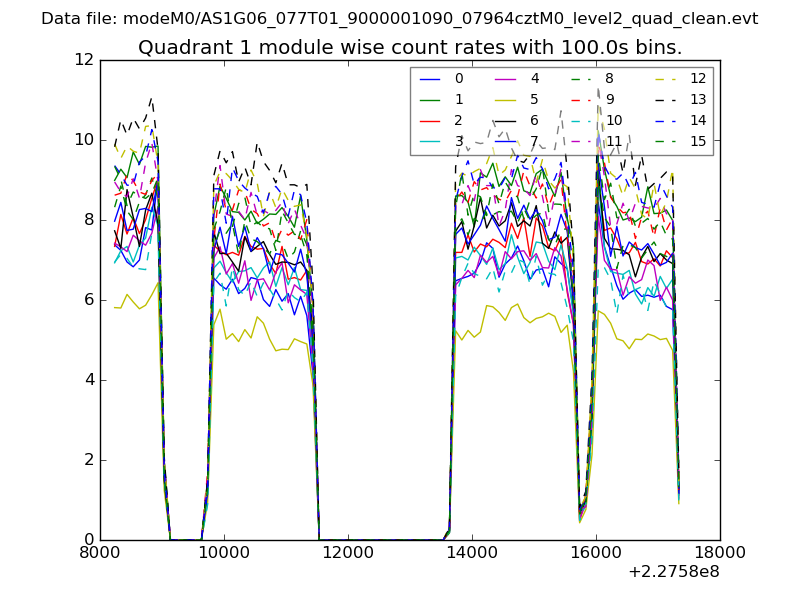 |
 |
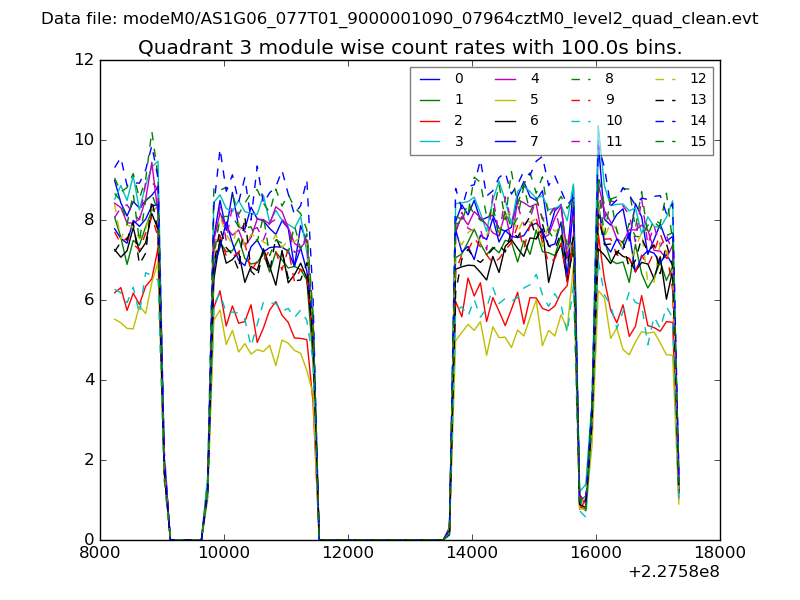
| Module-wise count rates for Quadrant C Data is divided into 100 sec bins |
 |
 |
| Module-wise count rates for Quadrant D Data is divided into 100 sec bins |
 |
 |
| Parameter | Plot |
|---|---|
| CZT HV Monitor | 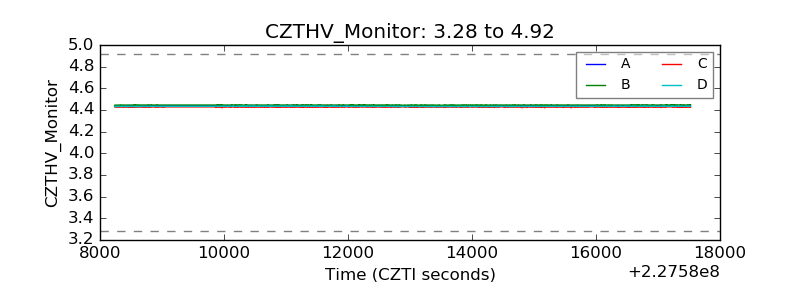 |
| D_VDD | 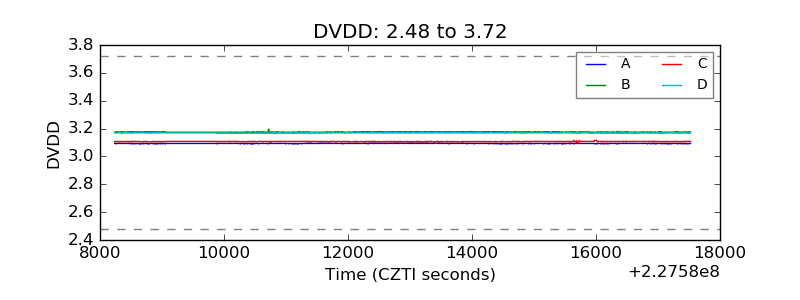 |
| Temperature 1 | 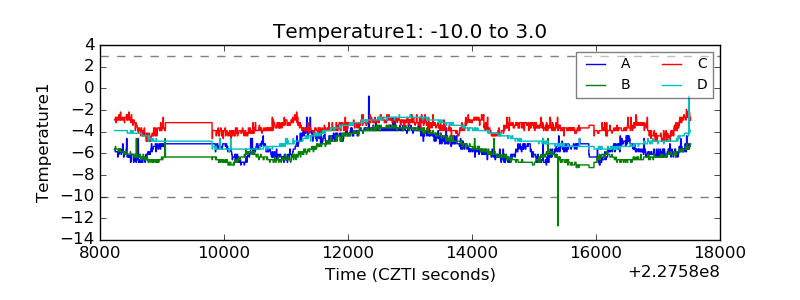 |
| Veto HV Monitor | 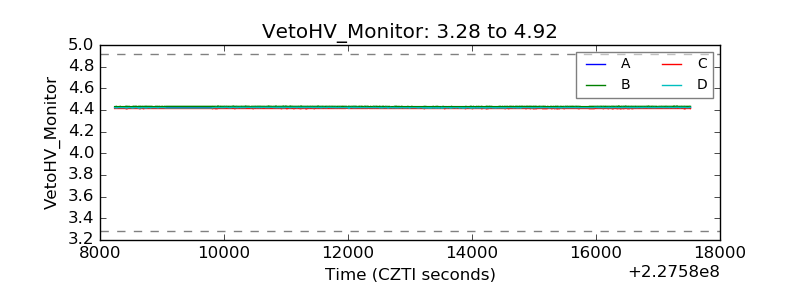 |
| Veto LLD | 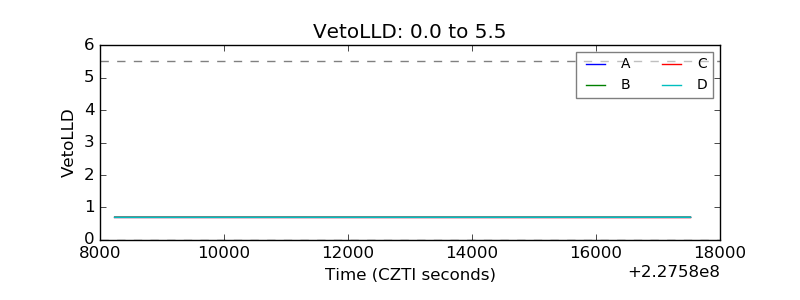 |
| Alpha Counter | 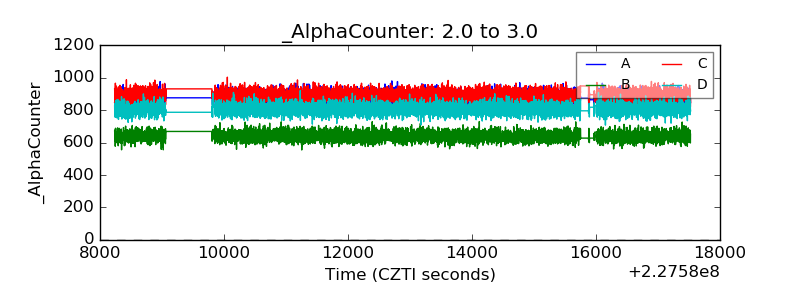 |
| _CPM_Rate |  |
| CZT Counter | 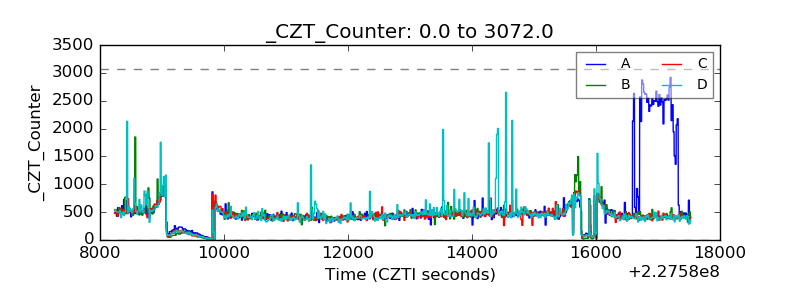 |
| +2.5 Volts monitor |  |
| +5 Volts monitor |  |
| _ROLL_ROT | 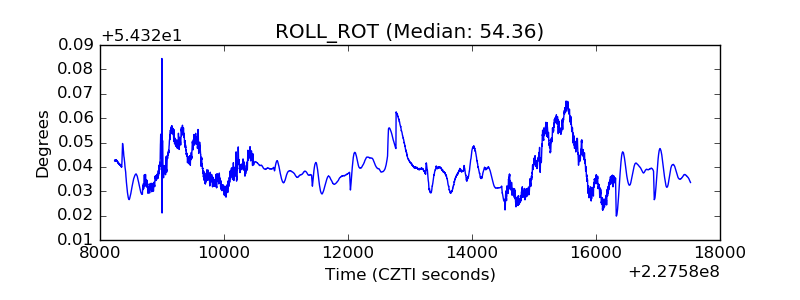 |
| _Roll_DEC | 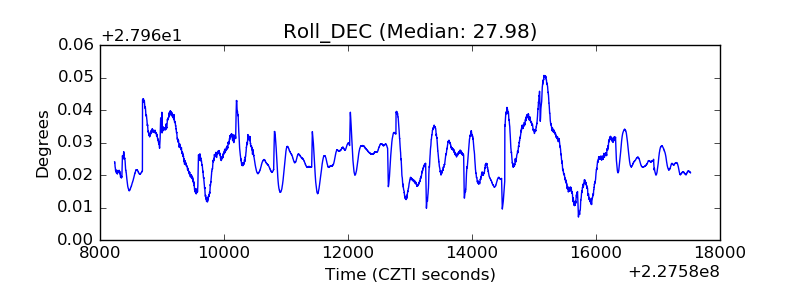 |
| _Roll_RA |  |
| Veto Counter | 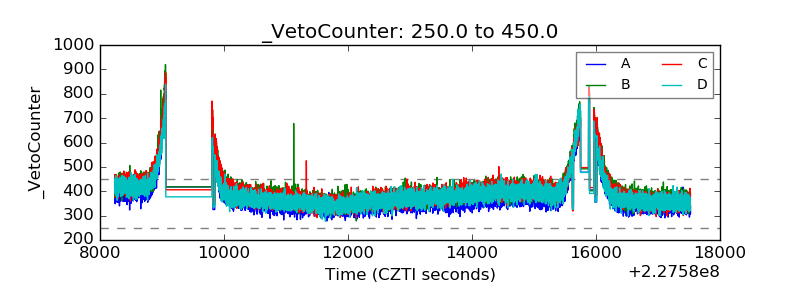 |