| Param | Original file | Final file |
|---|---|---|
| Filename | modeM0/AS1G06_077T01_9000001090_07965cztM0_level2.evt | modeM0/AS1G06_077T01_9000001090_07965cztM0_level2_quad_clean.evt |
| Size (bytes) | 513,020,160 | 86,846,400 |
| Size | 489.3 MB | 82.8 MB |
| Events in quadrant A | 4,135,371 | 492,213 |
| Events in quadrant B | 3,321,086 | 558,109 |
| Events in quadrant C | 3,269,187 | 559,979 |
| Events in quadrant D | 4,326,542 | 522,958 |
| Mode SS | |||
|---|---|---|---|
| Quadrant | BADHDUFLAG | Total packets | Discarded packets |
| A | 0 | 152 | 6 |
| B | 0 | 152 | 10 |
| C | 0 | 152 | 6 |
| D | 0 | 152 | 4 |
| Mode M0 | |||
|---|---|---|---|
| Quadrant | BADHDUFLAG | Total packets | Discarded packets |
| A | 0 | 19643 | 2490 |
| B | 0 | 15659 | 947 |
| C | 0 | 15658 | 899 |
| D | 0 | 19160 | 1202 |
| Quadrant | Total seconds | Saturated seconds | Saturation percentage |
|---|---|---|---|
| A | 7044 | 595 | 8.446905% |
| B | 7126 | 198 | 2.778557% |
| C | 7153 | 101 | 1.411995% |
| D | 7118 | 349 | 4.903063% |
Noise dominated data is calculated using 1-second bins in cleaned event files. If a bin has >2000 counts, and if more than 50% of those come from <1% of pixels, then it is considered to be noise-dominated and hence unusable.
| Quadrant | # 1 sec bins | Bins with >0 counts | Bins with >2000 counts | High rate bins dominated by noise | Noise dominated (total time) | Noise dominated (detector-on time) | Marked lightcurve |
|---|---|---|---|---|---|---|---|
| A | 7605 | 7254 | 370 | 370 | 4.87% | 5.10% | 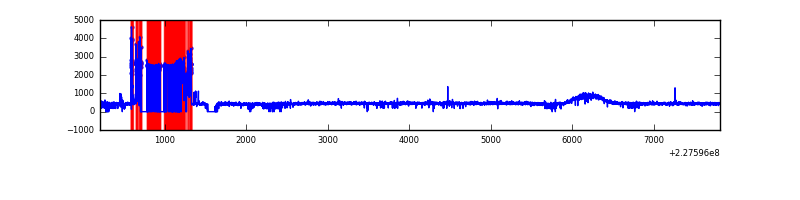 |
| B | 7605 | 7413 | 0 | 0 | 0.00% | 0.00% | 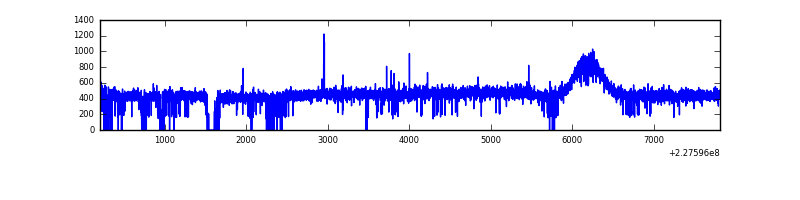 |
| C | 7605 | 7412 | 0 | 0 | 0.00% | 0.00% |  |
| D | 7605 | 7392 | 152 | 152 | 2.00% | 2.06% |  |
Top three noisy pixels from each quadrant. If the there are fewer than three noisy pixels in the level2.evt file, extra rows are filled as -1
| Pixel properties | Quadrant properties | ||||||
|---|---|---|---|---|---|---|---|
| Quadrant | DetID | PixID | Counts | Sigma | Mean | Median | Sigma |
| A | 0 | 254 | 1027942 | 6199.48 | 804 | 783 | 165.7 |
| A | 0 | 226 | 7469 | 40.35 | 804 | 783 | 165.7 |
| A | 12 | 194 | 6710 | 35.77 | 804 | 783 | 165.7 |
| B | 12 | 111 | 19154 | 108.83 | 853 | 831 | 168.4 |
| B | 11 | 111 | 15384 | 86.43 | 853 | 831 | 168.4 |
| B | 14 | 111 | 11123 | 61.13 | 853 | 831 | 168.4 |
| C | 1 | 16 | 19488 | 95.38 | 832 | 836 | 195.5 |
| C | 13 | 61 | 6223 | 27.55 | 832 | 836 | 195.5 |
| C | 9 | 68 | 2694 | 9.5 | 832 | 836 | 195.5 |
| D | 4 | 95 | 766078 | 3463.69 | 812 | 794 | 220.9 |
| D | 1 | 52 | 307567 | 1388.46 | 812 | 794 | 220.9 |
| D | 2 | 14 | 107584 | 483.33 | 812 | 794 | 220.9 |
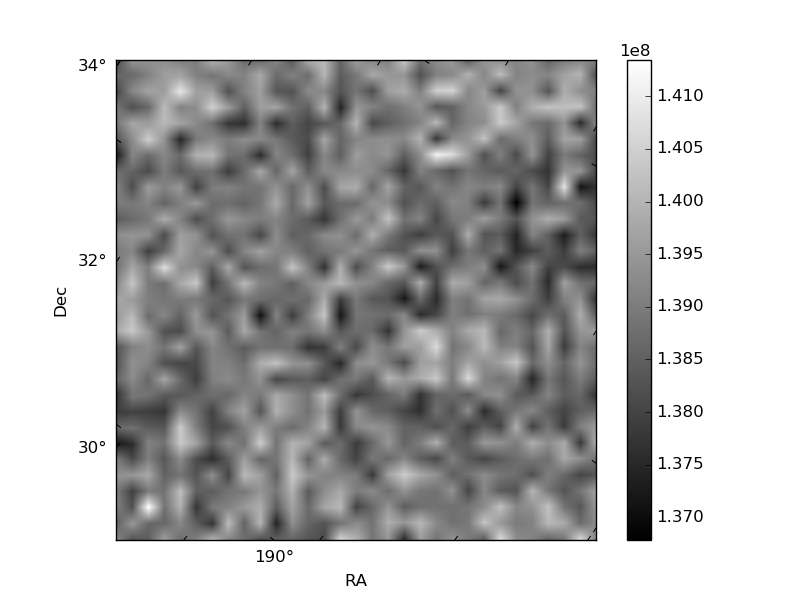
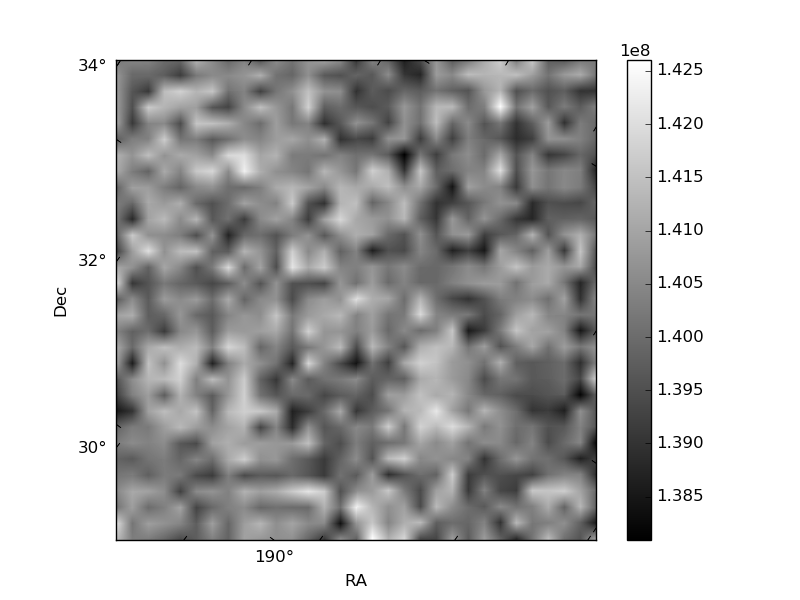
Histogram calculated using DETX and DETY for each event in the final _common_clean file
| Quadrant A | 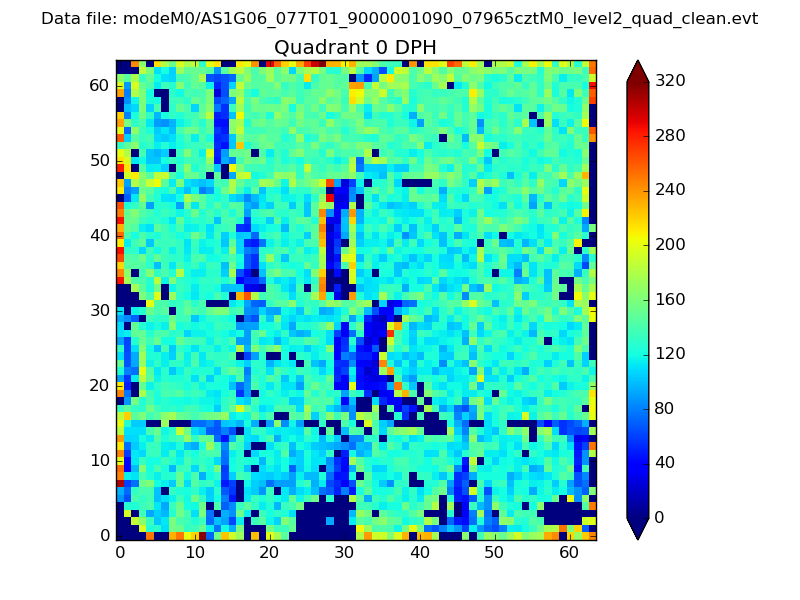 |
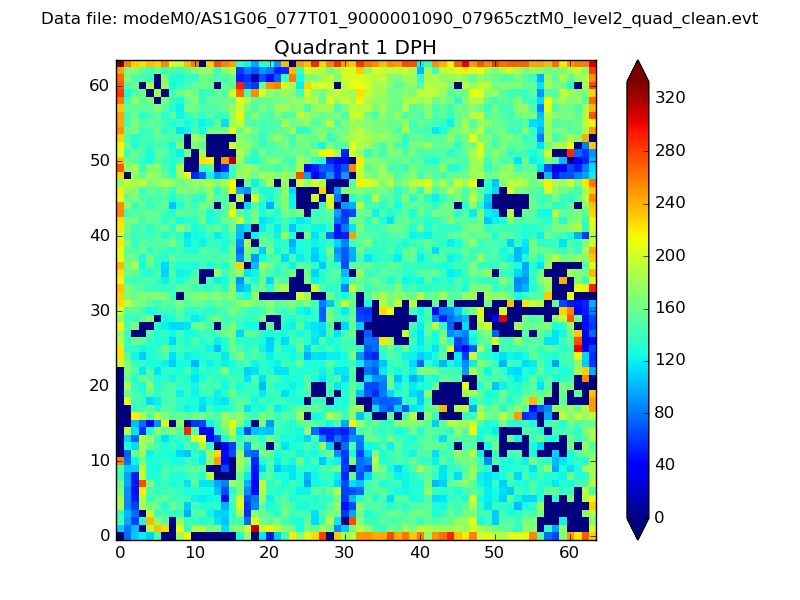 |
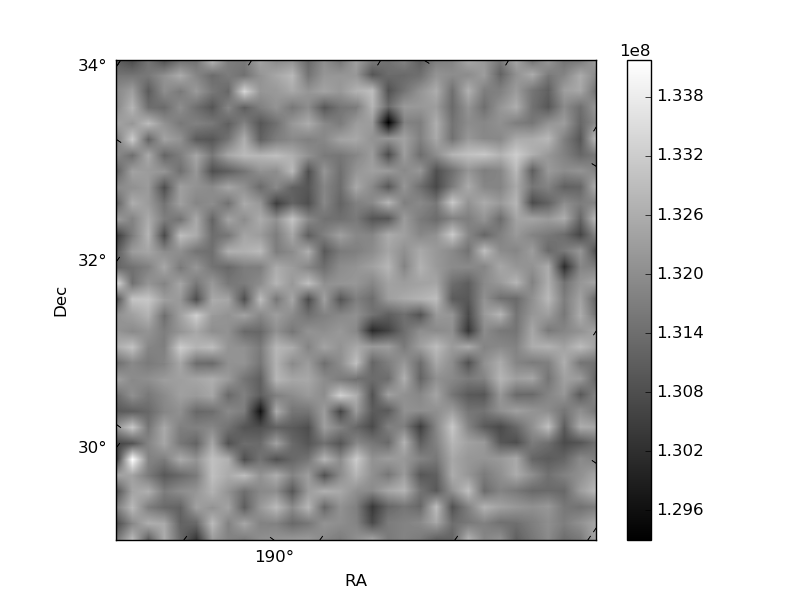
Quadrant B |
|---|---|---|---|
| Quadrant D |  |
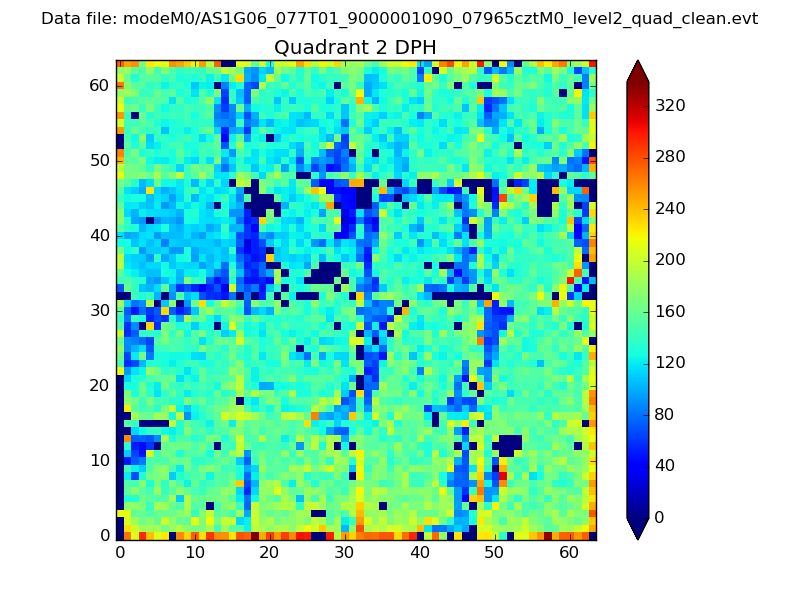 |
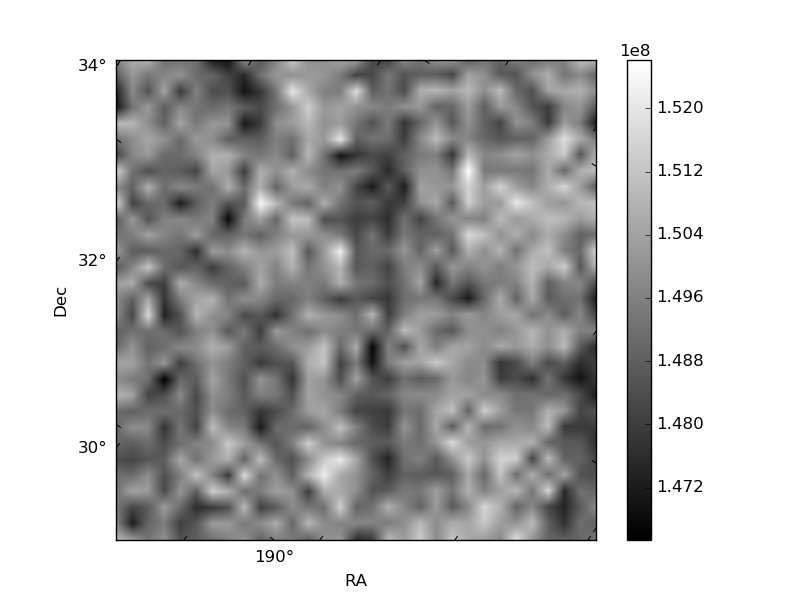
Quadrant C |
| Plot type | Count rate plots | Images |
|---|---|---|
| Comparison with Poisson distribution Blue bars denote a histogram of data divided into 1 sec bins. Red curve is a Poisson curve with rate = median count rate of data. |
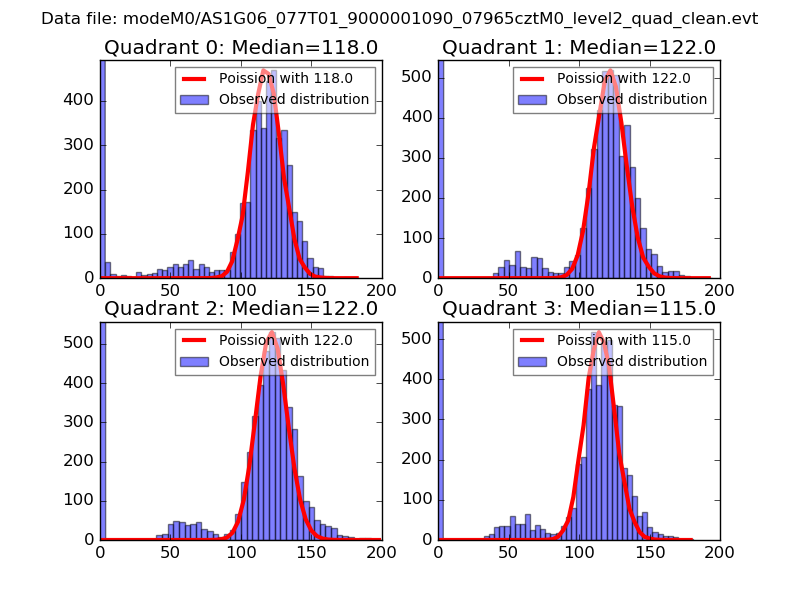 |
 |
| Quadrant-wise count rates Data is divided into 100 sec bins |
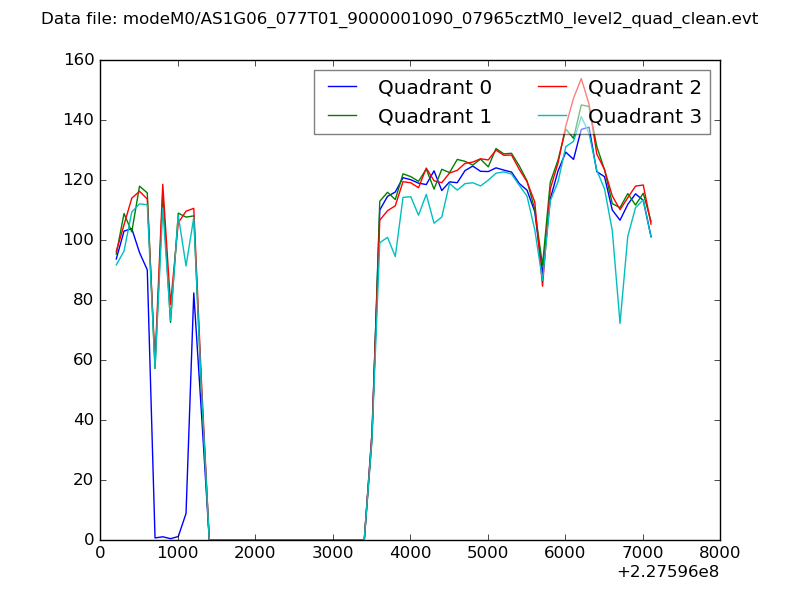 |
|
| Module-wise count rates for Quadrant A Data is divided into 100 sec bins |
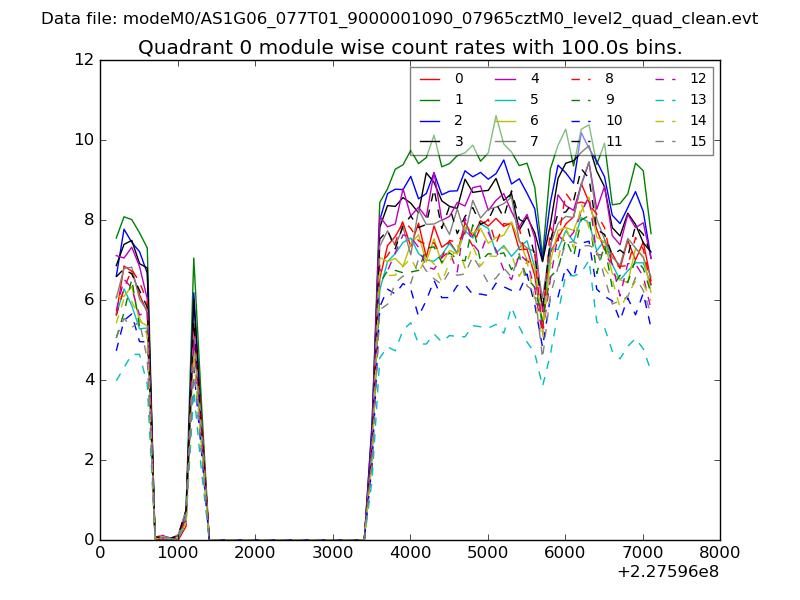 |
 |
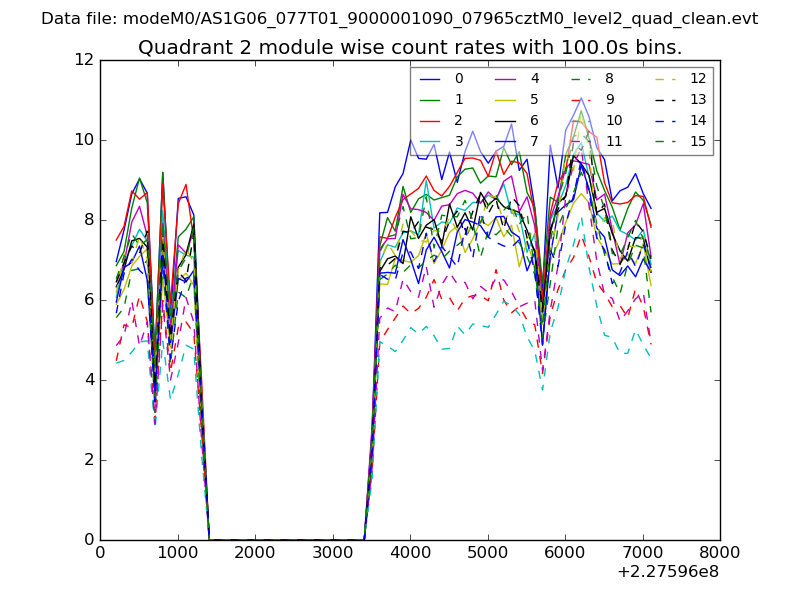
| Module-wise count rates for Quadrant B Data is divided into 100 sec bins |
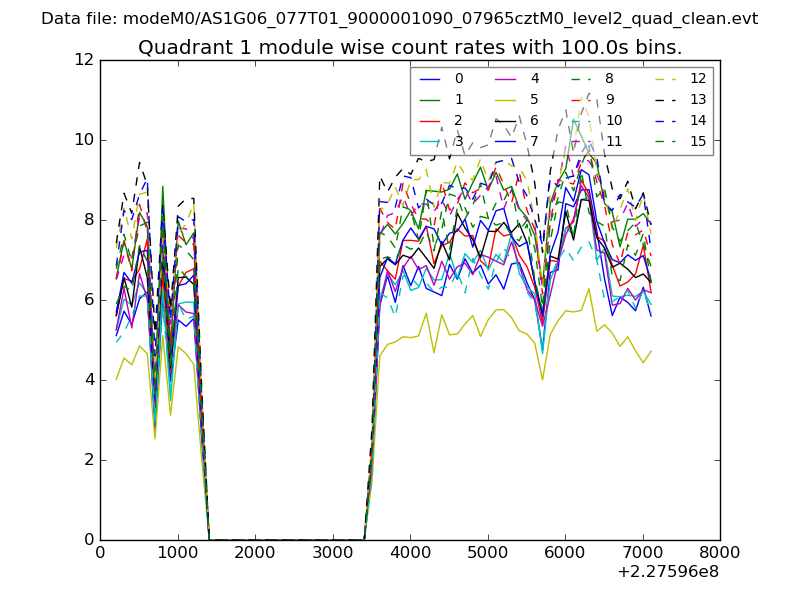 |
 |
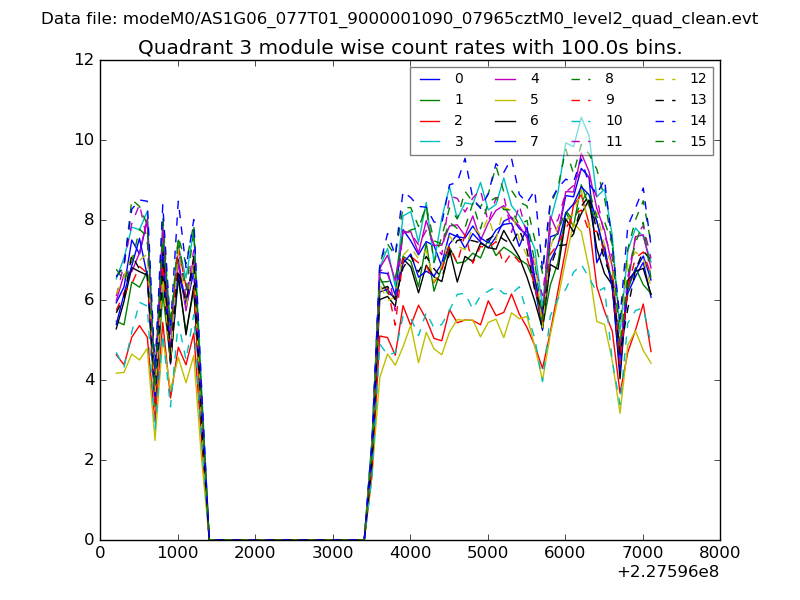
| Module-wise count rates for Quadrant C Data is divided into 100 sec bins |
 |
 |
| Module-wise count rates for Quadrant D Data is divided into 100 sec bins |
 |
 |
| Parameter | Plot |
|---|---|
| CZT HV Monitor | 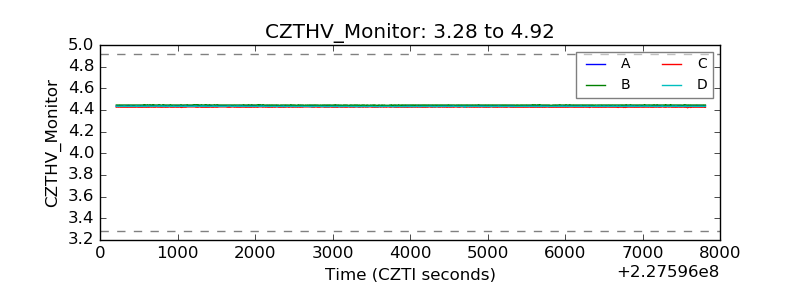 |
| D_VDD | 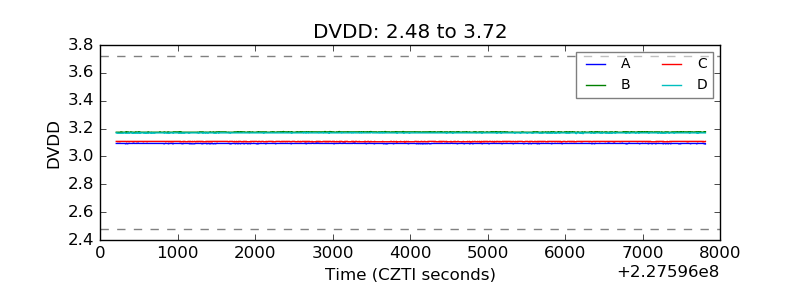 |
| Temperature 1 | 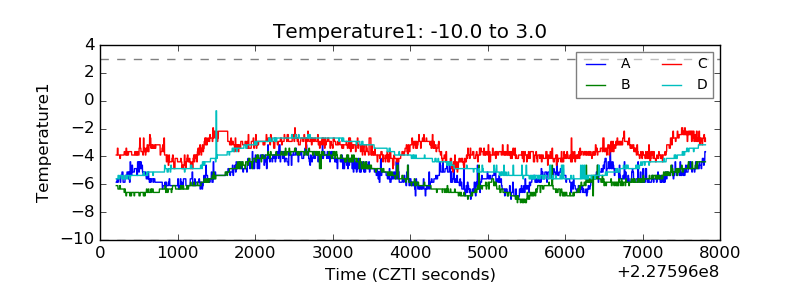 |
| Veto HV Monitor | 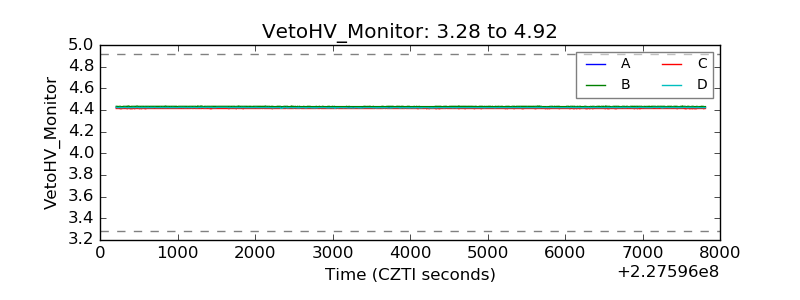 |
| Veto LLD | 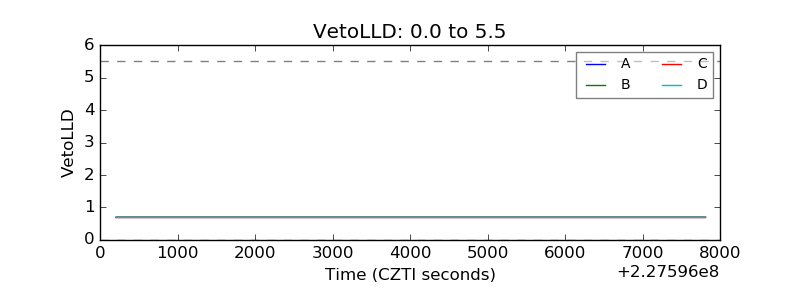 |
| Alpha Counter | 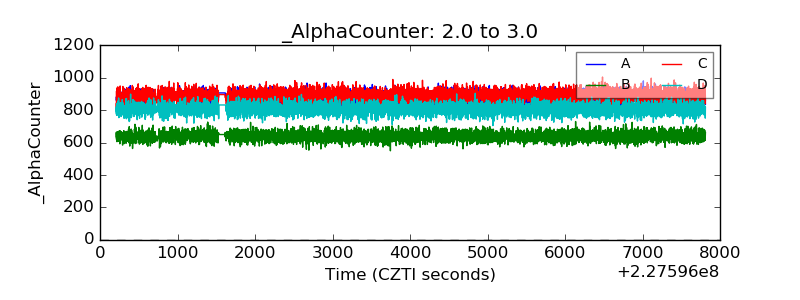 |
| _CPM_Rate | 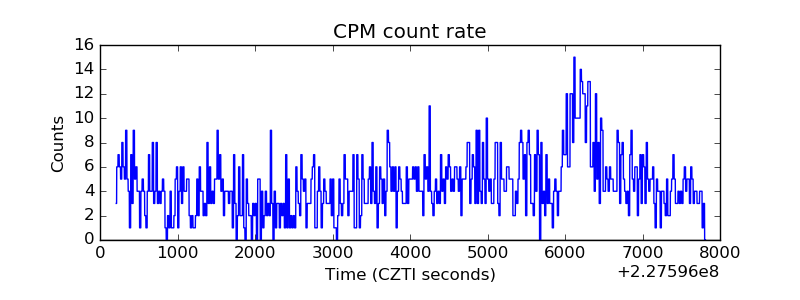 |
| CZT Counter | 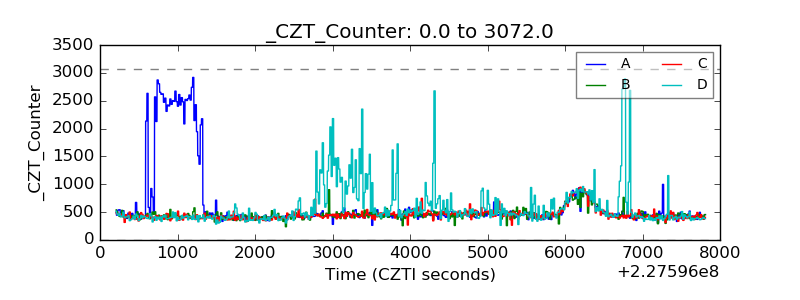 |
| +2.5 Volts monitor |  |
| +5 Volts monitor |  |
| _ROLL_ROT | 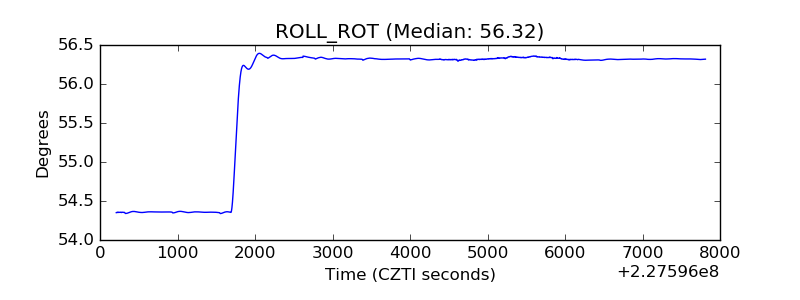 |
| _Roll_DEC | 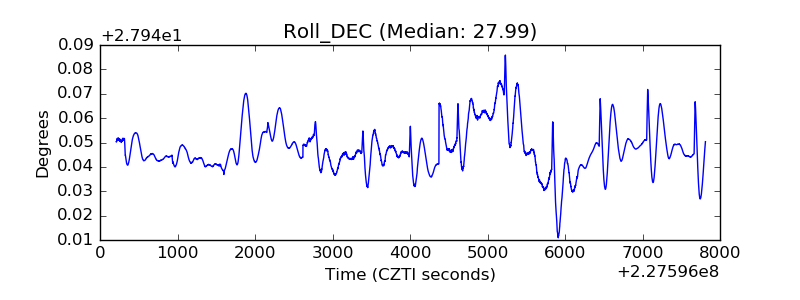 |
| _Roll_RA | 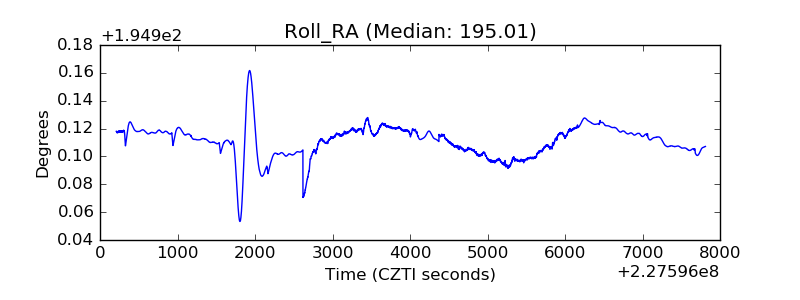 |
| Veto Counter | 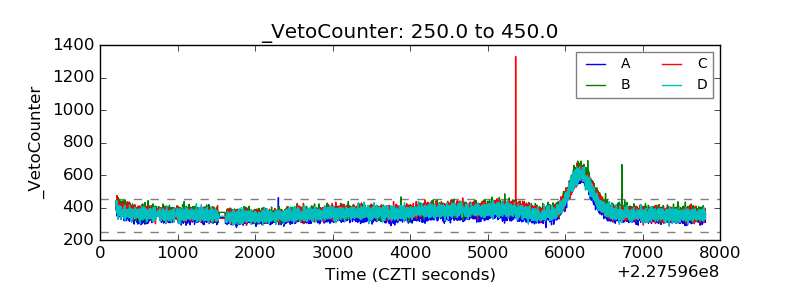 |