| Param | Original file | Final file |
|---|---|---|
| Filename | modeM0/AS1G06_077T01_9000001090_07966cztM0_level2.evt | modeM0/AS1G06_077T01_9000001090_07966cztM0_level2_quad_clean.evt |
| Size (bytes) | 589,118,400 | 99,950,400 |
| Size | 561.8 MB | 95.3 MB |
| Events in quadrant A | 4,034,405 | 603,089 |
| Events in quadrant B | 4,161,659 | 625,155 |
| Events in quadrant C | 4,111,737 | 626,351 |
| Events in quadrant D | 4,961,136 | 586,137 |
| Mode SS | |||
|---|---|---|---|
| Quadrant | BADHDUFLAG | Total packets | Discarded packets |
| A | 0 | 170 | 0 |
| B | 0 | 170 | 0 |
| C | 0 | 170 | 0 |
| D | 0 | 170 | 2 |
| Mode M0 | |||
|---|---|---|---|
| Quadrant | BADHDUFLAG | Total packets | Discarded packets |
| A | 0 | 17863 | 54 |
| B | 0 | 18084 | 57 |
| C | 0 | 18186 | 47 |
| D | 0 | 20705 | 74 |
| Mode M9 | |||
|---|---|---|---|
| Quadrant | BADHDUFLAG | Total packets | Discarded packets |
| A | 0 | 1 | 0 |
| B | 0 | 1 | 0 |
| C | 0 | 1 | 0 |
| D | 0 | 1 | 0 |
| Quadrant | Total seconds | Saturated seconds | Saturation percentage |
|---|---|---|---|
| A | 8429 | 512 | 6.074267% |
| B | 8427 | 499 | 5.921443% |
| C | 8433 | 362 | 4.292660% |
| D | 8427 | 660 | 7.831969% |
Noise dominated data is calculated using 1-second bins in cleaned event files. If a bin has >2000 counts, and if more than 50% of those come from <1% of pixels, then it is considered to be noise-dominated and hence unusable.
| Quadrant | # 1 sec bins | Bins with >0 counts | Bins with >2000 counts | High rate bins dominated by noise | Noise dominated (total time) | Noise dominated (detector-on time) | Marked lightcurve |
|---|---|---|---|---|---|---|---|
| A | 8520 | 8454 | 0 | 0 | 0.00% | 0.00% | 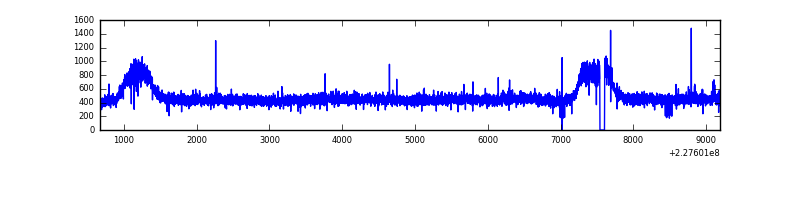 |
| B | 8520 | 8454 | 9 | 9 | 0.11% | 0.11% | 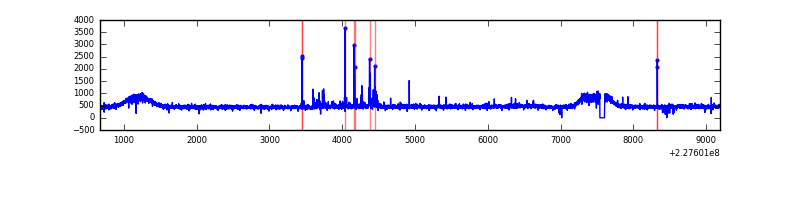 |
| C | 8520 | 8455 | 1 | 1 | 0.01% | 0.01% | 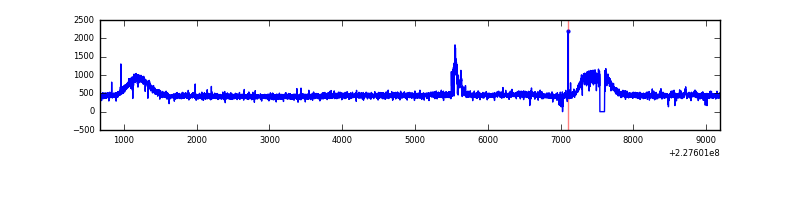 |
| D | 8520 | 8455 | 219 | 219 | 2.57% | 2.59% | 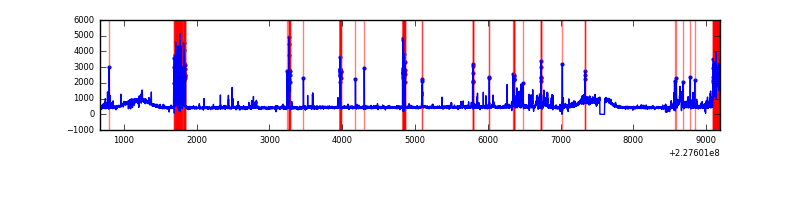 |
Top three noisy pixels from each quadrant. If the there are fewer than three noisy pixels in the level2.evt file, extra rows are filled as -1
| Pixel properties | Quadrant properties | ||||||
|---|---|---|---|---|---|---|---|
| Quadrant | DetID | PixID | Counts | Sigma | Mean | Median | Sigma |
| A | 0 | 254 | 11858 | 50.0 | 1043 | 1018 | 216.8 |
| A | 0 | 226 | 9749 | 40.27 | 1043 | 1018 | 216.8 |
| A | 12 | 194 | 9068 | 37.13 | 1043 | 1018 | 216.8 |
| B | 4 | 239 | 46890 | 221.56 | 1043 | 1011 | 207.1 |
| B | 11 | 51 | 33201 | 155.45 | 1043 | 1011 | 207.1 |
| B | 12 | 111 | 23610 | 109.14 | 1043 | 1011 | 207.1 |
| C | 9 | 68 | 84005 | 343.82 | 1023 | 1024 | 241.3 |
| C | 1 | 16 | 24925 | 99.03 | 1023 | 1024 | 241.3 |
| C | 13 | 61 | 7868 | 28.36 | 1023 | 1024 | 241.3 |
| D | 1 | 52 | 540324 | 2184.06 | 1006 | 972 | 246.9 |
| D | 4 | 95 | 270254 | 1090.43 | 1006 | 972 | 246.9 |
| D | 2 | 152 | 181747 | 732.03 | 1006 | 972 | 246.9 |
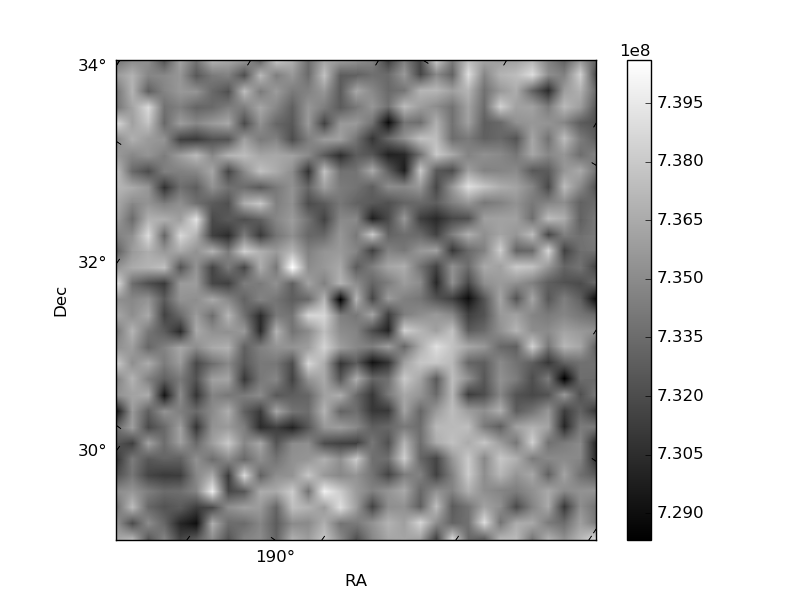
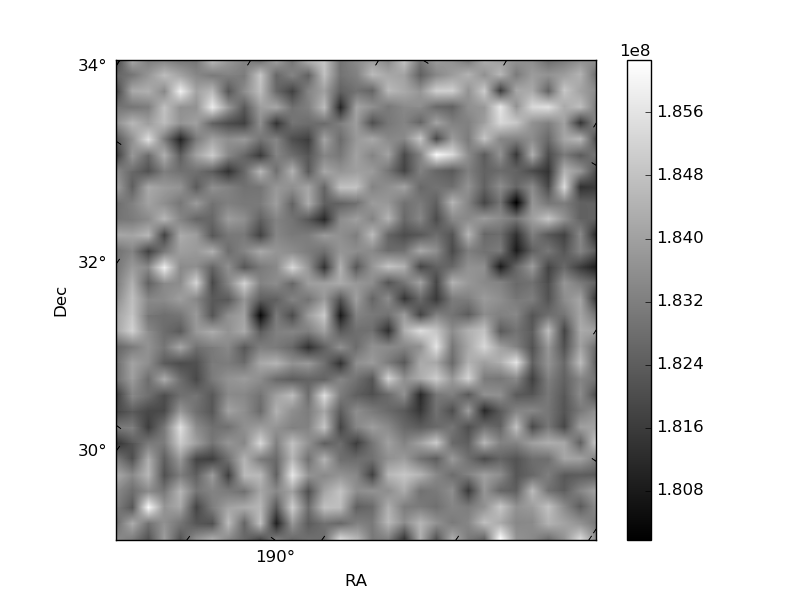
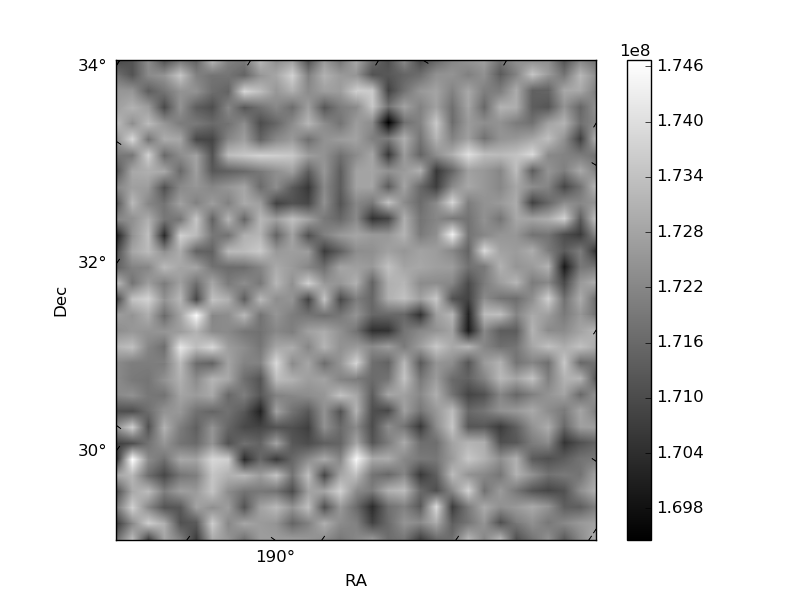
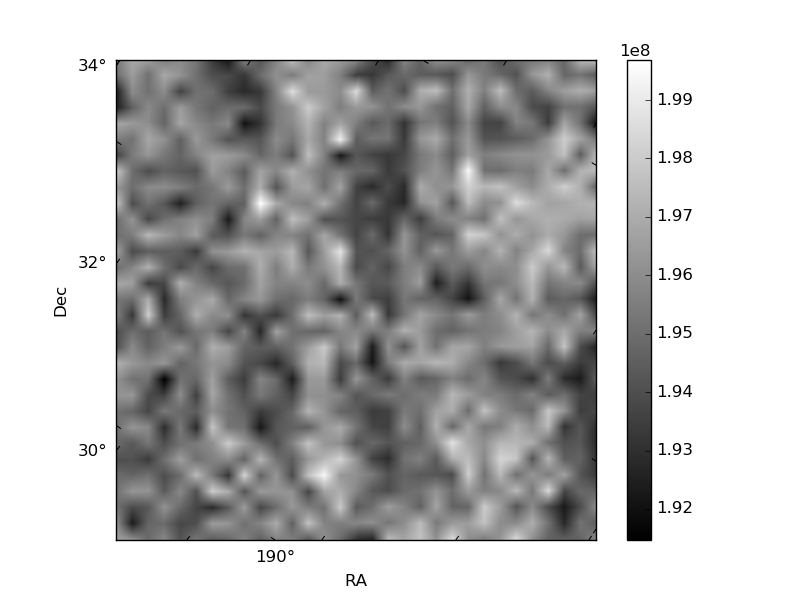
Histogram calculated using DETX and DETY for each event in the final _common_clean file
| Quadrant A | 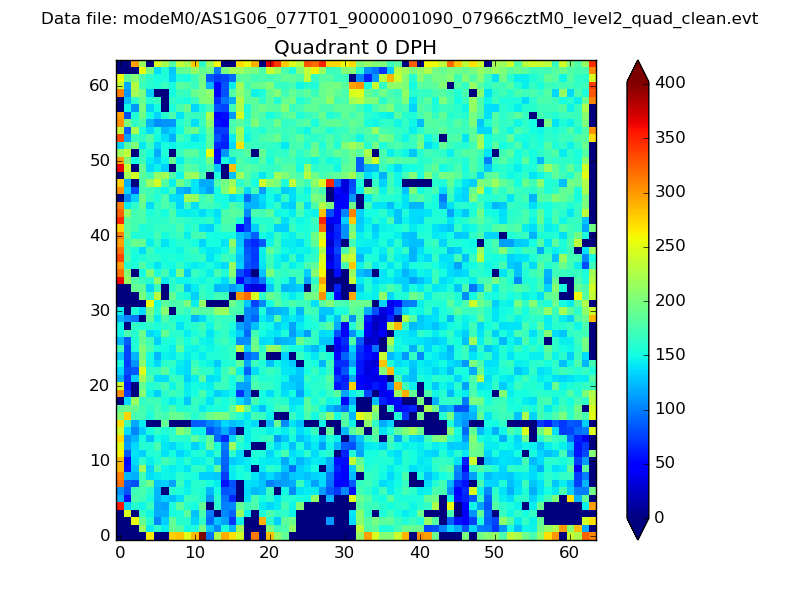 |
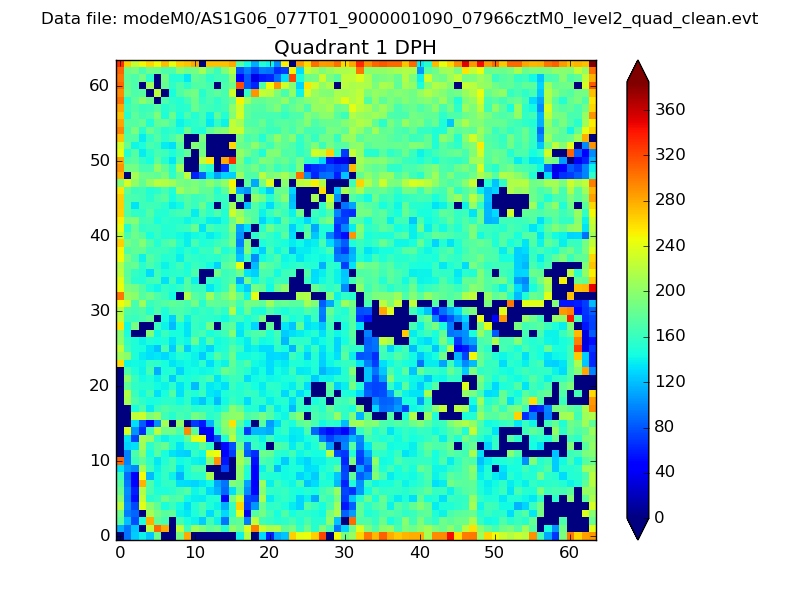 |
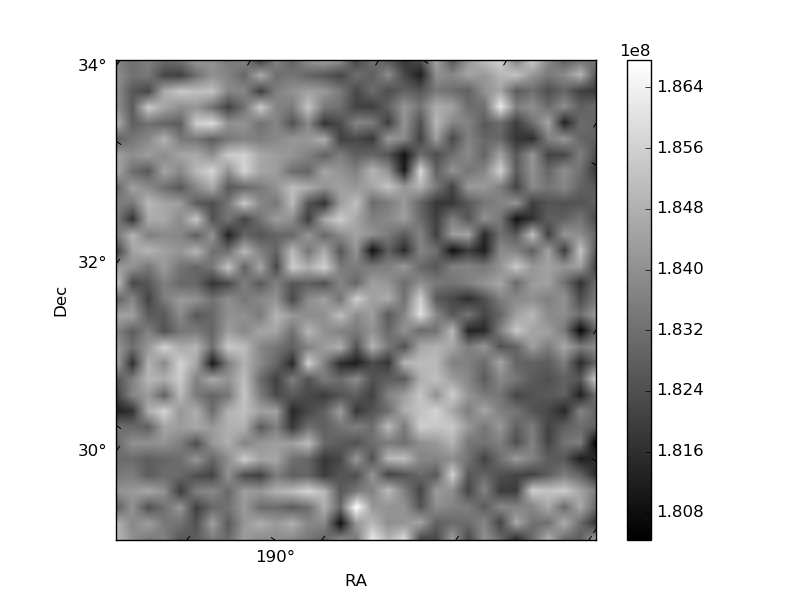
Quadrant B |
|---|---|---|---|
| Quadrant D | 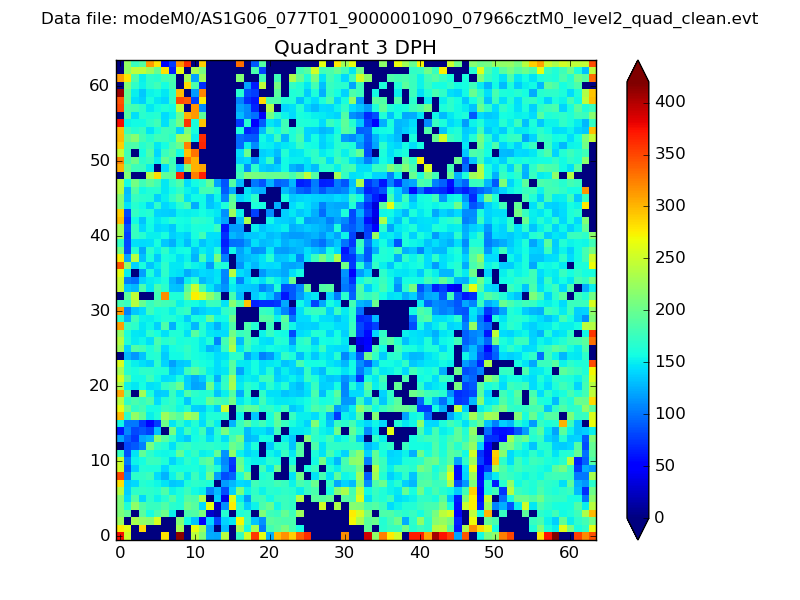 |
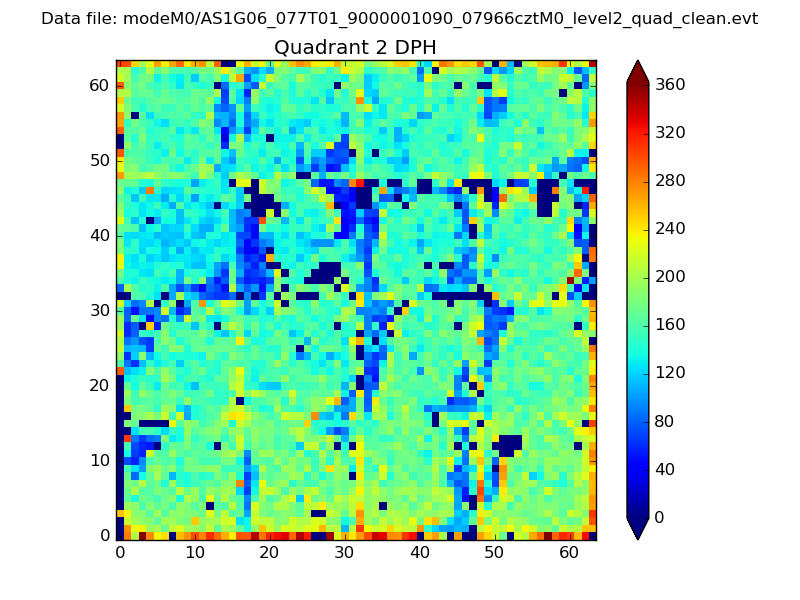 |
Quadrant C |
| Plot type | Count rate plots | Images |
|---|---|---|
| Comparison with Poisson distribution Blue bars denote a histogram of data divided into 1 sec bins. Red curve is a Poisson curve with rate = median count rate of data. |
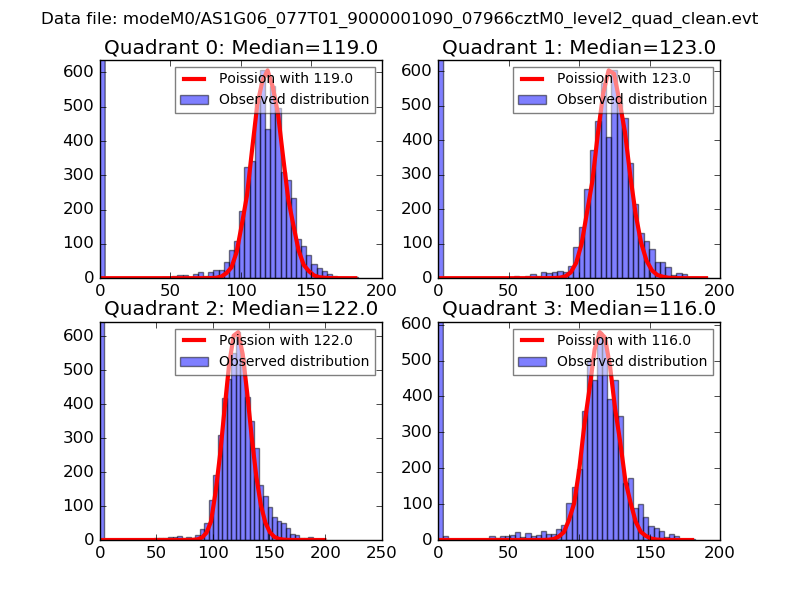 |
 |
| Quadrant-wise count rates Data is divided into 100 sec bins |
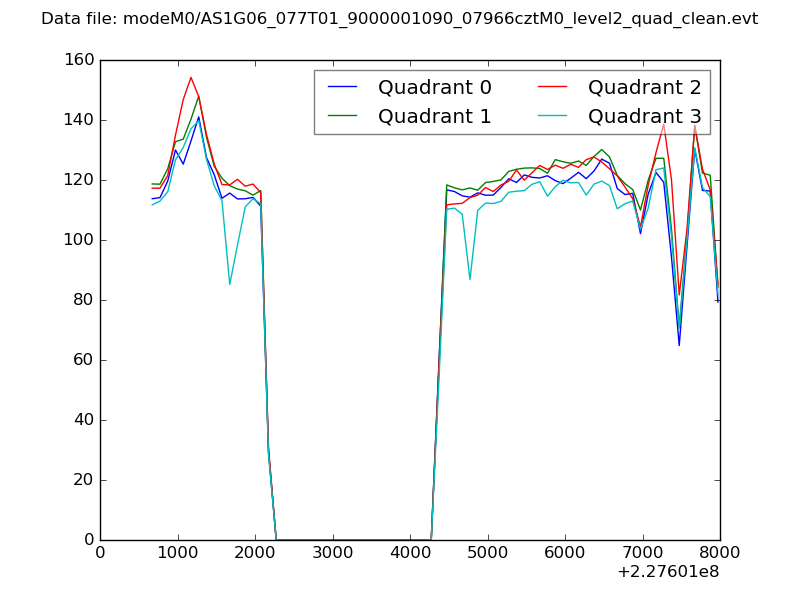 |
|
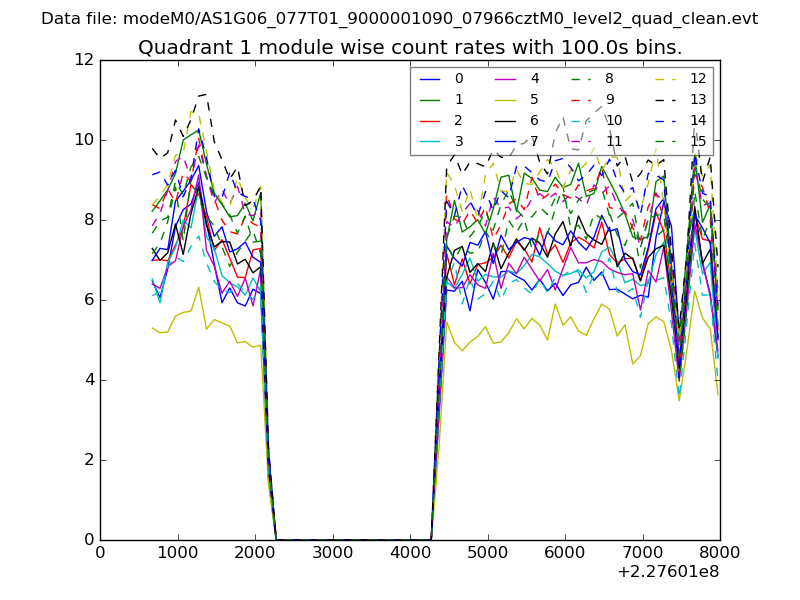
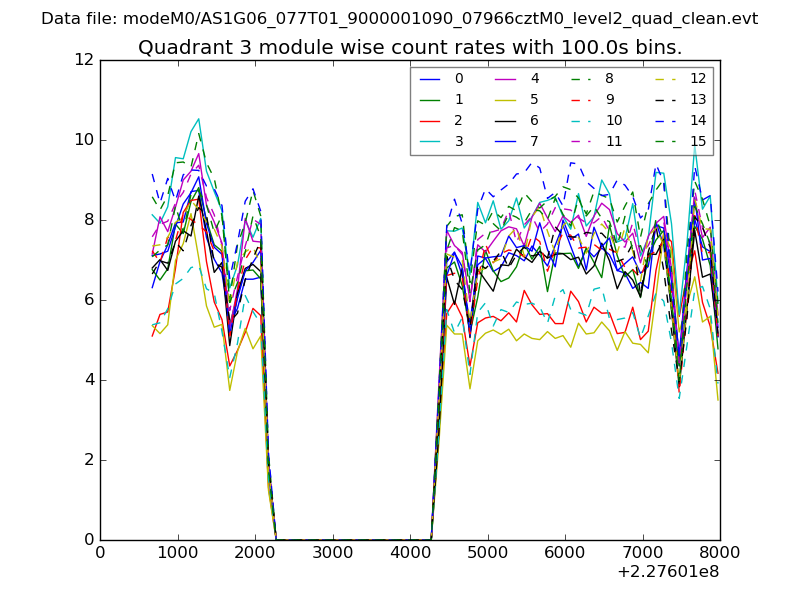
| Module-wise count rates for Quadrant A Data is divided into 100 sec bins |
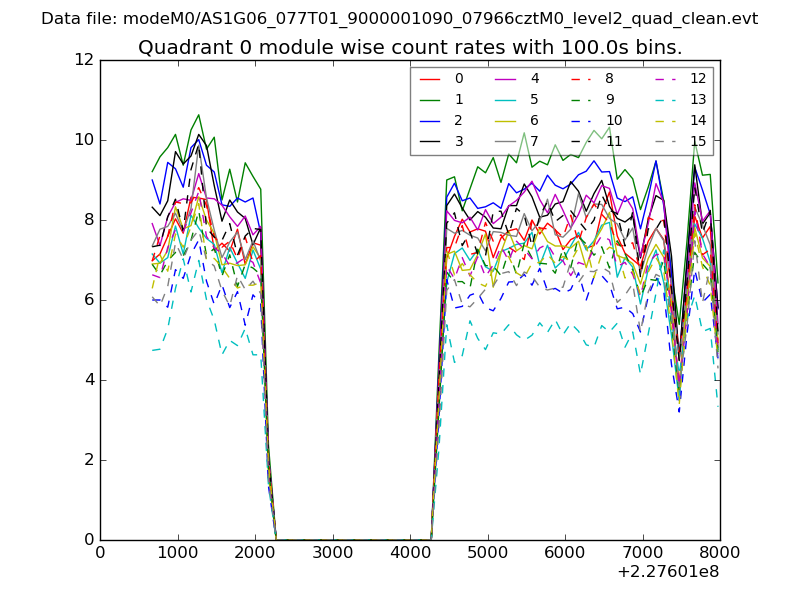 |
 |
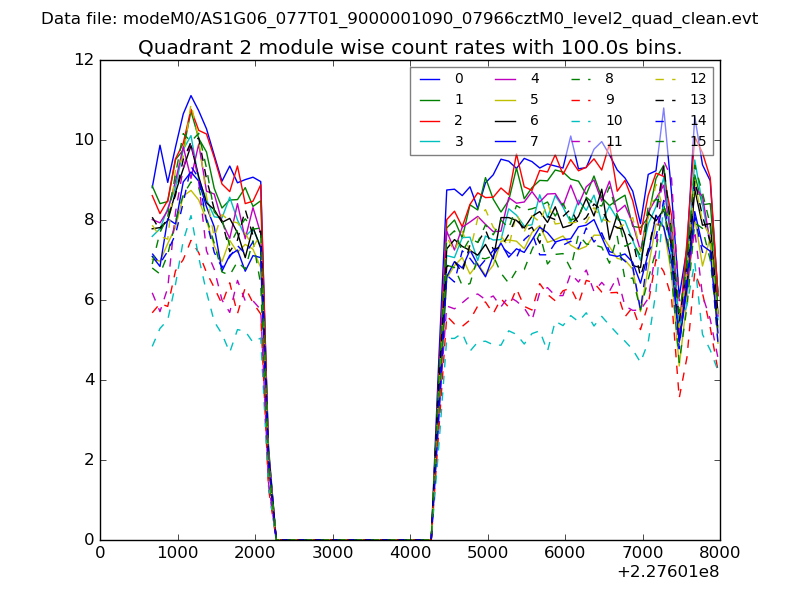
| Module-wise count rates for Quadrant B Data is divided into 100 sec bins |
 |
 |
| Module-wise count rates for Quadrant C Data is divided into 100 sec bins |
 |
 |
| Module-wise count rates for Quadrant D Data is divided into 100 sec bins |
 |
 |
| Parameter | Plot |
|---|---|
| CZT HV Monitor | 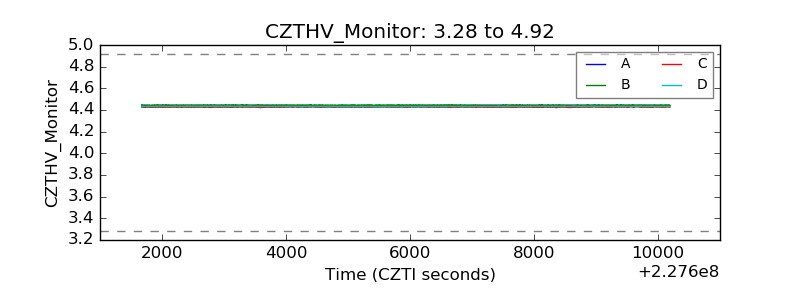 |
| D_VDD | 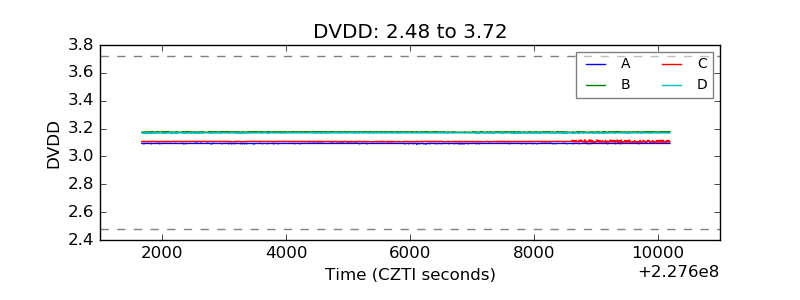 |
| Temperature 1 | 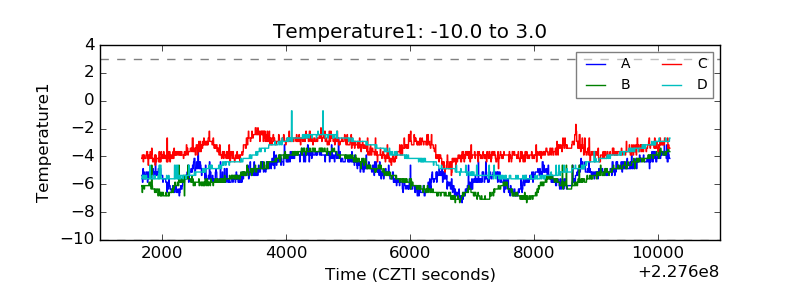 |
| Veto HV Monitor | 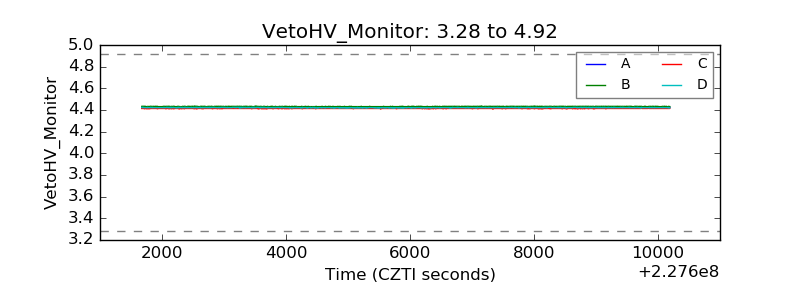 |
| Veto LLD | 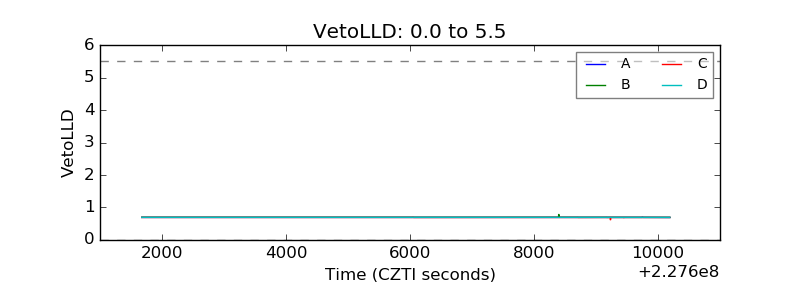 |
| Alpha Counter | 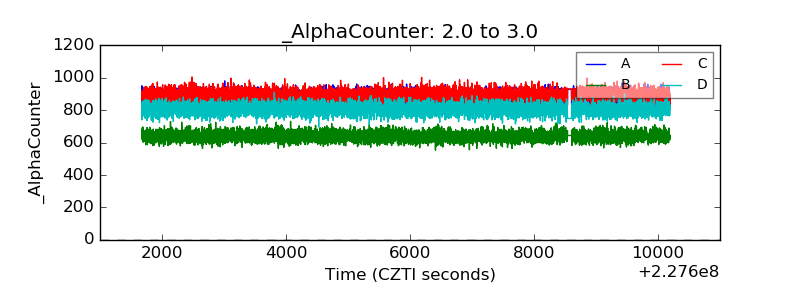 |
| _CPM_Rate | 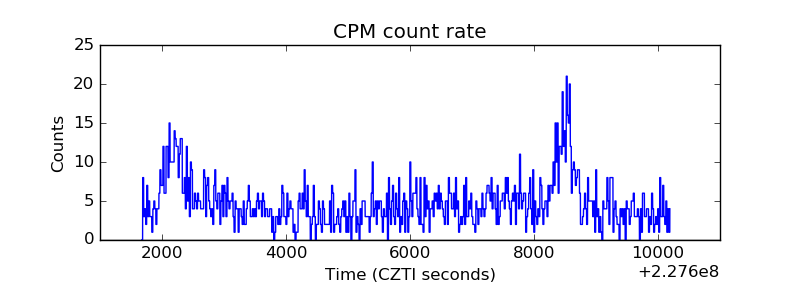 |
| CZT Counter | 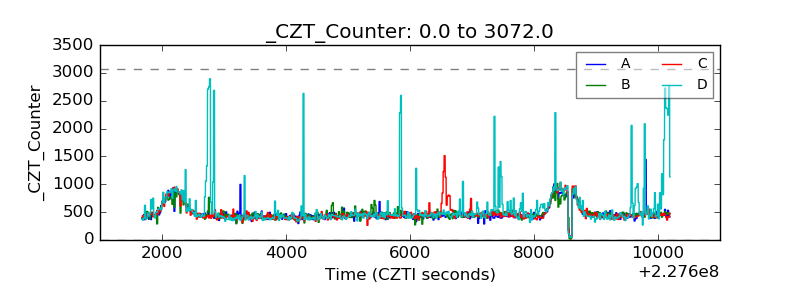 |
| +2.5 Volts monitor |  |
| +5 Volts monitor |  |
| _ROLL_ROT | 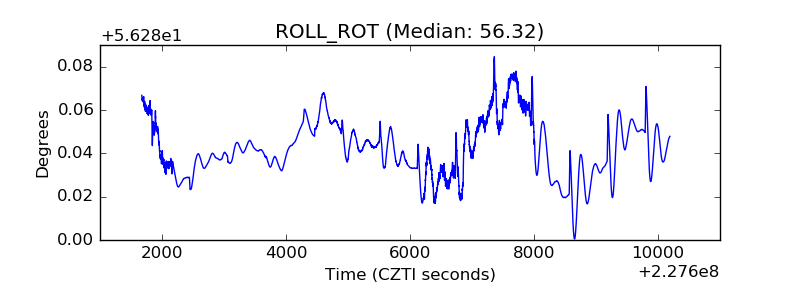 |
| _Roll_DEC | 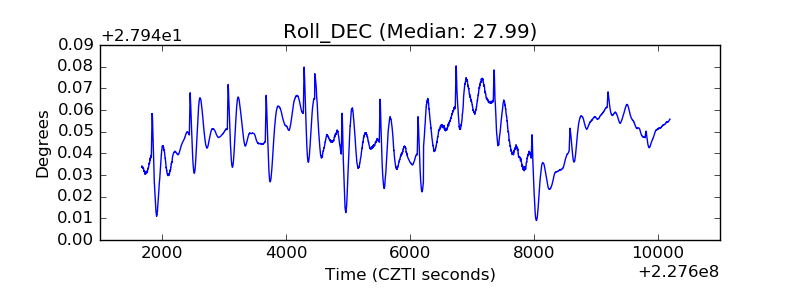 |
| _Roll_RA | 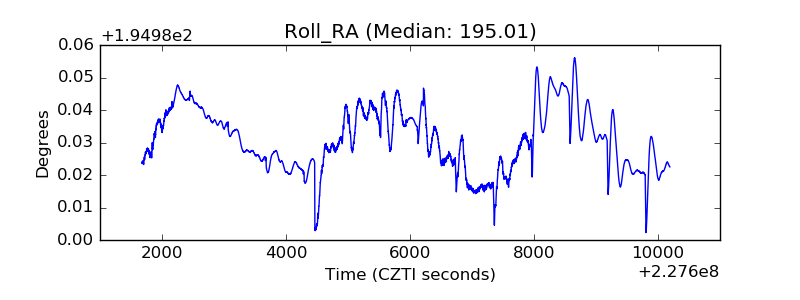 |
| Veto Counter | 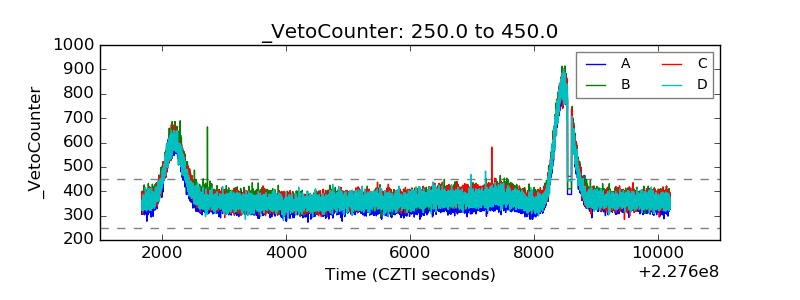 |