| Param | Original file | Final file |
|---|---|---|
| Filename | modeM0/AS1G06_077T01_9000001090_07968cztM0_level2.evt | modeM0/AS1G06_077T01_9000001090_07968cztM0_level2_quad_clean.evt |
| Size (bytes) | 424,434,240 | 46,572,480 |
| Size | 404.8 MB | 44.4 MB |
| Events in quadrant A | 2,034,969 | 278,320 |
| Events in quadrant B | 2,064,538 | 285,698 |
| Events in quadrant C | 3,695,643 | 260,566 |
| Events in quadrant D | 4,745,510 | 261,468 |
| Mode SS | |||
|---|---|---|---|
| Quadrant | BADHDUFLAG | Total packets | Discarded packets |
| A | 0 | 92 | 0 |
| B | 0 | 92 | 0 |
| C | 0 | 92 | 0 |
| D | 0 | 92 | 0 |
| Mode M0 | |||
|---|---|---|---|
| Quadrant | BADHDUFLAG | Total packets | Discarded packets |
| A | 0 | 9304 | 15 |
| B | 0 | 9300 | 15 |
| C | 0 | 14102 | 18 |
| D | 0 | 17388 | 52 |
| Quadrant | Total seconds | Saturated seconds | Saturation percentage |
|---|---|---|---|
| A | 4604 | 6 | 0.130321% |
| B | 4604 | 8 | 0.173762% |
| C | 4605 | 381 | 8.273616% |
| D | 4600 | 1081 | 23.500000% |
Noise dominated data is calculated using 1-second bins in cleaned event files. If a bin has >2000 counts, and if more than 50% of those come from <1% of pixels, then it is considered to be noise-dominated and hence unusable.
| Quadrant | # 1 sec bins | Bins with >0 counts | Bins with >2000 counts | High rate bins dominated by noise | Noise dominated (total time) | Noise dominated (detector-on time) | Marked lightcurve |
|---|---|---|---|---|---|---|---|
| A | 4611 | 4611 | 1 | 1 | 0.02% | 0.02% | 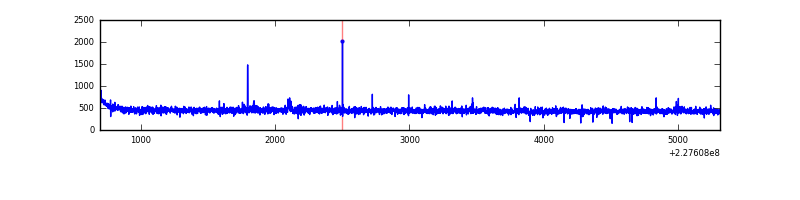 |
| B | 4611 | 4611 | 2 | 2 | 0.04% | 0.04% | 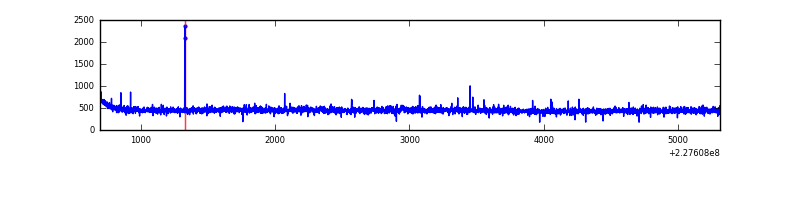 |
| C | 4611 | 4611 | 286 | 286 | 6.20% | 6.20% | 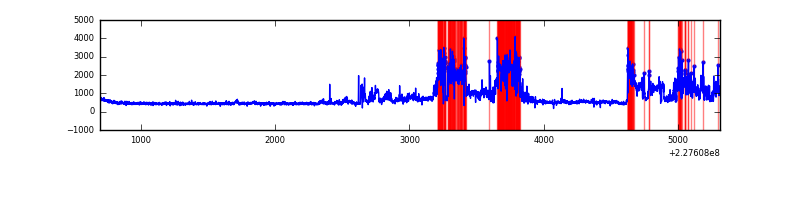 |
| D | 4611 | 4611 | 955 | 955 | 20.71% | 20.71% | 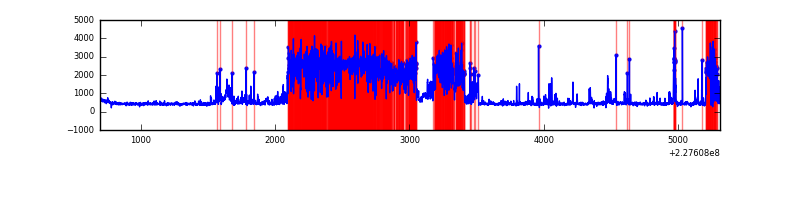 |
Top three noisy pixels from each quadrant. If the there are fewer than three noisy pixels in the level2.evt file, extra rows are filled as -1
| Pixel properties | Quadrant properties | ||||||
|---|---|---|---|---|---|---|---|
| Quadrant | DetID | PixID | Counts | Sigma | Mean | Median | Sigma |
| A | 0 | 254 | 11124 | 97.67 | 524 | 512 | 108.6 |
| A | 0 | 226 | 4826 | 39.71 | 524 | 512 | 108.6 |
| A | 13 | 251 | 4407 | 35.85 | 524 | 512 | 108.6 |
| B | 5 | 255 | 13141 | 122.58 | 525 | 513 | 103.0 |
| B | 12 | 111 | 11289 | 104.6 | 525 | 513 | 103.0 |
| B | 11 | 111 | 9235 | 84.66 | 525 | 513 | 103.0 |
| C | 9 | 68 | 1739172 | 14991.51 | 494 | 496 | 116.0 |
| C | 1 | 16 | 15498 | 129.35 | 494 | 496 | 116.0 |
| C | 8 | 128 | 6640 | 52.98 | 494 | 496 | 116.0 |
| D | 4 | 95 | 2672402 | 23541.28 | 458 | 444 | 113.5 |
| D | 1 | 52 | 254266 | 2236.3 | 458 | 444 | 113.5 |
| D | 2 | 14 | 67157 | 587.77 | 458 | 444 | 113.5 |
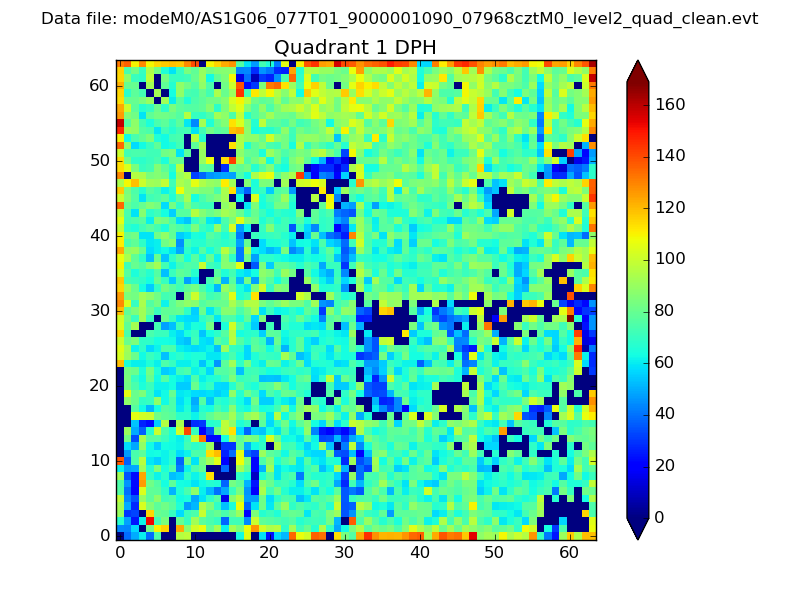
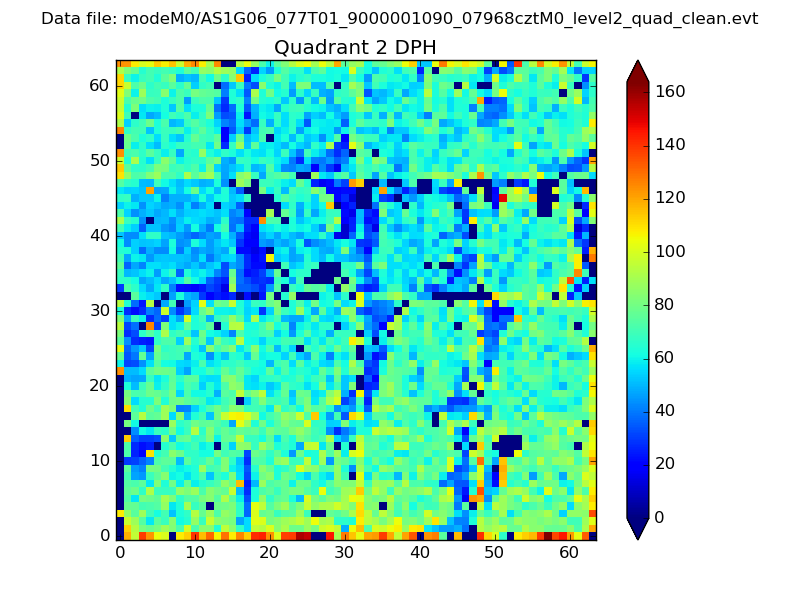
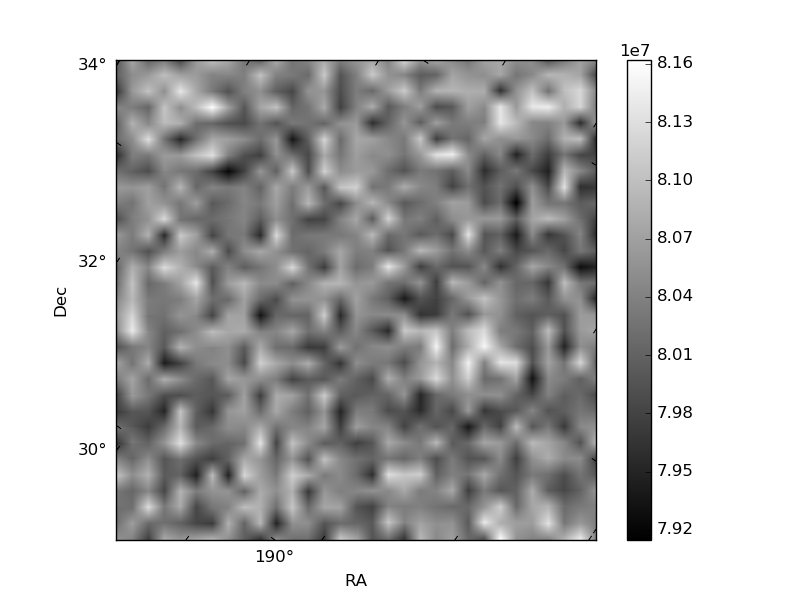
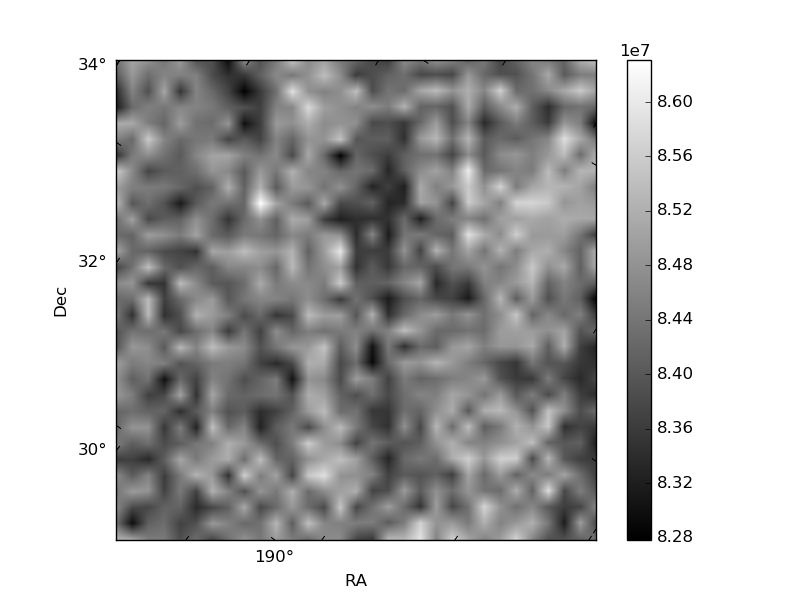
Histogram calculated using DETX and DETY for each event in the final _common_clean file
| Quadrant A |  |
 |
Quadrant B |
|---|---|---|---|
| Quadrant D |  |
 |
Quadrant C |
| Plot type | Count rate plots | Images |
|---|---|---|
| Comparison with Poisson distribution Blue bars denote a histogram of data divided into 1 sec bins. Red curve is a Poisson curve with rate = median count rate of data. |
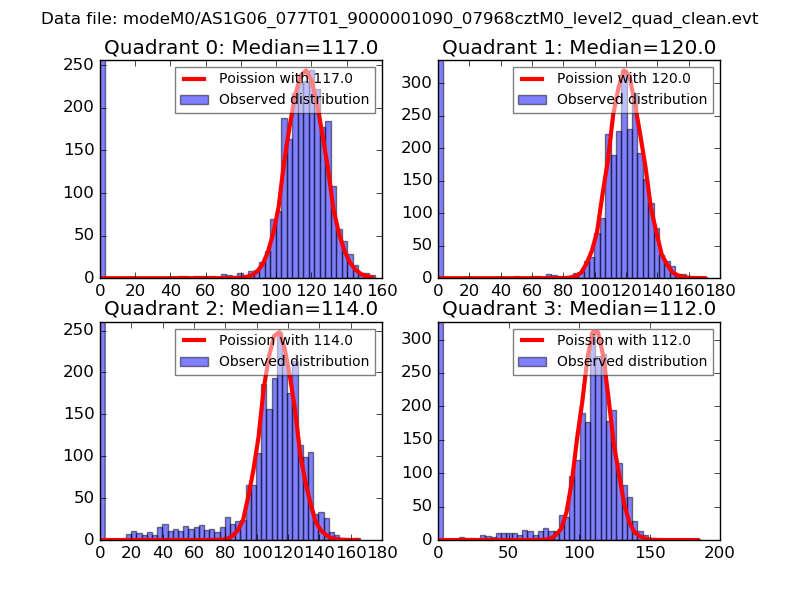 |
 |
| Quadrant-wise count rates Data is divided into 100 sec bins |
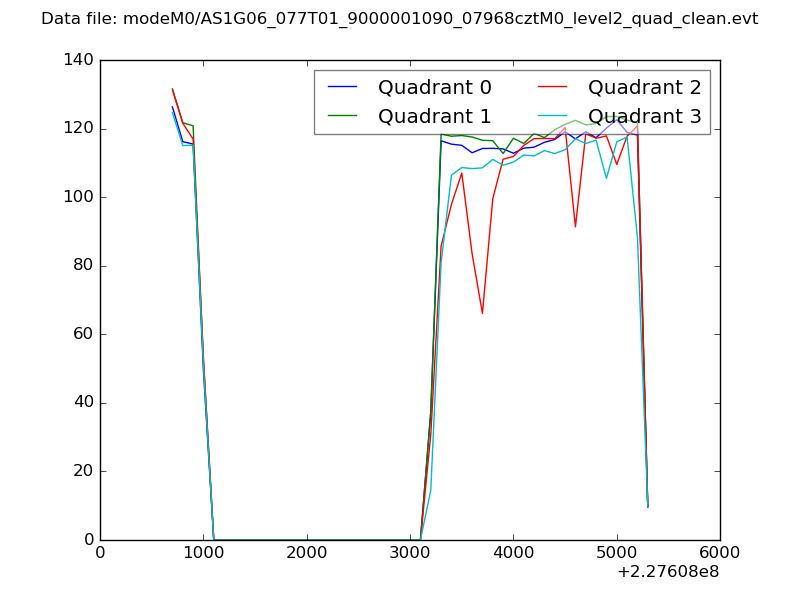 |
|
| Module-wise count rates for Quadrant A Data is divided into 100 sec bins |
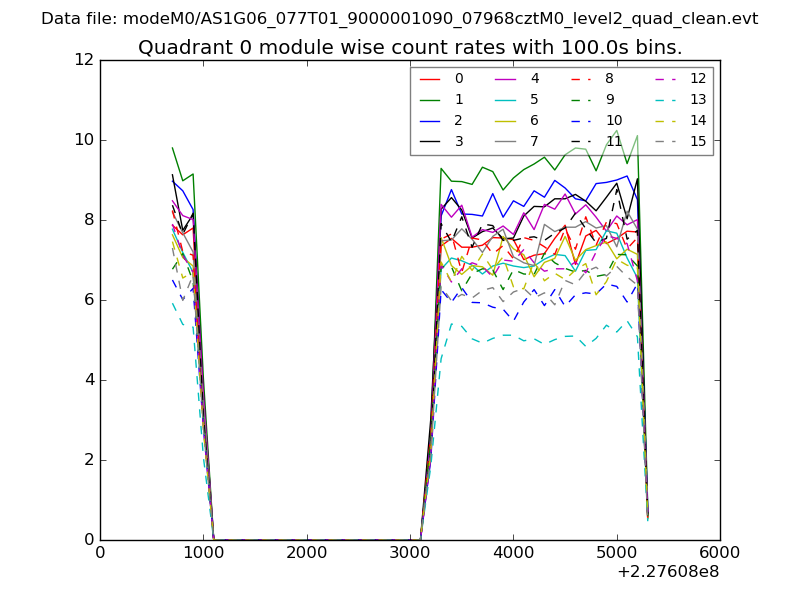 |
 |
| Module-wise count rates for Quadrant B Data is divided into 100 sec bins |
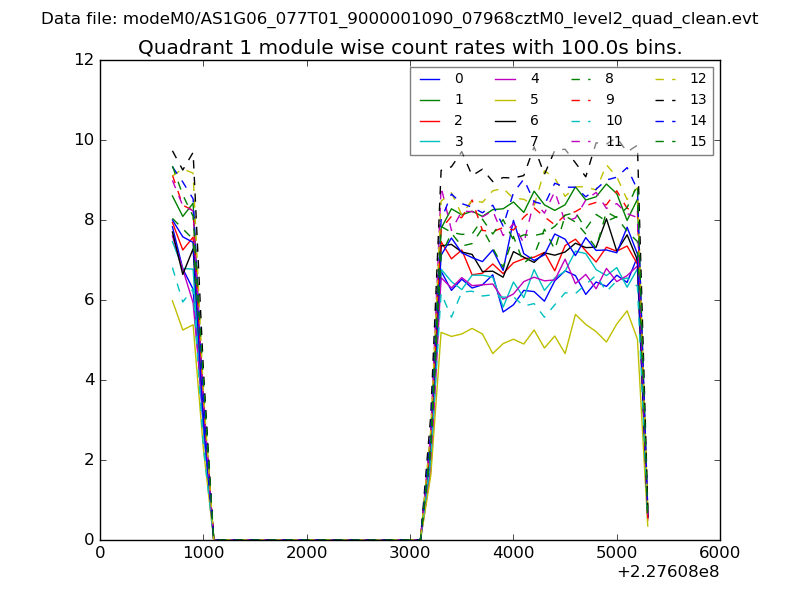 |
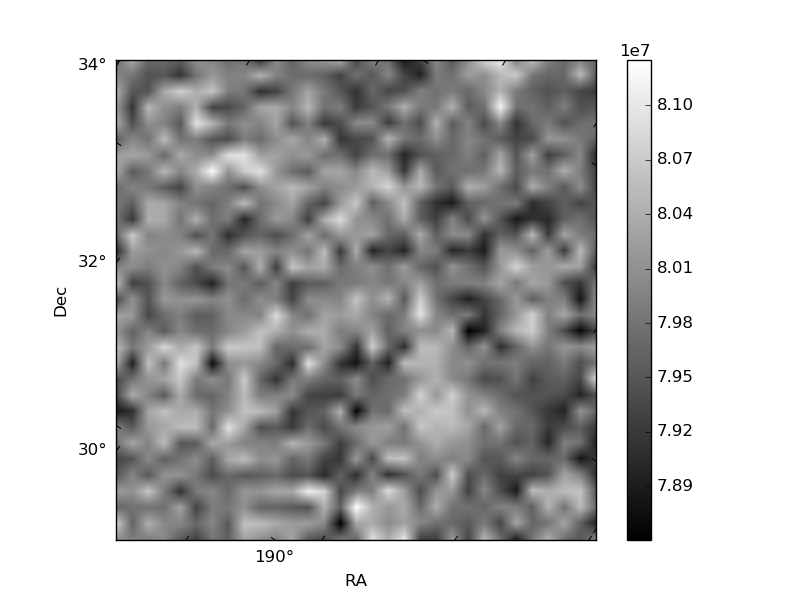 |
| Module-wise count rates for Quadrant C Data is divided into 100 sec bins |
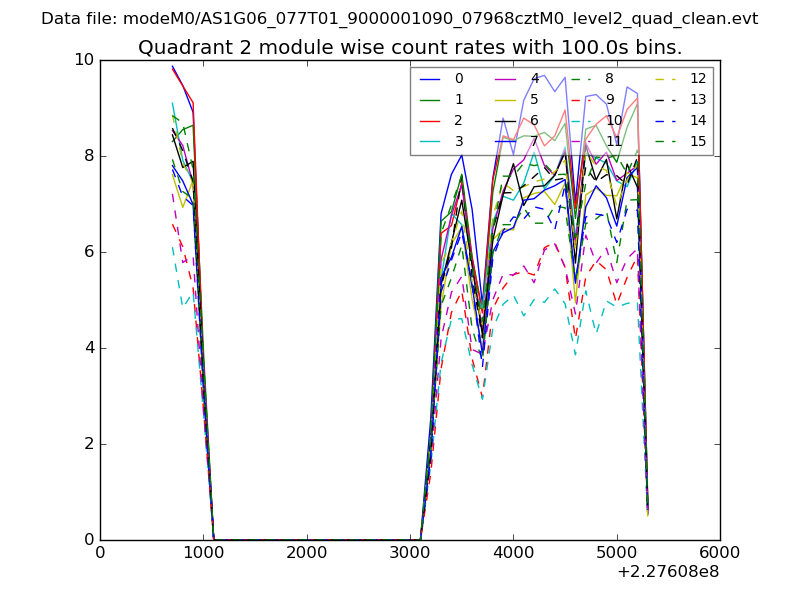 |
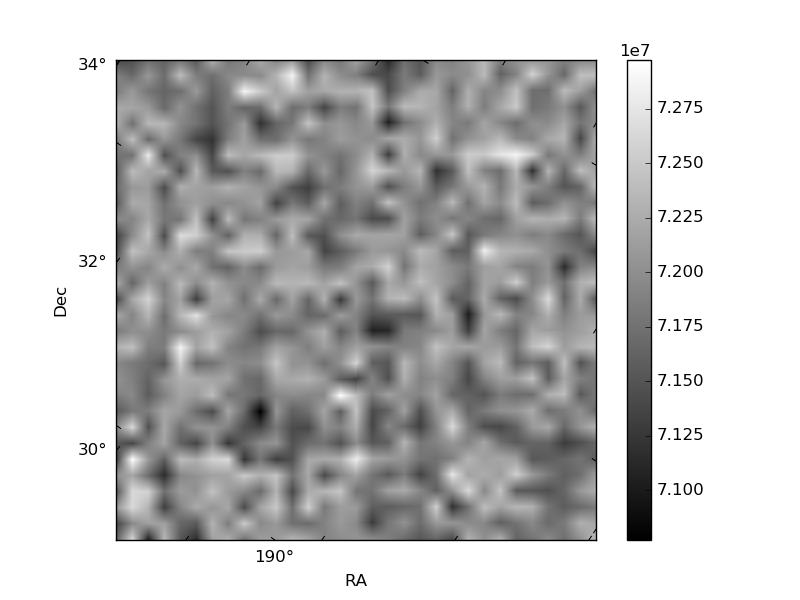 |
| Module-wise count rates for Quadrant D Data is divided into 100 sec bins |
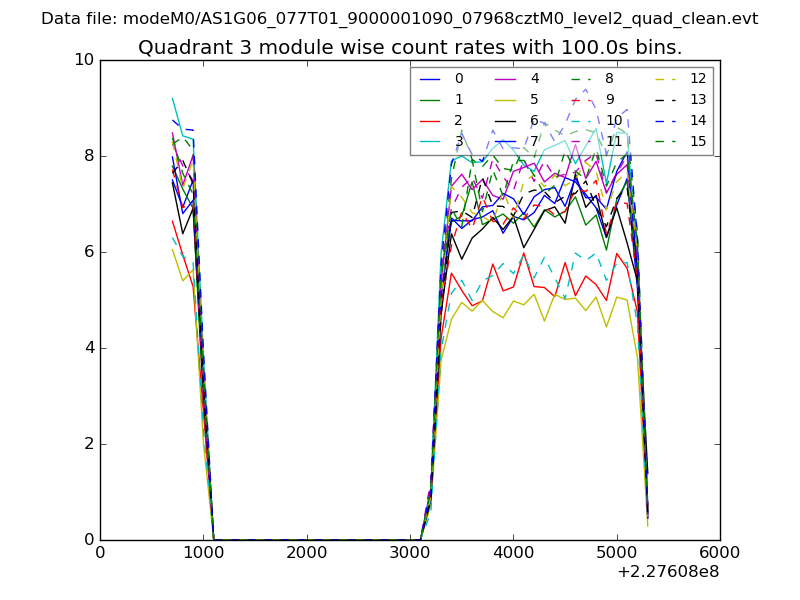 |
 |
| Parameter | Plot |
|---|---|
| CZT HV Monitor | 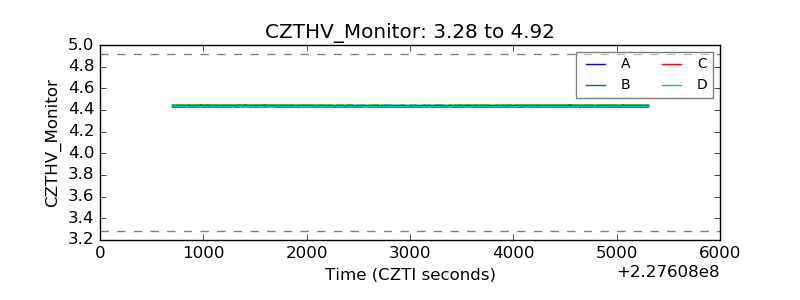 |
| D_VDD | 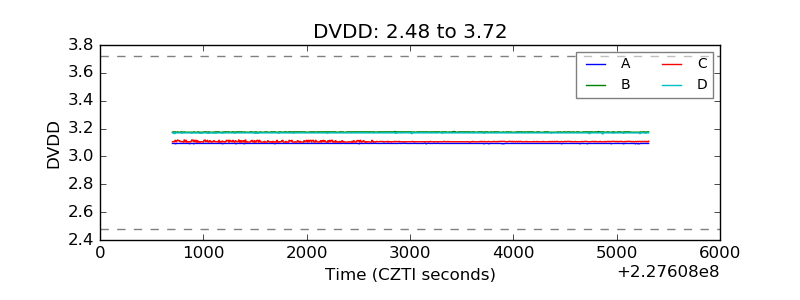 |
| Temperature 1 | 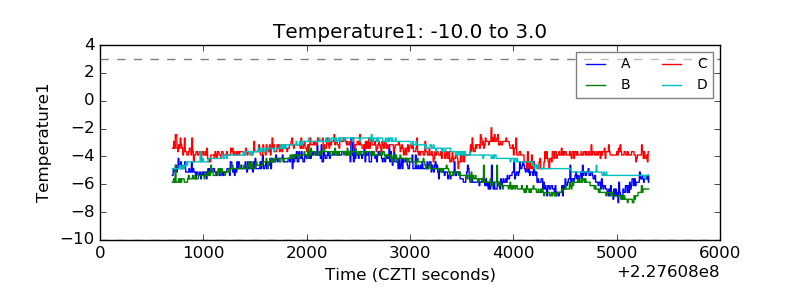 |
| Veto HV Monitor | 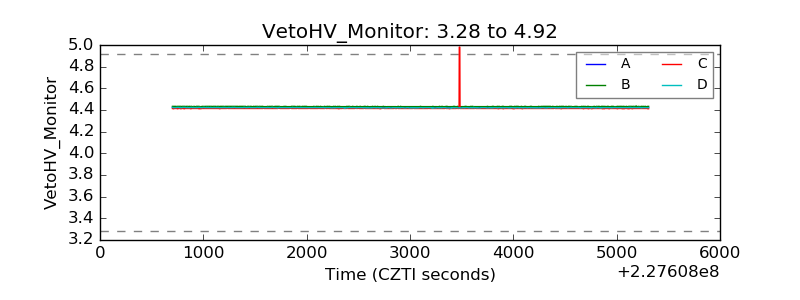 |
| Veto LLD | 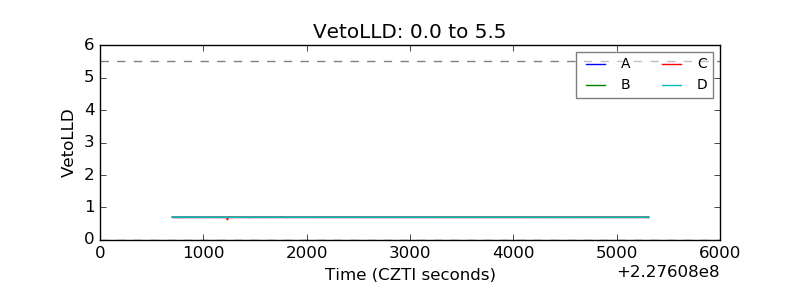 |
| Alpha Counter | 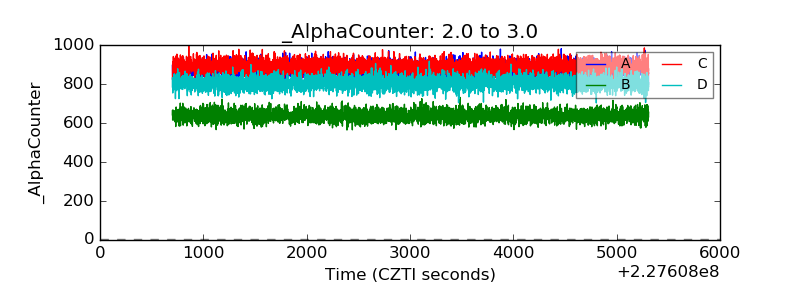 |
| _CPM_Rate | 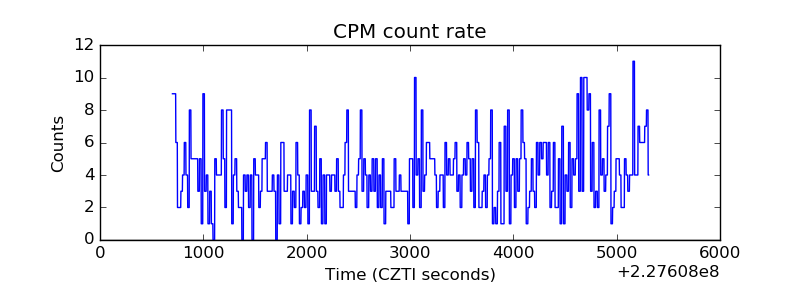 |
| CZT Counter | 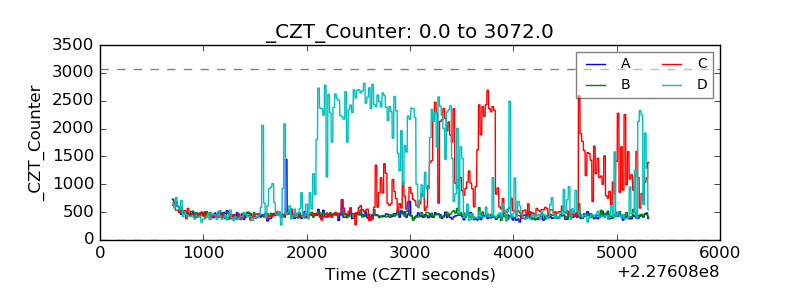 |
| +2.5 Volts monitor |  |
| +5 Volts monitor |  |
| _ROLL_ROT | 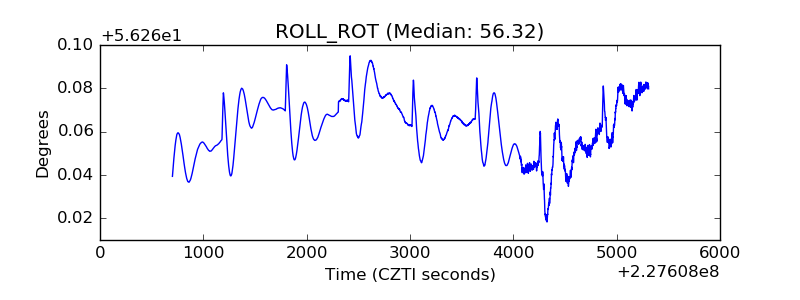 |
| _Roll_DEC | 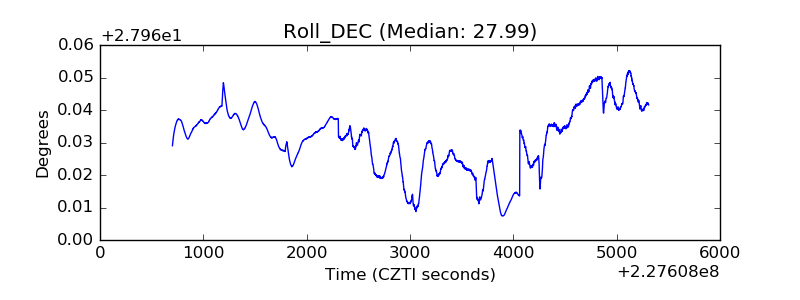 |
| _Roll_RA | 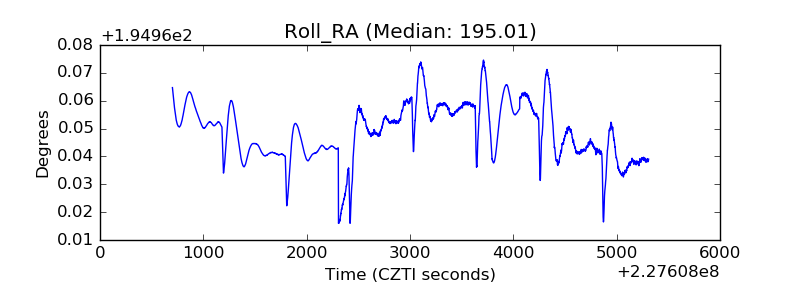 |
| Veto Counter | 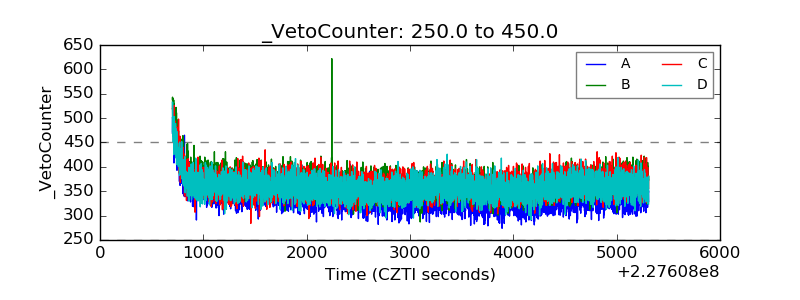 |