| Param | Original file | Final file |
|---|---|---|
| Filename | modeM0/AS1G06_077T01_9000001090_07969cztM0_level2.evt | modeM0/AS1G06_077T01_9000001090_07969cztM0_level2_quad_clean.evt |
| Size (bytes) | 1,192,942,080 | 176,676,480 |
| Size | 1.1 GB | 168.5 MB |
| Events in quadrant A | 6,732,008 | 1,098,280 |
| Events in quadrant B | 6,954,731 | 1,119,740 |
| Events in quadrant C | 13,250,492 | 1,075,355 |
| Events in quadrant D | 8,208,166 | 1,051,734 |
| Mode SS | |||
|---|---|---|---|
| Quadrant | BADHDUFLAG | Total packets | Discarded packets |
| A | 0 | 296 | 0 |
| B | 0 | 296 | 0 |
| C | 0 | 296 | 0 |
| D | 0 | 296 | 0 |
| Mode M0 | |||
|---|---|---|---|
| Quadrant | BADHDUFLAG | Total packets | Discarded packets |
| A | 0 | 29926 | 6 |
| B | 0 | 30251 | 11 |
| C | 0 | 49513 | 32 |
| D | 0 | 34656 | 7 |
| Mode M9 | |||
|---|---|---|---|
| Quadrant | BADHDUFLAG | Total packets | Discarded packets |
| A | 0 | 20 | 0 |
| B | 0 | 20 | 0 |
| C | 0 | 20 | 0 |
| D | 0 | 20 | 0 |
| Quadrant | Total seconds | Saturated seconds | Saturation percentage |
|---|---|---|---|
| A | 14571 | 247 | 1.695148% |
| B | 14568 | 305 | 2.093630% |
| C | 14564 | 746 | 5.122219% |
| D | 14570 | 584 | 4.008236% |
Noise dominated data is calculated using 1-second bins in cleaned event files. If a bin has >2000 counts, and if more than 50% of those come from <1% of pixels, then it is considered to be noise-dominated and hence unusable.
| Quadrant | # 1 sec bins | Bins with >0 counts | Bins with >2000 counts | High rate bins dominated by noise | Noise dominated (total time) | Noise dominated (detector-on time) | Marked lightcurve |
|---|---|---|---|---|---|---|---|
| A | 16508 | 14573 | 0 | 0 | 0.00% | 0.00% | 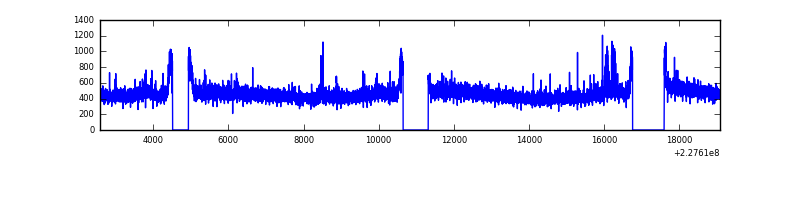 |
| B | 16508 | 14574 | 18 | 18 | 0.11% | 0.12% | 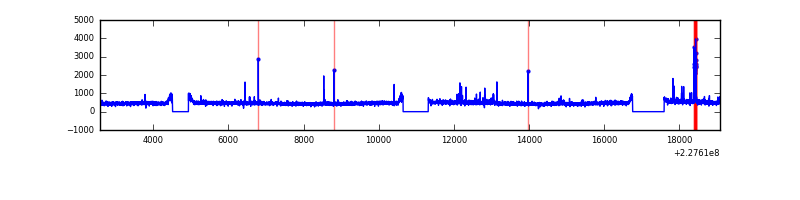 |
| C | 16508 | 14574 | 319 | 319 | 1.93% | 2.19% | 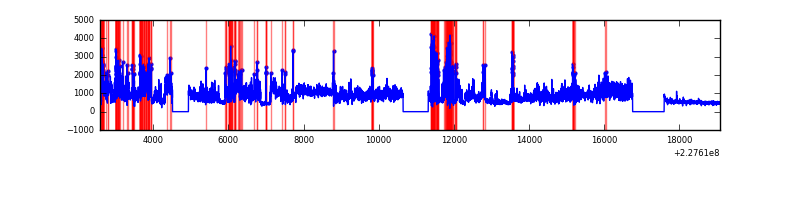 |
| D | 16508 | 14573 | 313 | 313 | 1.90% | 2.15% |  |
Top three noisy pixels from each quadrant. If the there are fewer than three noisy pixels in the level2.evt file, extra rows are filled as -1
| Pixel properties | Quadrant properties | ||||||
|---|---|---|---|---|---|---|---|
| Quadrant | DetID | PixID | Counts | Sigma | Mean | Median | Sigma |
| A | 0 | 128 | 38817 | 105.22 | 1728 | 1688 | 352.9 |
| A | 0 | 254 | 33491 | 90.13 | 1728 | 1688 | 352.9 |
| A | 0 | 226 | 15703 | 39.72 | 1728 | 1688 | 352.9 |
| B | 10 | 16 | 80132 | 233.42 | 1735 | 1692 | 336.0 |
| B | 11 | 51 | 55126 | 159.01 | 1735 | 1692 | 336.0 |
| B | 12 | 111 | 38349 | 109.08 | 1735 | 1692 | 336.0 |
| C | 9 | 68 | 6666455 | 17330.64 | 1659 | 1667 | 384.6 |
| C | 1 | 16 | 106746 | 273.24 | 1659 | 1667 | 384.6 |
| C | 13 | 61 | 12635 | 28.52 | 1659 | 1667 | 384.6 |
| D | 1 | 52 | 794672 | 1941.18 | 1669 | 1616 | 408.5 |
| D | 4 | 95 | 620132 | 1513.95 | 1669 | 1616 | 408.5 |
| D | 2 | 14 | 332450 | 809.79 | 1669 | 1616 | 408.5 |
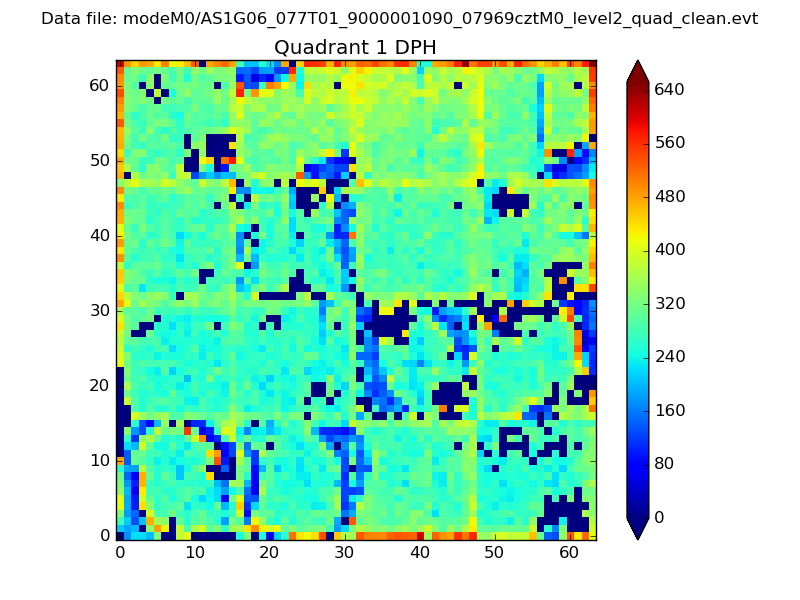
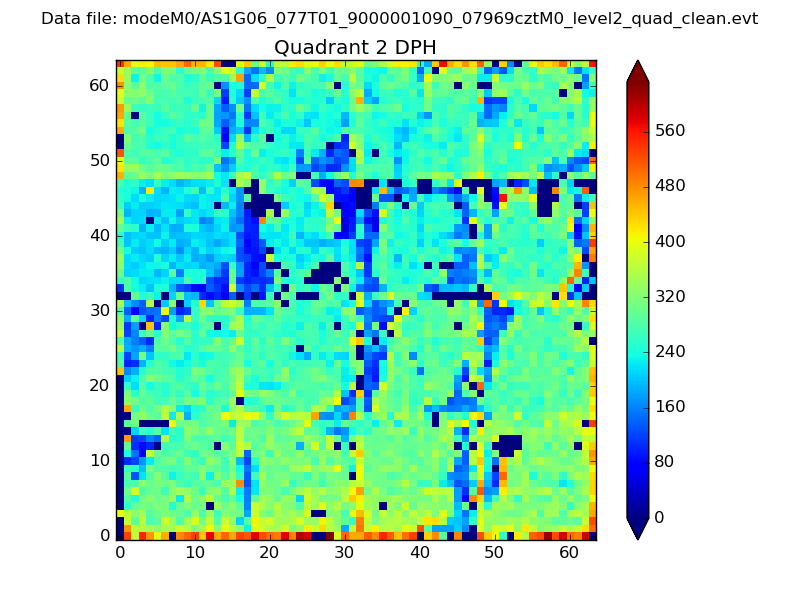
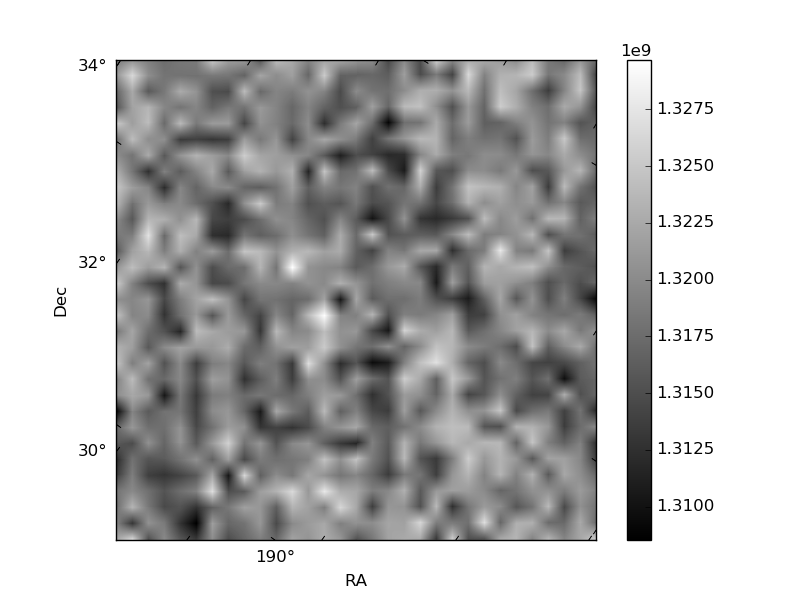
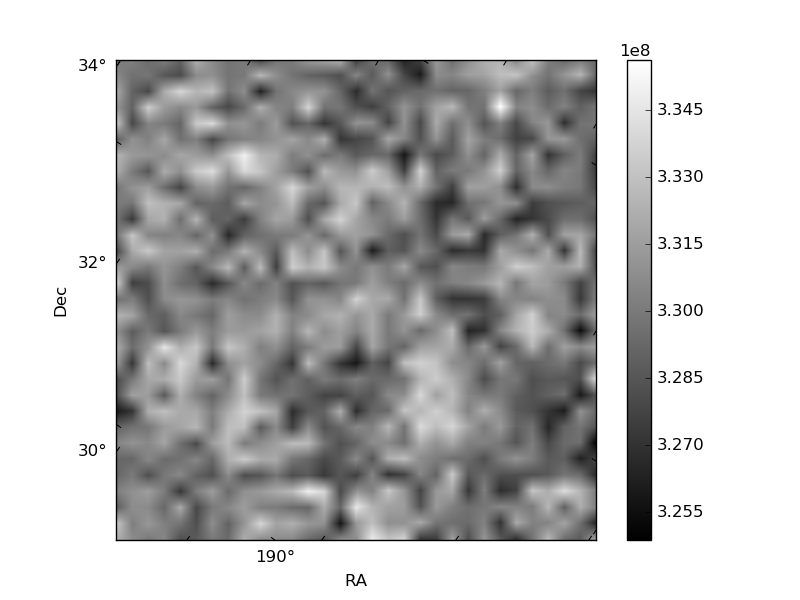
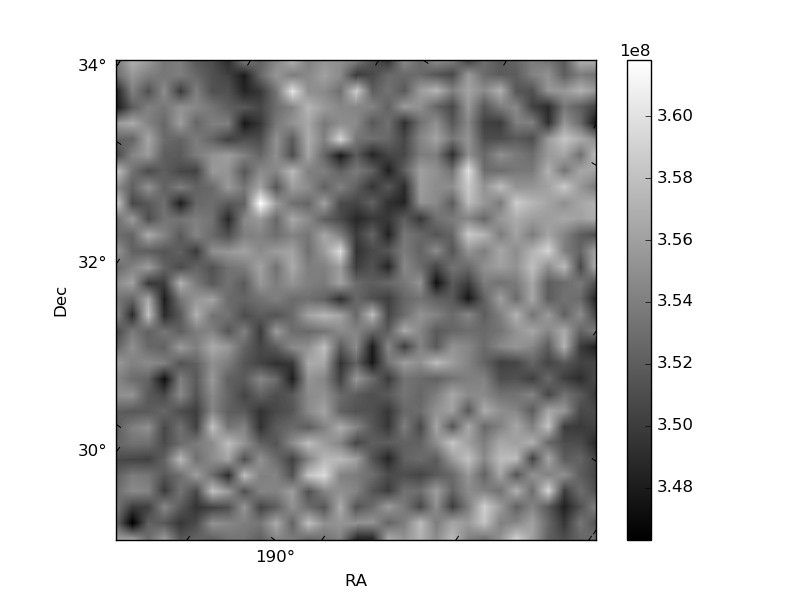
Histogram calculated using DETX and DETY for each event in the final _common_clean file
| Quadrant A | 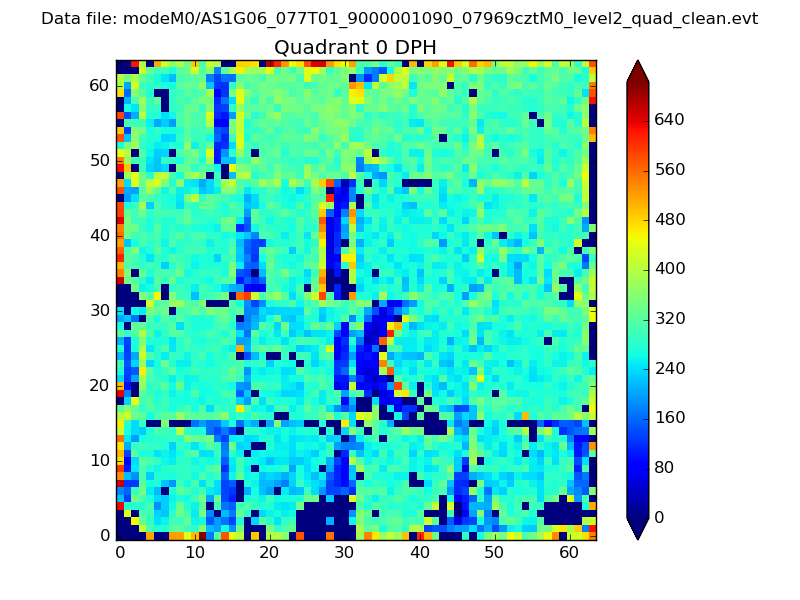 |
 |
Quadrant B |
|---|---|---|---|
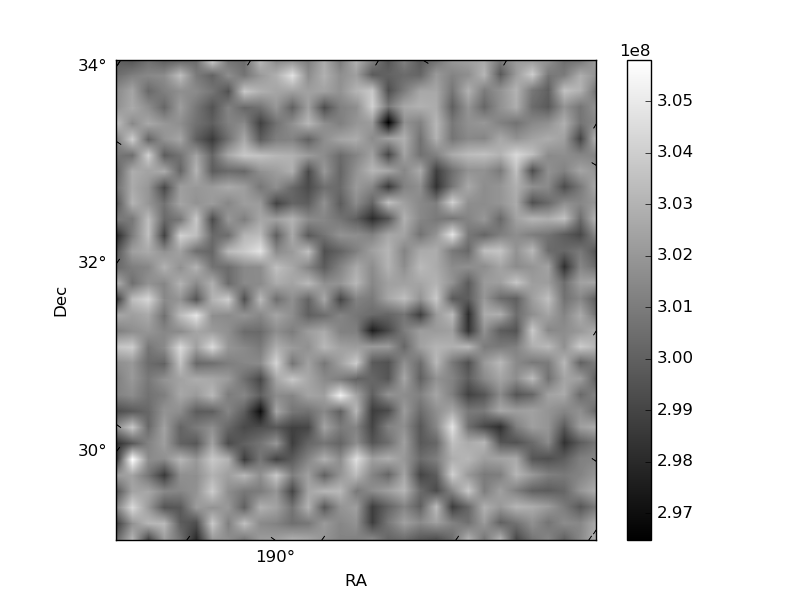
| Quadrant D | 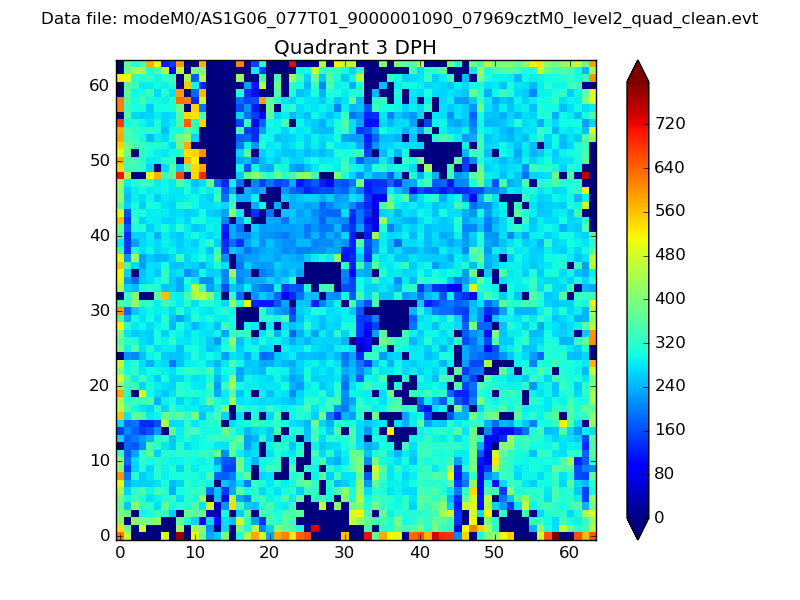 |
 |
Quadrant C |
| Plot type | Count rate plots | Images |
|---|---|---|
| Comparison with Poisson distribution Blue bars denote a histogram of data divided into 1 sec bins. Red curve is a Poisson curve with rate = median count rate of data. |
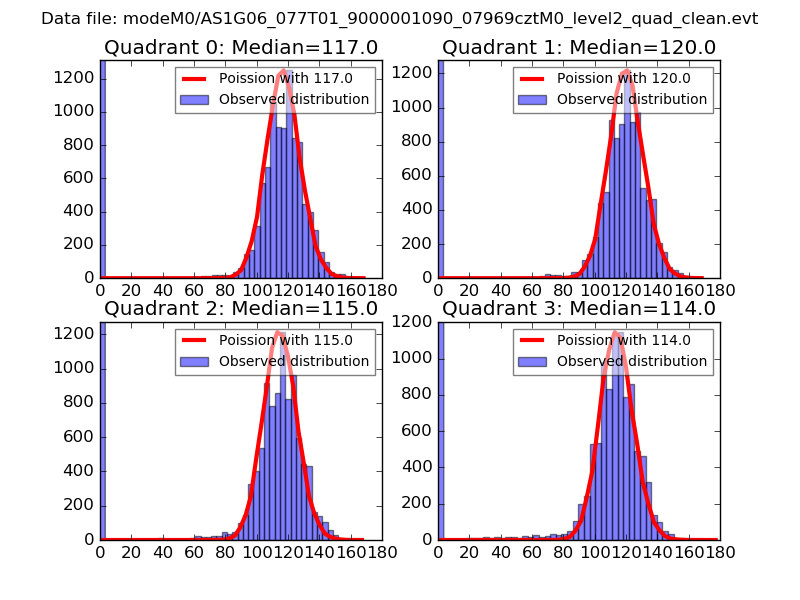 |
 |
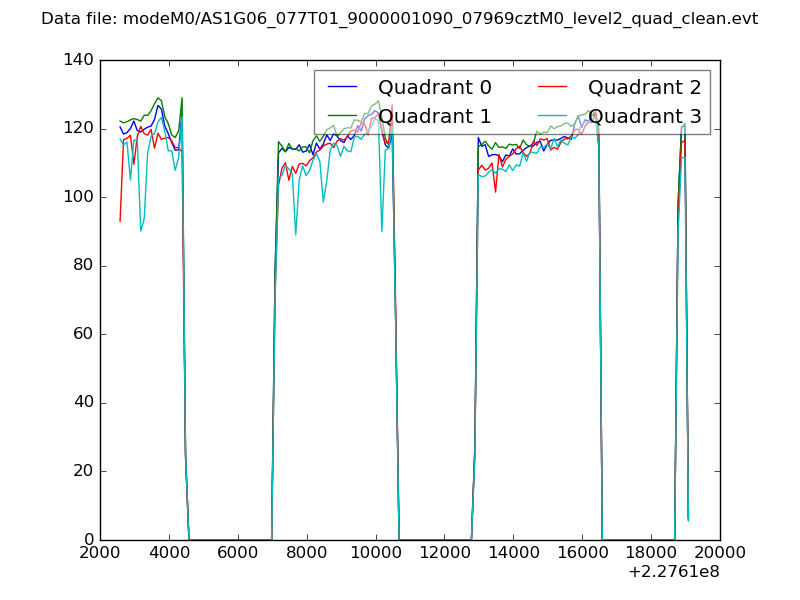
| Quadrant-wise count rates Data is divided into 100 sec bins |
 |
|
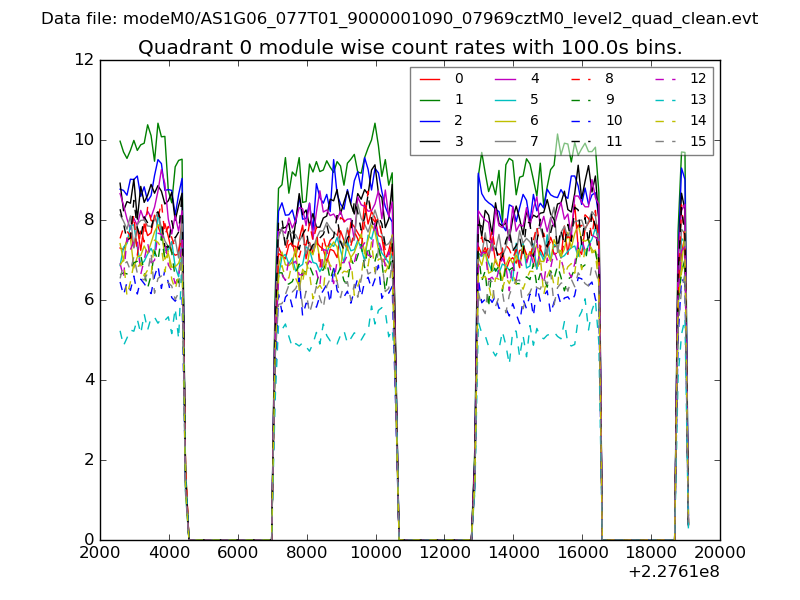
| Module-wise count rates for Quadrant A Data is divided into 100 sec bins |
 |
 |
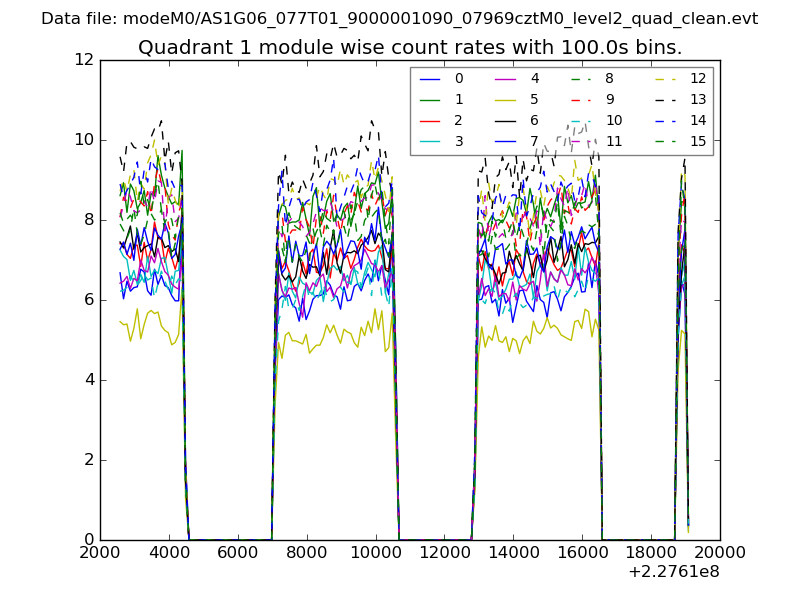
| Module-wise count rates for Quadrant B Data is divided into 100 sec bins |
 |
 |
| Module-wise count rates for Quadrant C Data is divided into 100 sec bins |
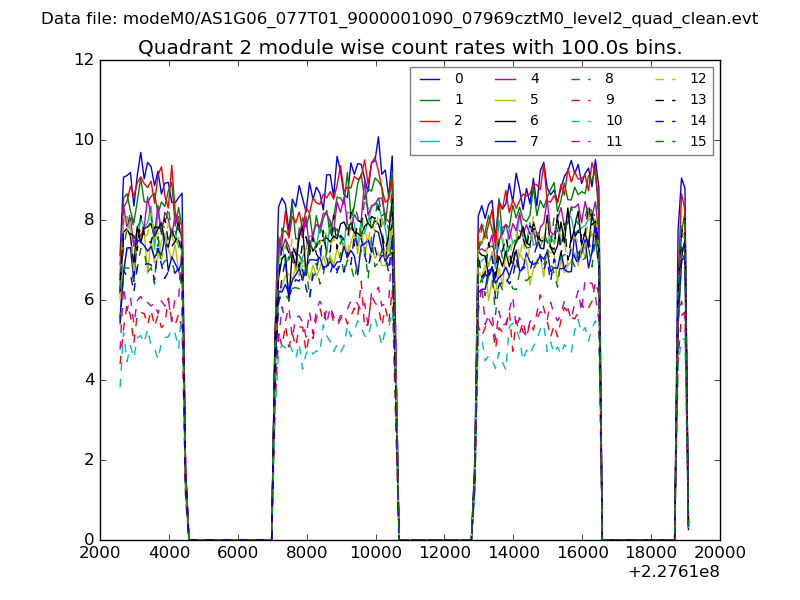 |
 |
| Module-wise count rates for Quadrant D Data is divided into 100 sec bins |
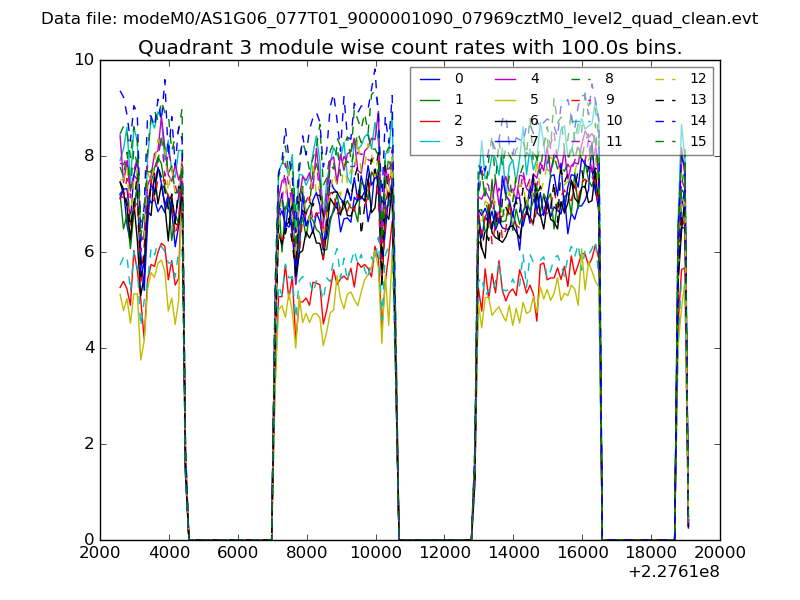 |
 |
| Parameter | Plot |
|---|---|
| CZT HV Monitor | 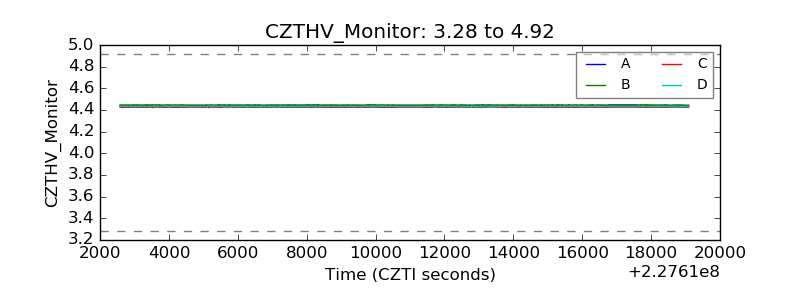 |
| D_VDD | 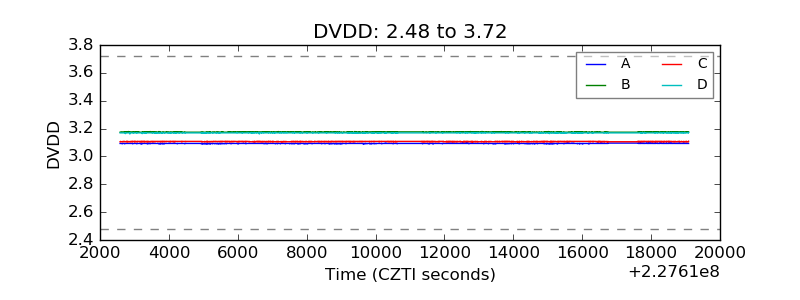 |
| Temperature 1 | 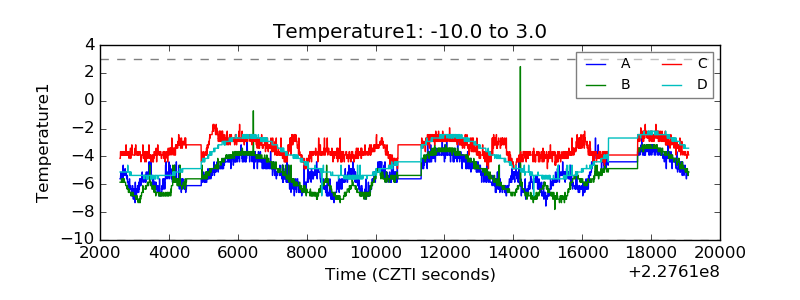 |
| Veto HV Monitor | 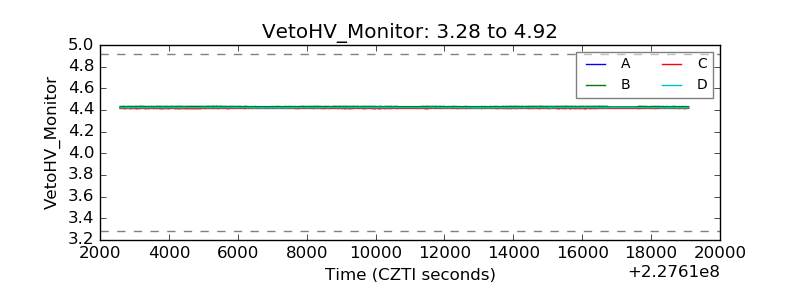 |
| Veto LLD | 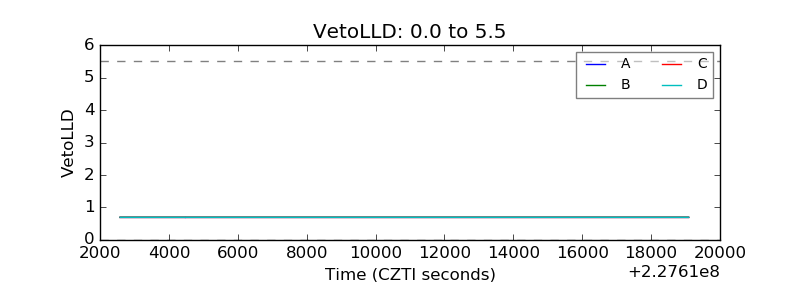 |
| Alpha Counter | 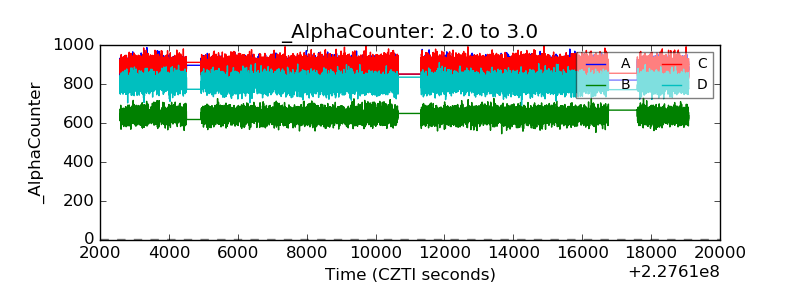 |
| _CPM_Rate | 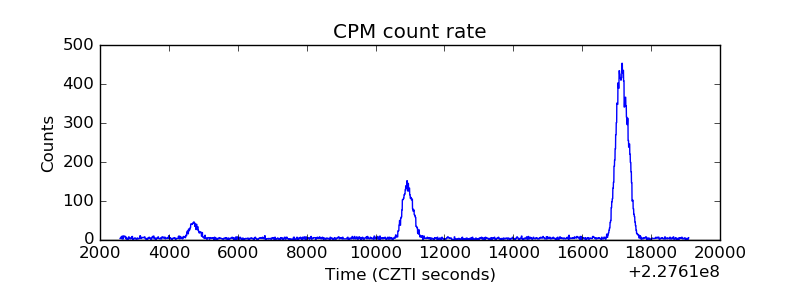 |
| CZT Counter | 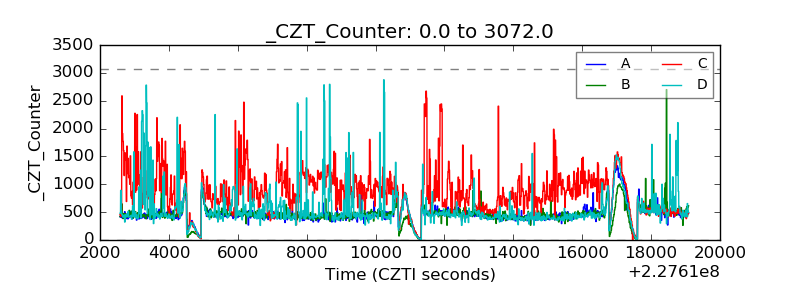 |
| +2.5 Volts monitor |  |
| +5 Volts monitor |  |
| _ROLL_ROT | 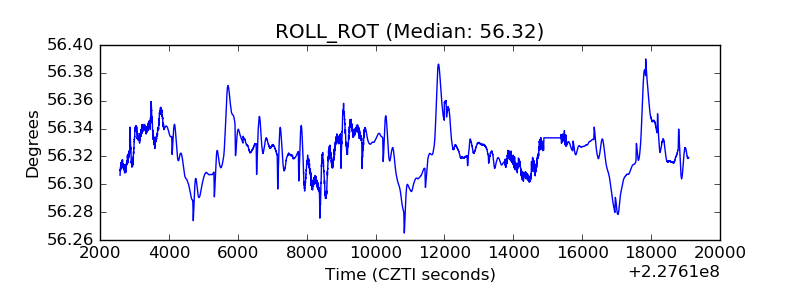 |
| _Roll_DEC |  |
| _Roll_RA | 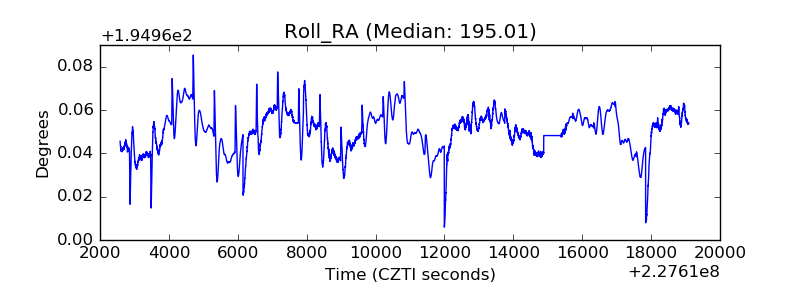 |
| Veto Counter | 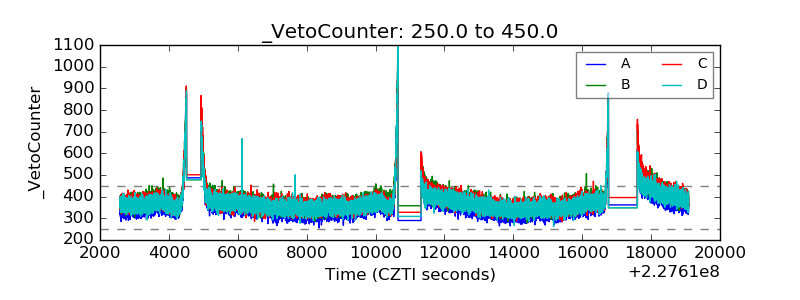 |