| Param | Original file | Final file |
|---|---|---|
| Filename | modeM0/AS1G06_077T01_9000001090_07970cztM0_level2.evt | modeM0/AS1G06_077T01_9000001090_07970cztM0_level2_quad_clean.evt |
| Size (bytes) | 500,817,600 | 85,034,880 |
| Size | 477.6 MB | 81.1 MB |
| Events in quadrant A | 3,462,972 | 521,395 |
| Events in quadrant B | 3,760,536 | 530,544 |
| Events in quadrant C | 3,686,510 | 528,275 |
| Events in quadrant D | 3,781,999 | 507,380 |
| Mode SS | |||
|---|---|---|---|
| Quadrant | BADHDUFLAG | Total packets | Discarded packets |
| A | 0 | 142 | 0 |
| B | 0 | 142 | 0 |
| C | 0 | 142 | 0 |
| D | 0 | 142 | 0 |
| Mode M0 | |||
|---|---|---|---|
| Quadrant | BADHDUFLAG | Total packets | Discarded packets |
| A | 0 | 14956 | 3 |
| B | 0 | 15845 | 2 |
| C | 0 | 15632 | 2 |
| D | 0 | 16212 | 2 |
| Mode M9 | |||
|---|---|---|---|
| Quadrant | BADHDUFLAG | Total packets | Discarded packets |
| A | 0 | 19 | 0 |
| B | 0 | 19 | 0 |
| C | 0 | 19 | 0 |
| D | 0 | 19 | 0 |
| Quadrant | Total seconds | Saturated seconds | Saturation percentage |
|---|---|---|---|
| A | 7004 | 133 | 1.898915% |
| B | 7004 | 163 | 2.327242% |
| C | 7004 | 118 | 1.684752% |
| D | 7004 | 231 | 3.298115% |
Noise dominated data is calculated using 1-second bins in cleaned event files. If a bin has >2000 counts, and if more than 50% of those come from <1% of pixels, then it is considered to be noise-dominated and hence unusable.
| Quadrant | # 1 sec bins | Bins with >0 counts | Bins with >2000 counts | High rate bins dominated by noise | Noise dominated (total time) | Noise dominated (detector-on time) | Marked lightcurve |
|---|---|---|---|---|---|---|---|
| A | 8860 | 7005 | 19 | 19 | 0.21% | 0.27% | 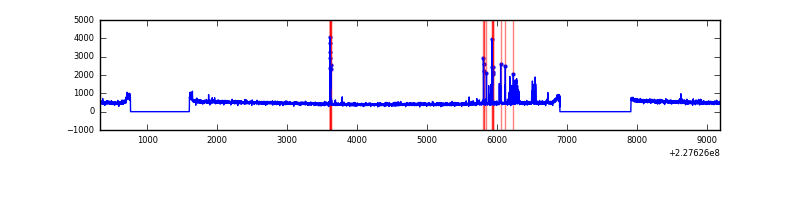 |
| B | 8860 | 7006 | 25 | 25 | 0.28% | 0.36% | 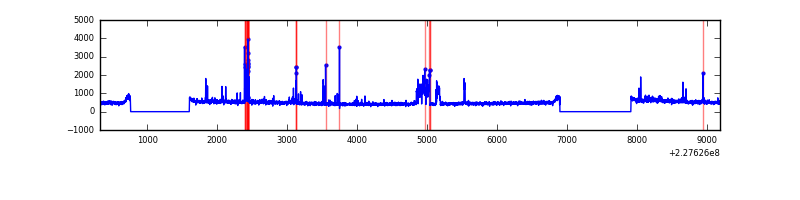 |
| C | 8860 | 7006 | 1 | 1 | 0.01% | 0.01% | 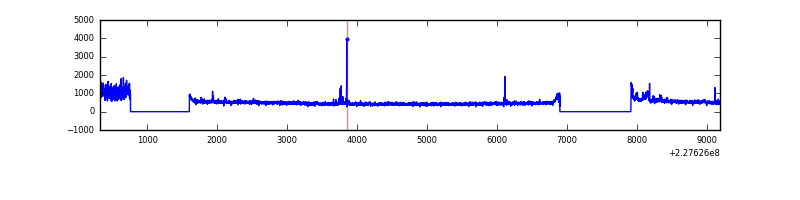 |
| D | 8860 | 7005 | 91 | 91 | 1.03% | 1.30% |  |
Top three noisy pixels from each quadrant. If the there are fewer than three noisy pixels in the level2.evt file, extra rows are filled as -1
| Pixel properties | Quadrant properties | ||||||
|---|---|---|---|---|---|---|---|
| Quadrant | DetID | PixID | Counts | Sigma | Mean | Median | Sigma |
| A | 0 | 128 | 128453 | 737.39 | 853 | 833 | 173.1 |
| A | 0 | 254 | 41936 | 237.49 | 853 | 833 | 173.1 |
| A | 0 | 226 | 7803 | 40.27 | 853 | 833 | 173.1 |
| B | 5 | 255 | 231667 | 1389.99 | 858 | 836 | 166.1 |
| B | 10 | 16 | 95136 | 567.84 | 858 | 836 | 166.1 |
| B | 4 | 239 | 39966 | 235.63 | 858 | 836 | 166.1 |
| C | 9 | 68 | 224877 | 1154.18 | 836 | 840 | 194.1 |
| C | 1 | 16 | 165680 | 849.21 | 836 | 840 | 194.1 |
| C | 8 | 143 | 25057 | 124.76 | 836 | 840 | 194.1 |
| D | 4 | 95 | 274805 | 1354.67 | 829 | 802 | 202.3 |
| D | 1 | 52 | 171716 | 845.0 | 829 | 802 | 202.3 |
| D | 2 | 14 | 136357 | 670.19 | 829 | 802 | 202.3 |
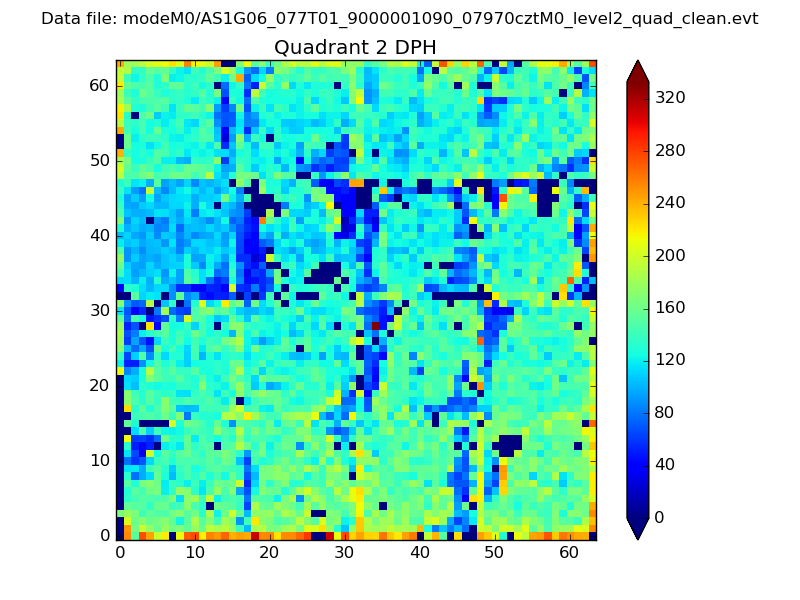
Histogram calculated using DETX and DETY for each event in the final _common_clean file
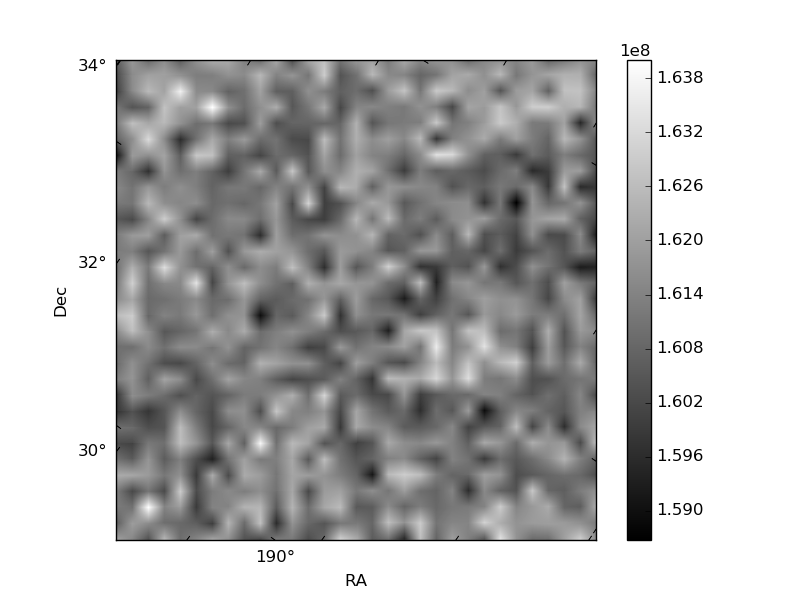
| Quadrant A |  |
 |
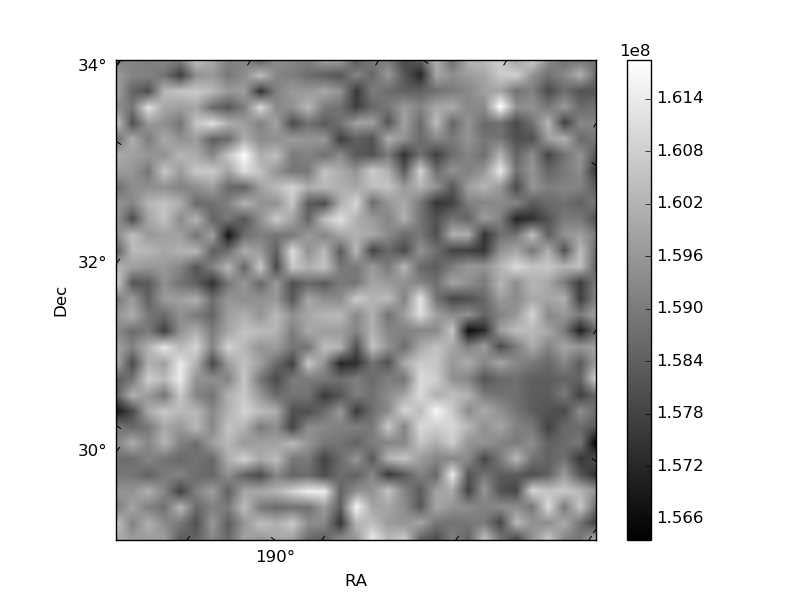
Quadrant B |
|---|---|---|---|
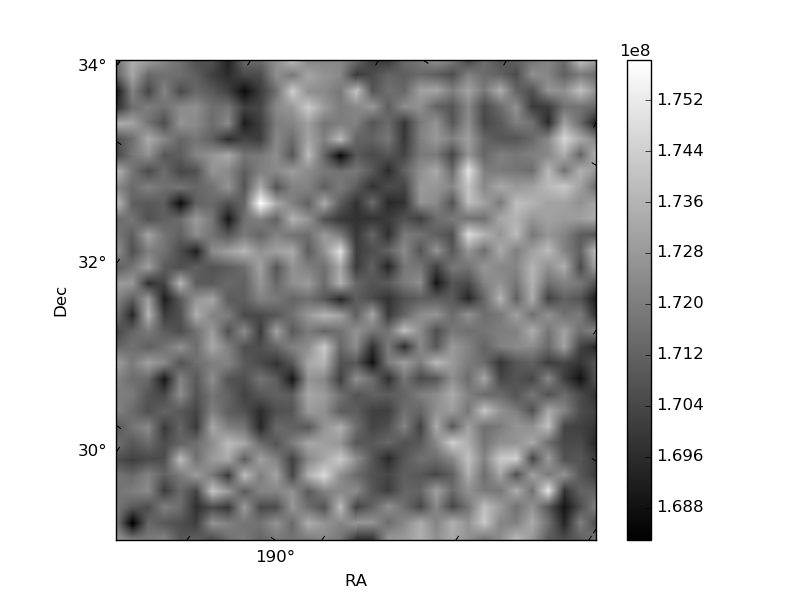
| Quadrant D | 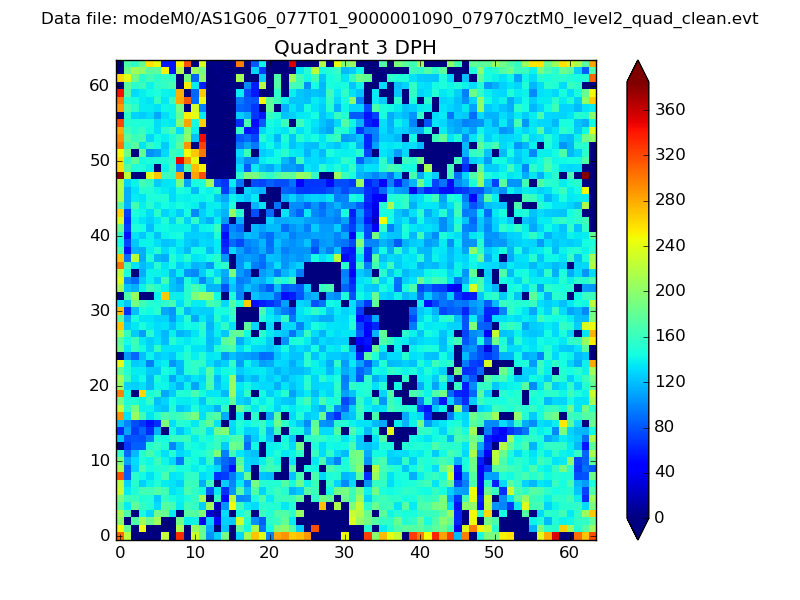 |
 |
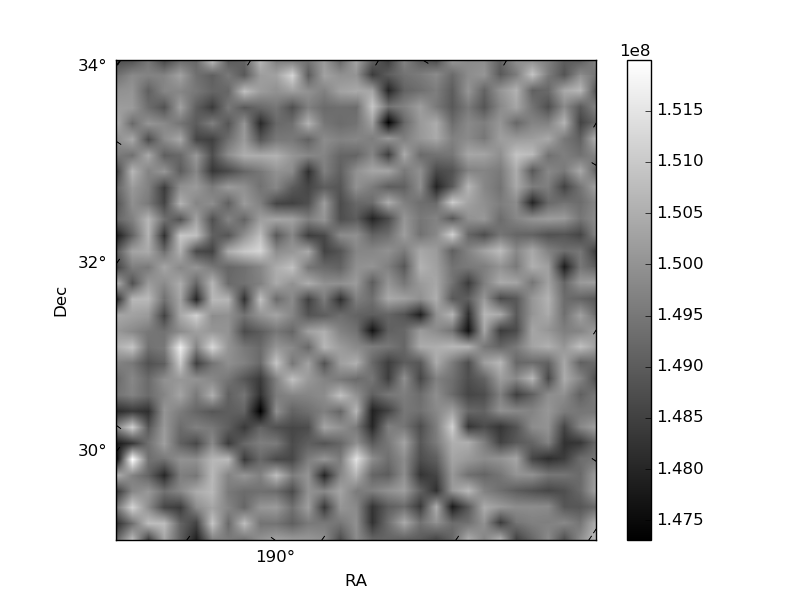
Quadrant C |
| Plot type | Count rate plots | Images |
|---|---|---|
| Comparison with Poisson distribution Blue bars denote a histogram of data divided into 1 sec bins. Red curve is a Poisson curve with rate = median count rate of data. |
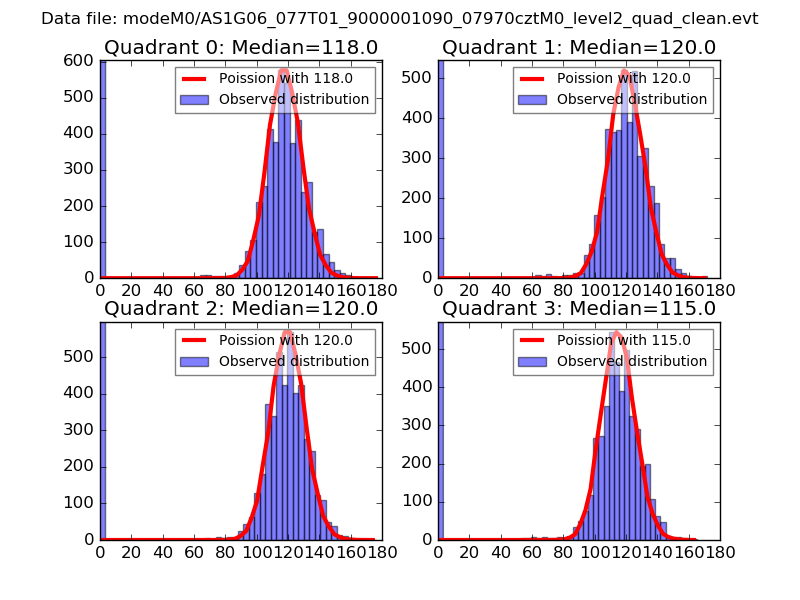 |
 |
| Quadrant-wise count rates Data is divided into 100 sec bins |
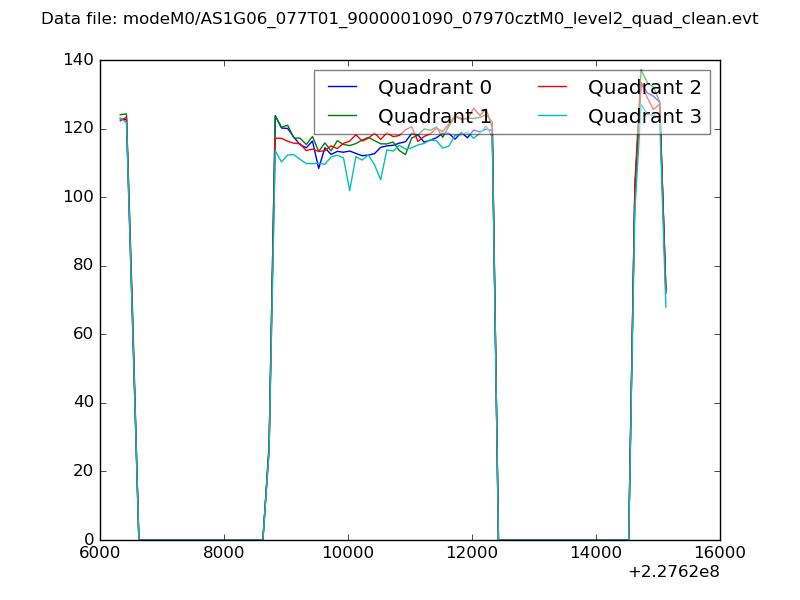 |
|
| Module-wise count rates for Quadrant A Data is divided into 100 sec bins |
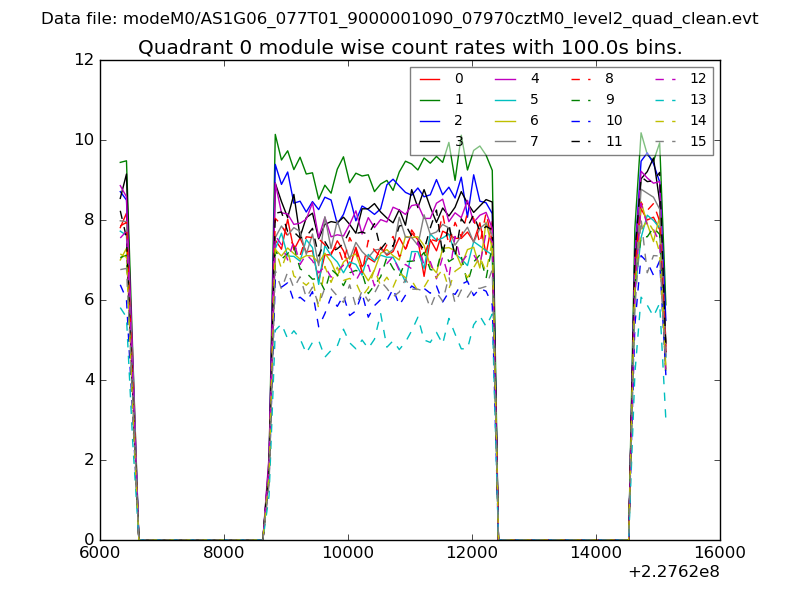 |
 |
| Module-wise count rates for Quadrant B Data is divided into 100 sec bins |
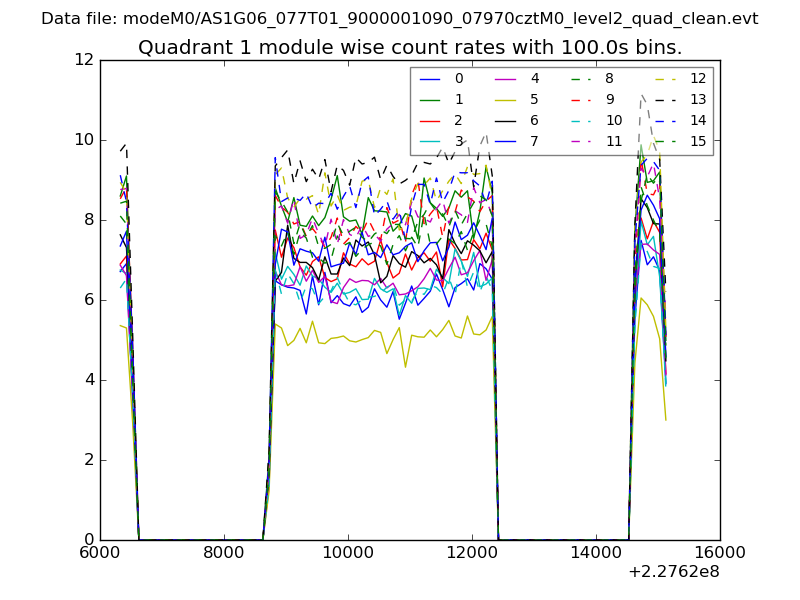 |
 |
| Module-wise count rates for Quadrant C Data is divided into 100 sec bins |
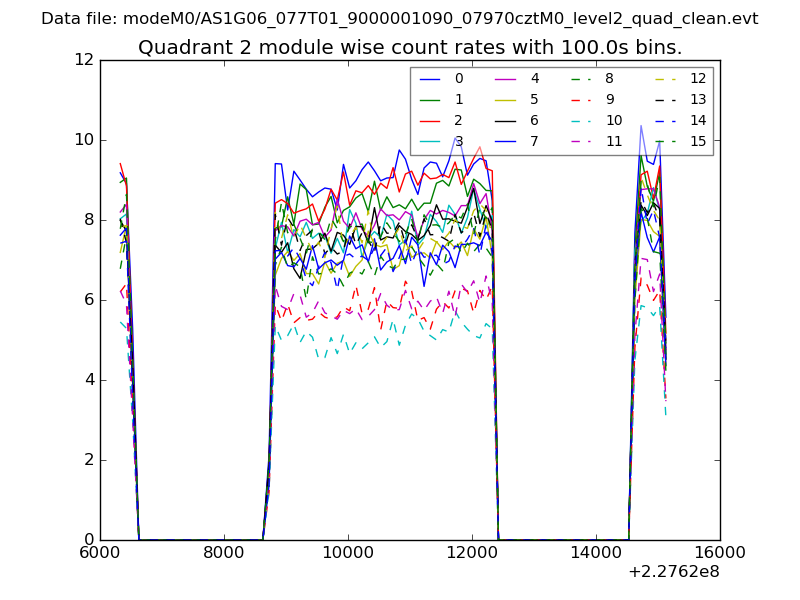 |
 |
| Module-wise count rates for Quadrant D Data is divided into 100 sec bins |
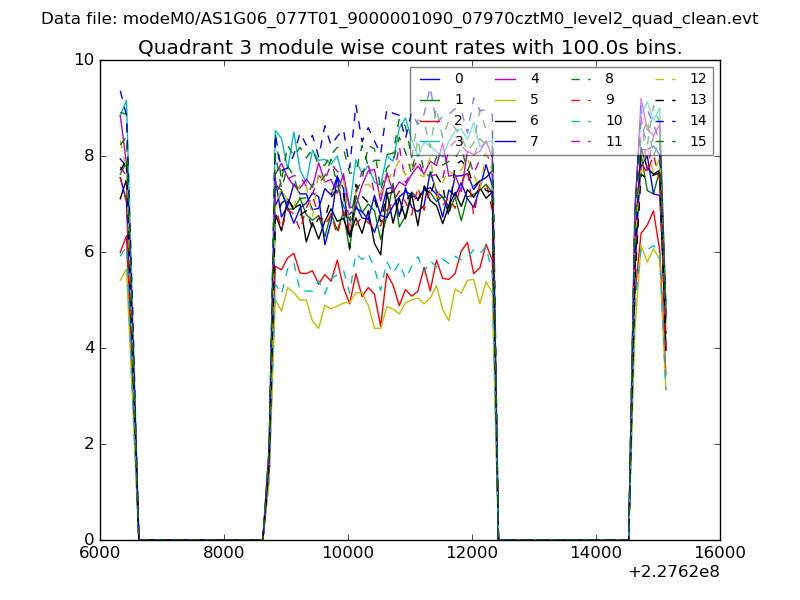 |
 |
| Parameter | Plot |
|---|---|
| CZT HV Monitor | 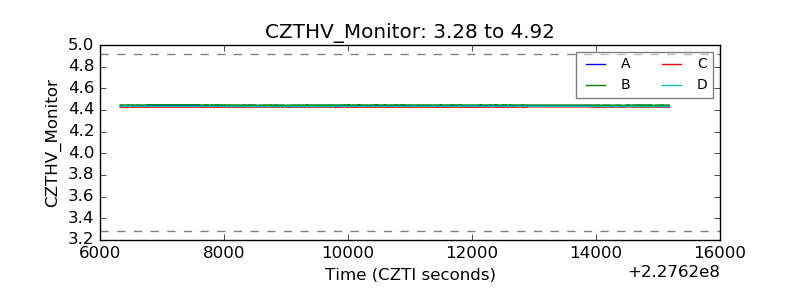 |
| D_VDD | 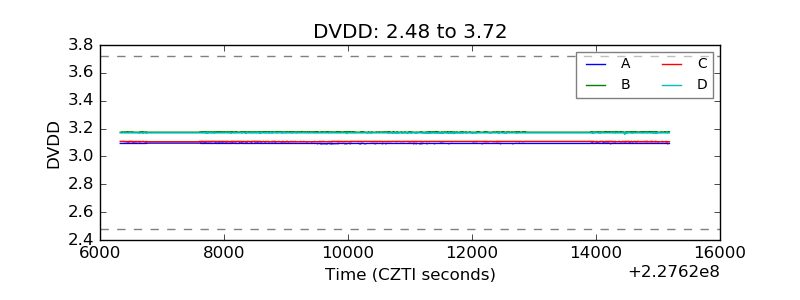 |
| Temperature 1 | 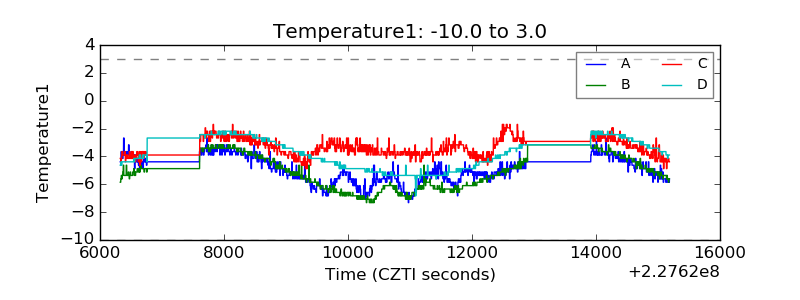 |
| Veto HV Monitor | 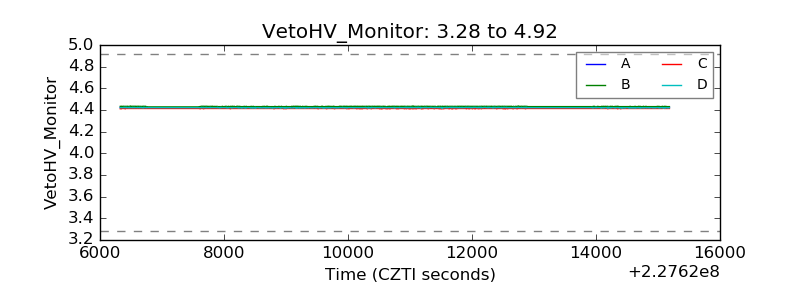 |
| Veto LLD | 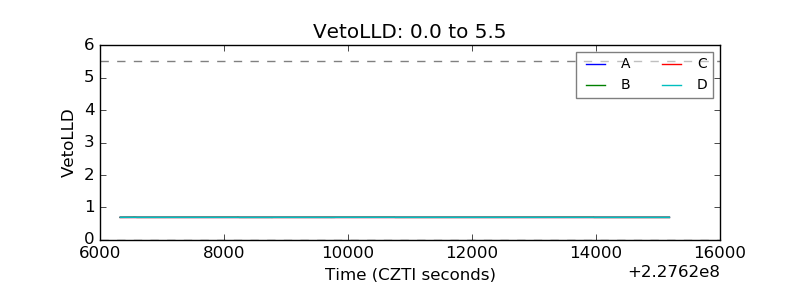 |
| Alpha Counter | 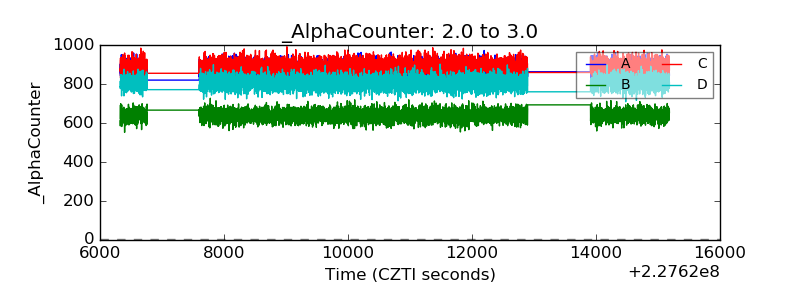 |
| _CPM_Rate | 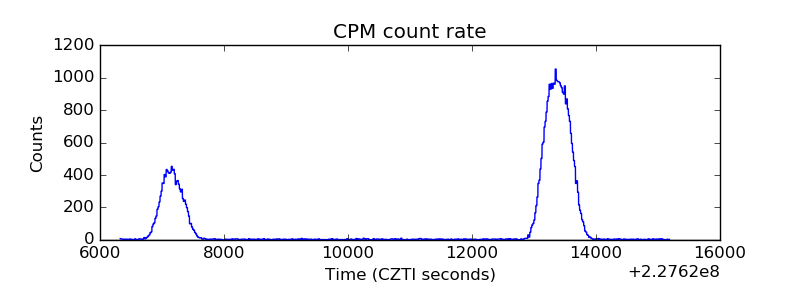 |
| CZT Counter | 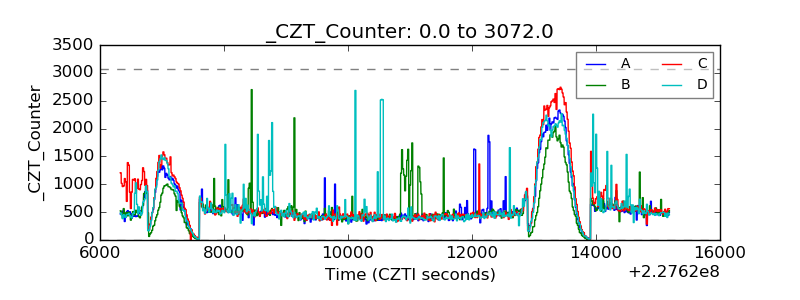 |
| +2.5 Volts monitor |  |
| +5 Volts monitor |  |
| _ROLL_ROT | 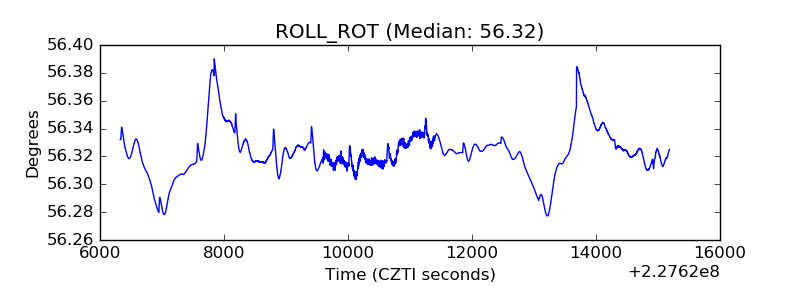 |
| _Roll_DEC | 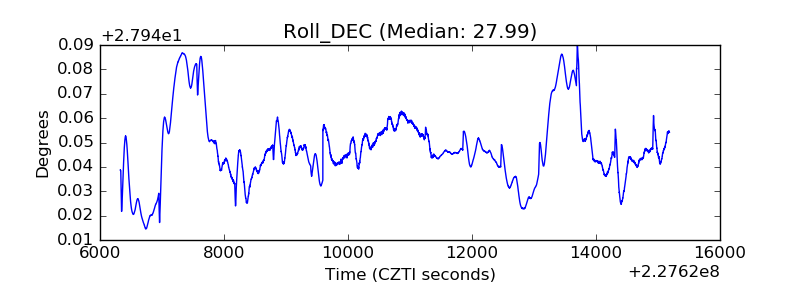 |
| _Roll_RA | 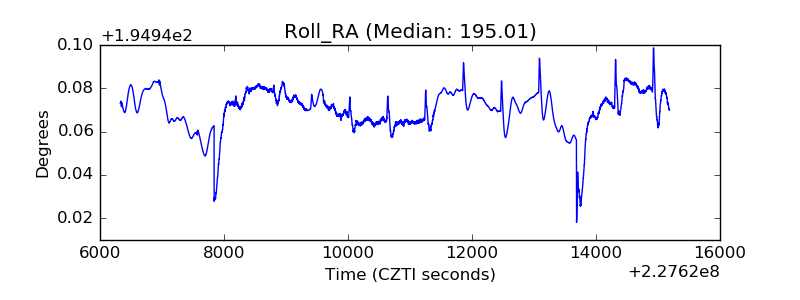 |
| Veto Counter | 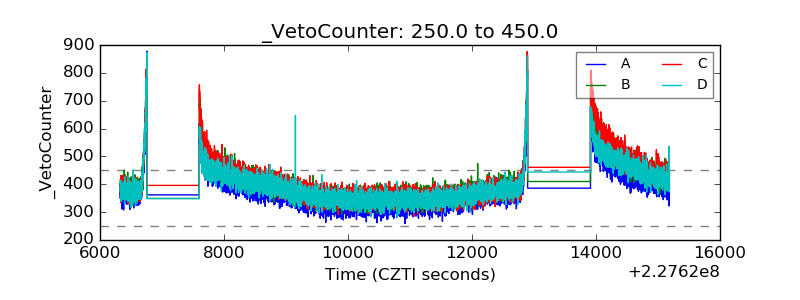 |