| Param | Original file | Final file |
|---|---|---|
| Filename | modeM0/AS1G06_077T01_9000001090_07972cztM0_level2.evt | modeM0/AS1G06_077T01_9000001090_07972cztM0_level2_quad_clean.evt |
| Size (bytes) | 492,929,280 | 94,334,400 |
| Size | 470.1 MB | 90.0 MB |
| Events in quadrant A | 3,443,309 | 589,180 |
| Events in quadrant B | 3,525,707 | 605,643 |
| Events in quadrant C | 3,485,587 | 602,171 |
| Events in quadrant D | 3,998,281 | 572,057 |
| Mode SS | |||
|---|---|---|---|
| Quadrant | BADHDUFLAG | Total packets | Discarded packets |
| A | 0 | 144 | 0 |
| B | 0 | 144 | 0 |
| C | 0 | 144 | 0 |
| D | 0 | 144 | 0 |
| Mode M0 | |||
|---|---|---|---|
| Quadrant | BADHDUFLAG | Total packets | Discarded packets |
| A | 0 | 14936 | 3 |
| B | 0 | 15291 | 2 |
| C | 0 | 15042 | 2 |
| D | 0 | 16701 | 2 |
| Mode M9 | |||
|---|---|---|---|
| Quadrant | BADHDUFLAG | Total packets | Discarded packets |
| A | 0 | 22 | 0 |
| B | 0 | 22 | 0 |
| C | 0 | 22 | 0 |
| D | 0 | 22 | 0 |
| Quadrant | Total seconds | Saturated seconds | Saturation percentage |
|---|---|---|---|
| A | 7003 | 83 | 1.185206% |
| B | 7003 | 101 | 1.442239% |
| C | 7003 | 75 | 1.070970% |
| D | 7003 | 191 | 2.727403% |
Noise dominated data is calculated using 1-second bins in cleaned event files. If a bin has >2000 counts, and if more than 50% of those come from <1% of pixels, then it is considered to be noise-dominated and hence unusable.
| Quadrant | # 1 sec bins | Bins with >0 counts | Bins with >2000 counts | High rate bins dominated by noise | Noise dominated (total time) | Noise dominated (detector-on time) | Marked lightcurve |
|---|---|---|---|---|---|---|---|
| A | 9193 | 7005 | 4 | 4 | 0.04% | 0.06% | 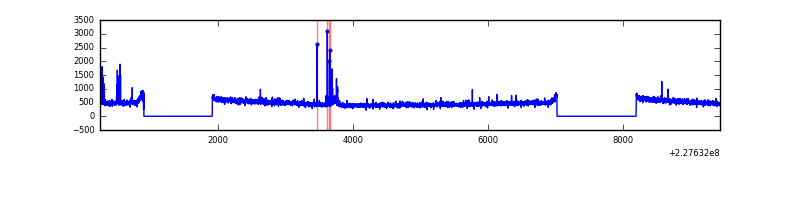 |
| B | 9193 | 7005 | 9 | 9 | 0.10% | 0.13% | 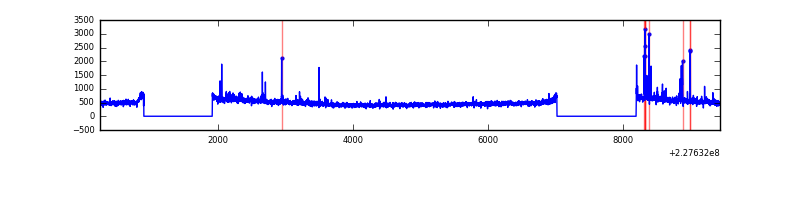 |
| C | 9193 | 7005 | 0 | 0 | 0.00% | 0.00% | 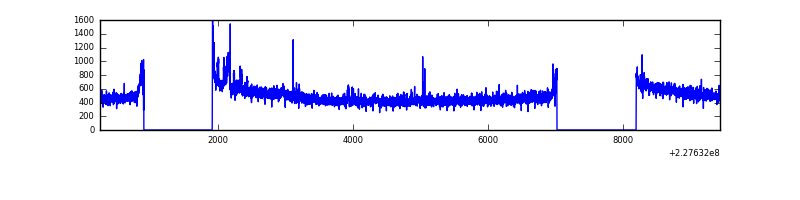 |
| D | 9193 | 7005 | 89 | 89 | 0.97% | 1.27% | 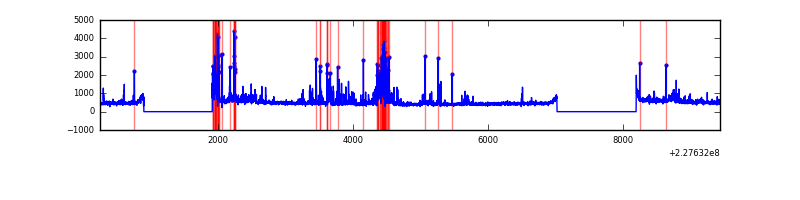 |
Top three noisy pixels from each quadrant. If the there are fewer than three noisy pixels in the level2.evt file, extra rows are filled as -1
| Pixel properties | Quadrant properties | ||||||
|---|---|---|---|---|---|---|---|
| Quadrant | DetID | PixID | Counts | Sigma | Mean | Median | Sigma |
| A | 0 | 254 | 52565 | 295.5 | 862 | 845 | 175.0 |
| A | 0 | 128 | 47851 | 268.57 | 862 | 845 | 175.0 |
| A | 0 | 226 | 8043 | 41.13 | 862 | 845 | 175.0 |
| B | 4 | 239 | 71659 | 427.42 | 870 | 850 | 165.7 |
| B | 11 | 51 | 39252 | 231.81 | 870 | 850 | 165.7 |
| B | 0 | 168 | 26072 | 152.25 | 870 | 850 | 165.7 |
| C | 1 | 16 | 145738 | 734.93 | 853 | 859 | 197.1 |
| C | 8 | 208 | 7521 | 33.79 | 853 | 859 | 197.1 |
| C | 13 | 61 | 6423 | 28.22 | 853 | 859 | 197.1 |
| D | 1 | 52 | 497537 | 2436.26 | 842 | 816 | 203.9 |
| D | 4 | 95 | 159487 | 778.23 | 842 | 816 | 203.9 |
| D | 2 | 14 | 83432 | 405.2 | 842 | 816 | 203.9 |
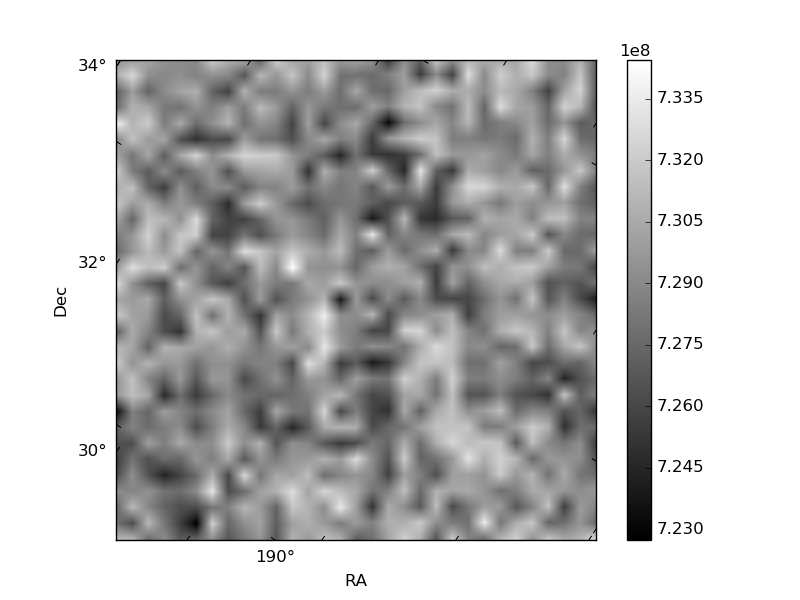
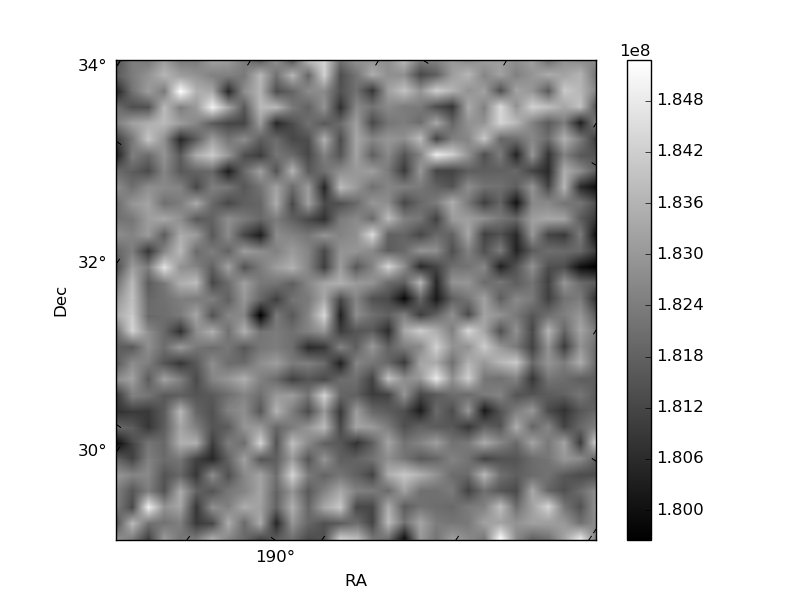
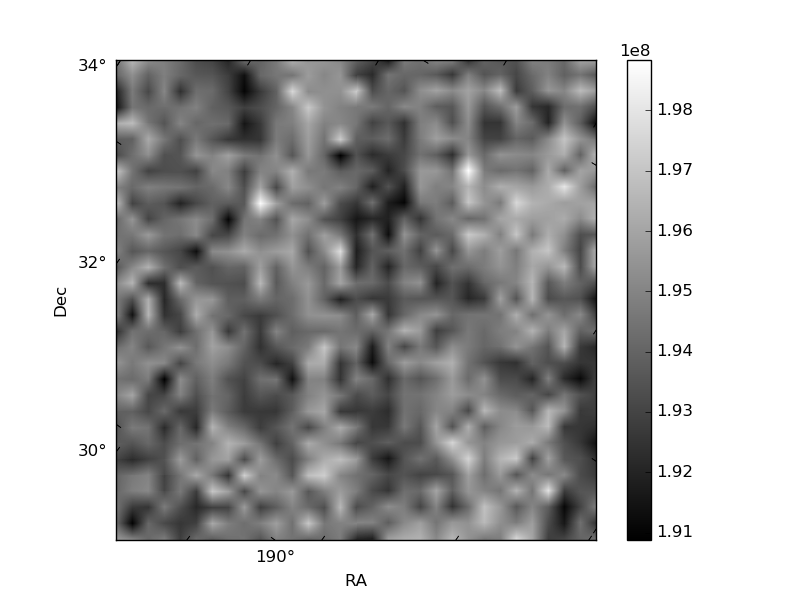
Histogram calculated using DETX and DETY for each event in the final _common_clean file
| Quadrant A | 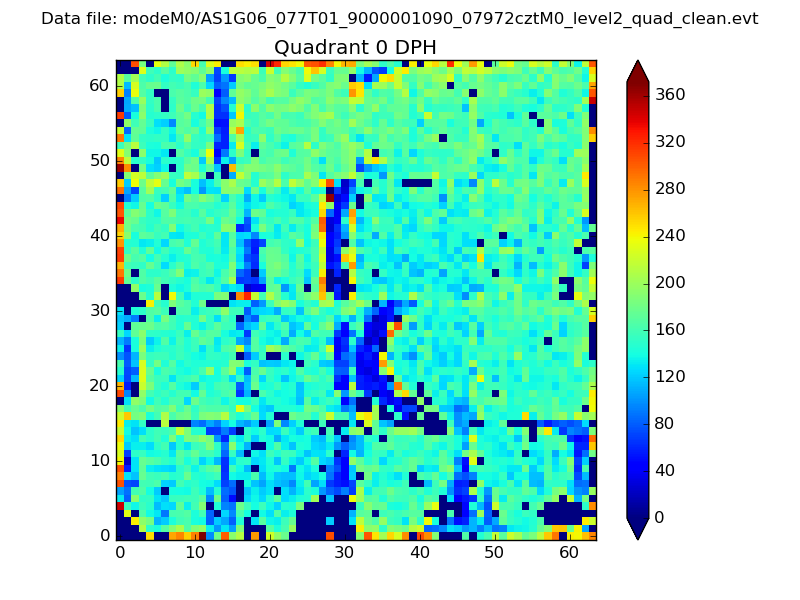 |
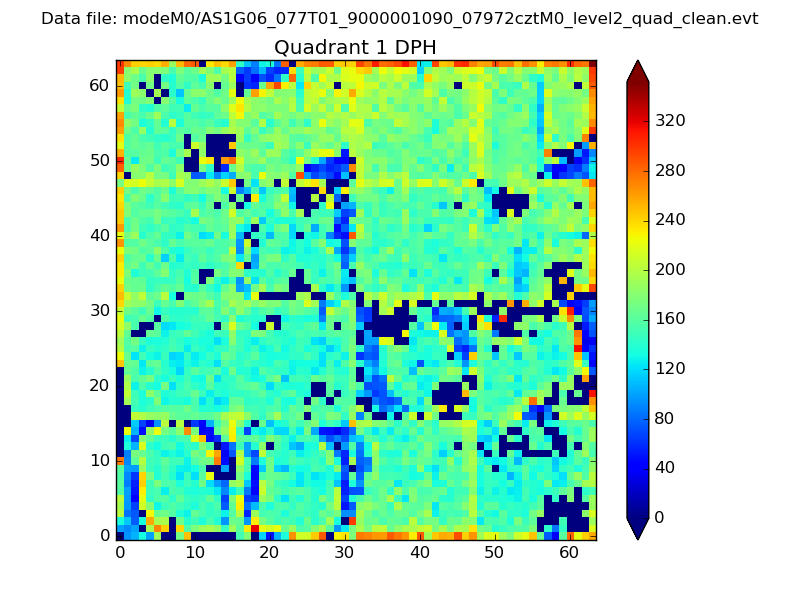 |
Quadrant B |
|---|---|---|---|
| Quadrant D | 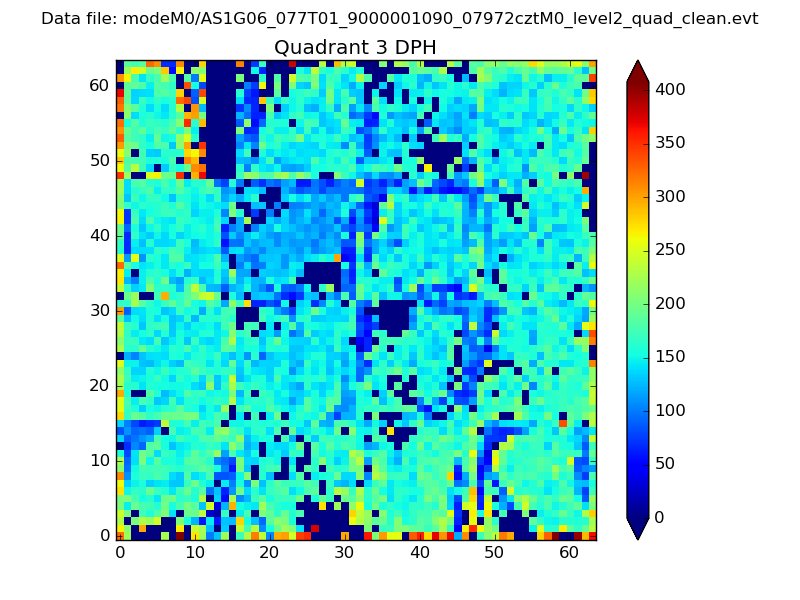 |
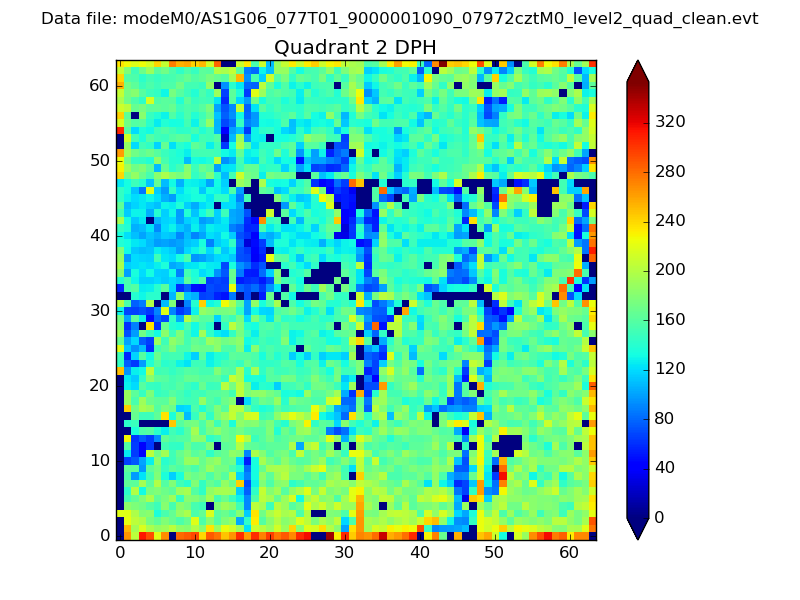 |
Quadrant C |
| Plot type | Count rate plots | Images |
|---|---|---|
| Comparison with Poisson distribution Blue bars denote a histogram of data divided into 1 sec bins. Red curve is a Poisson curve with rate = median count rate of data. |
 |
 |
| Quadrant-wise count rates Data is divided into 100 sec bins |
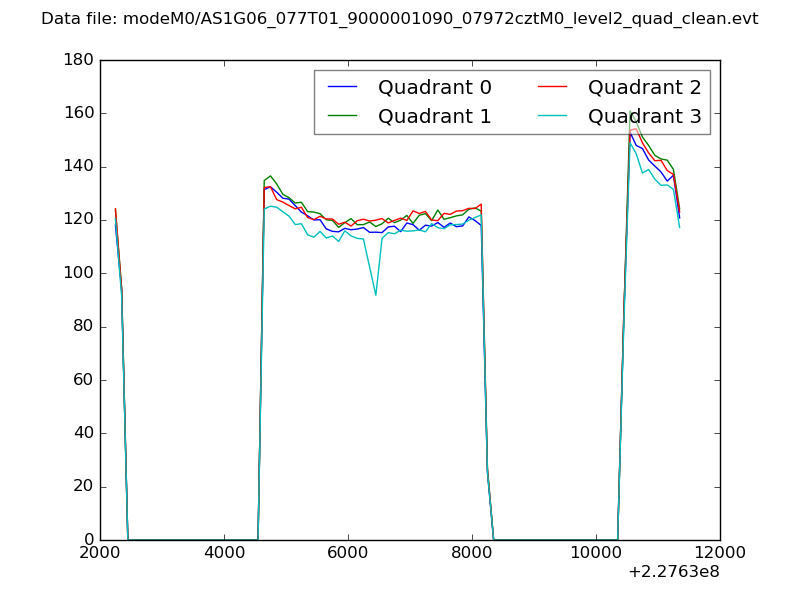 |
|
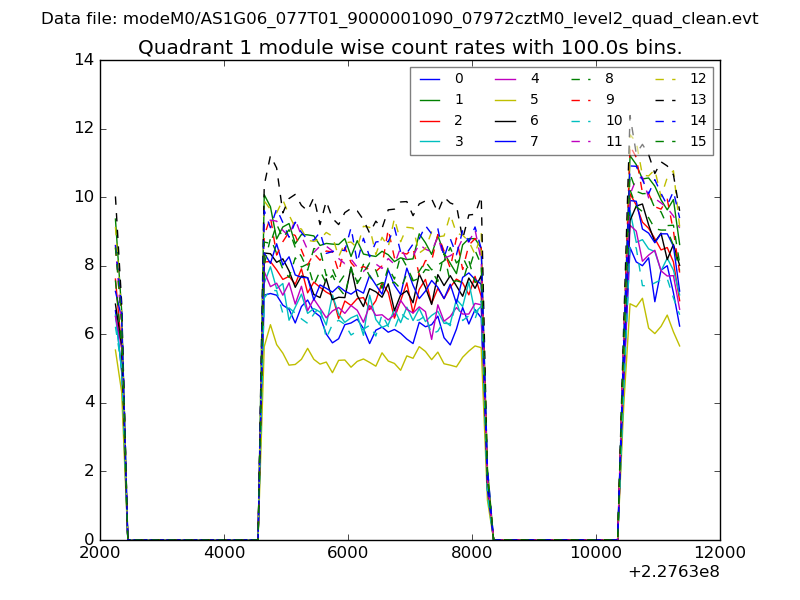
| Module-wise count rates for Quadrant A Data is divided into 100 sec bins |
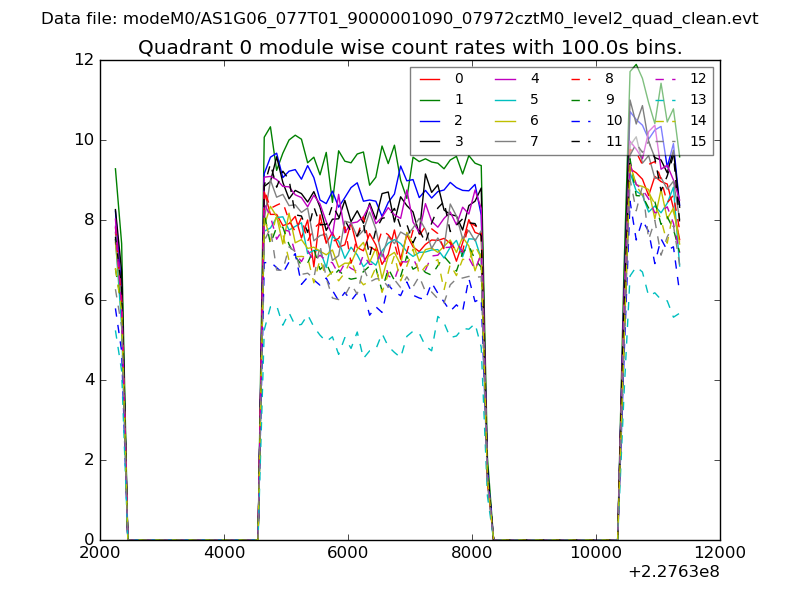 |
 |
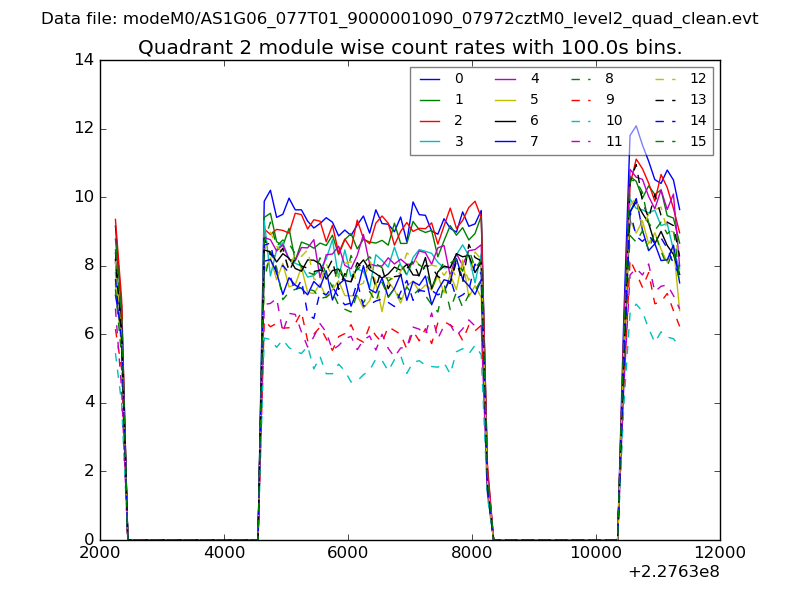
| Module-wise count rates for Quadrant B Data is divided into 100 sec bins |
 |
 |
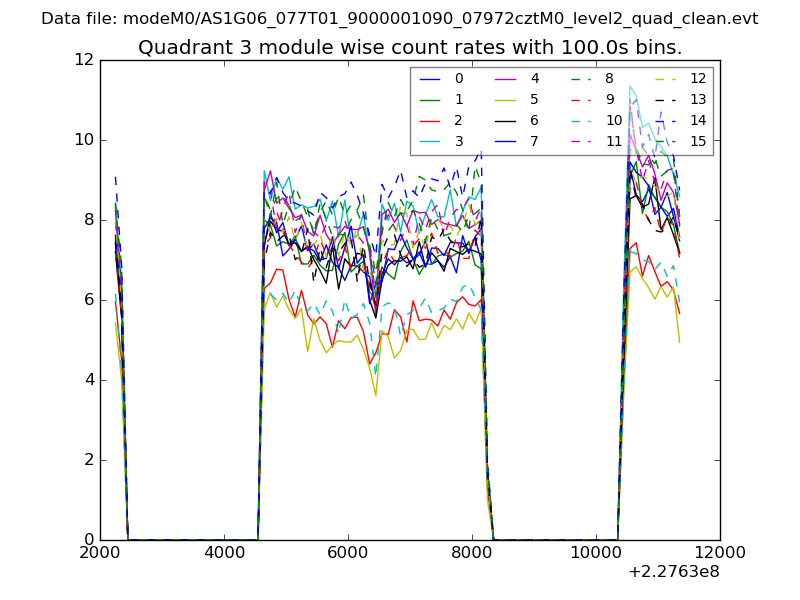
| Module-wise count rates for Quadrant C Data is divided into 100 sec bins |
 |
 |
| Module-wise count rates for Quadrant D Data is divided into 100 sec bins |
 |
 |
| Parameter | Plot |
|---|---|
| CZT HV Monitor | 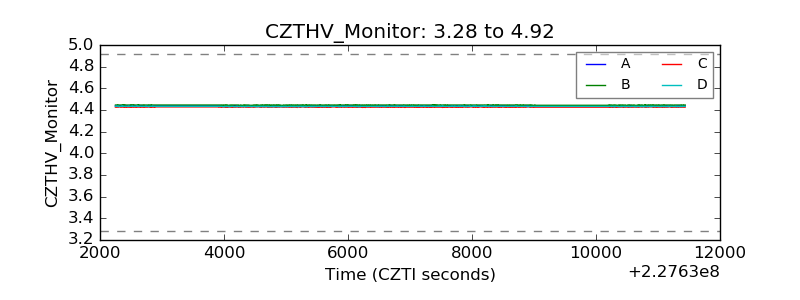 |
| D_VDD | 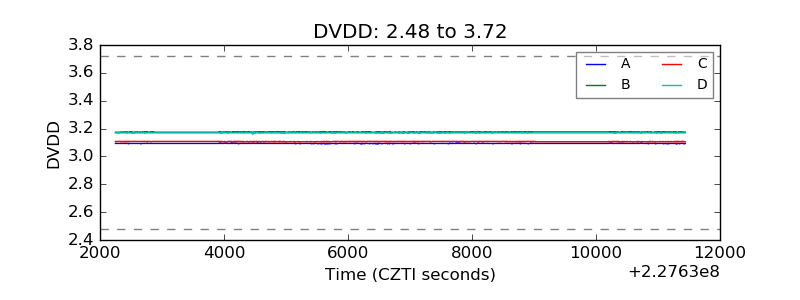 |
| Temperature 1 | 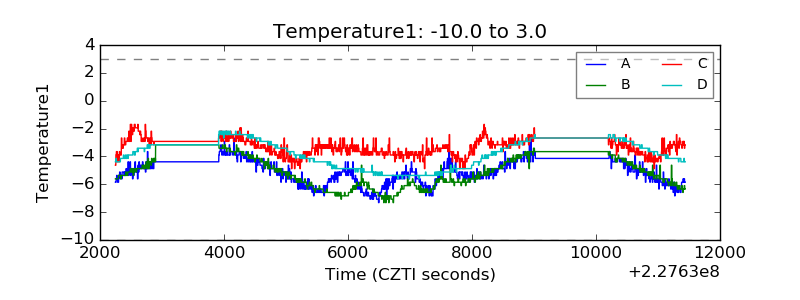 |
| Veto HV Monitor | 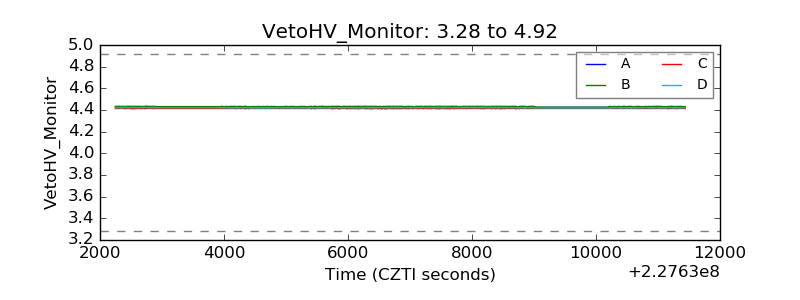 |
| Veto LLD | 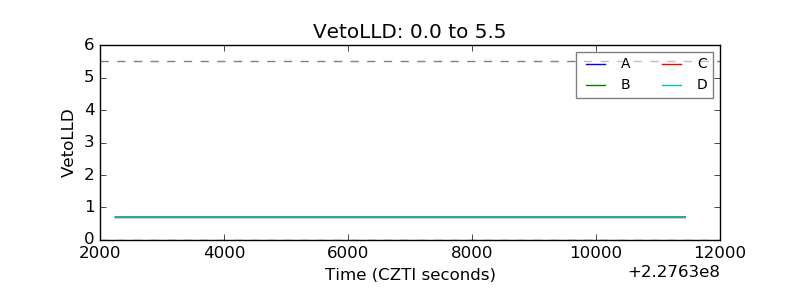 |
| Alpha Counter | 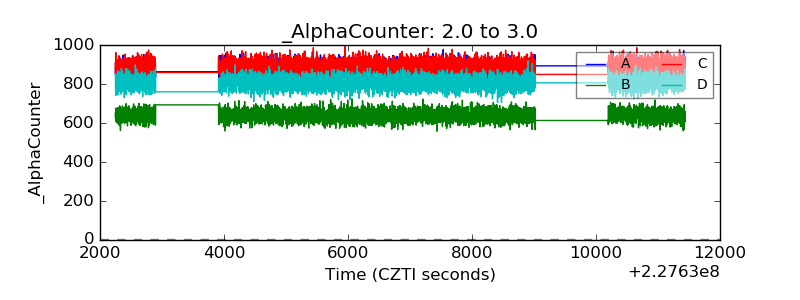 |
| _CPM_Rate | 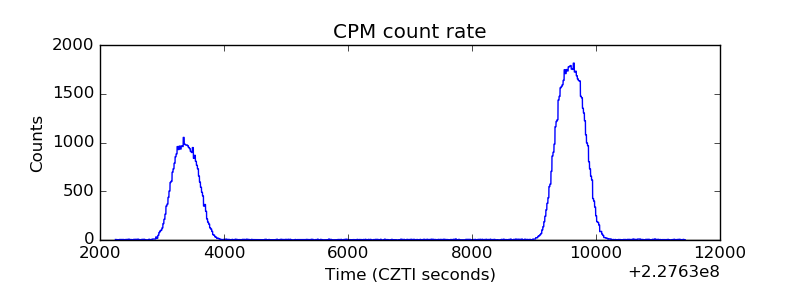 |
| CZT Counter | 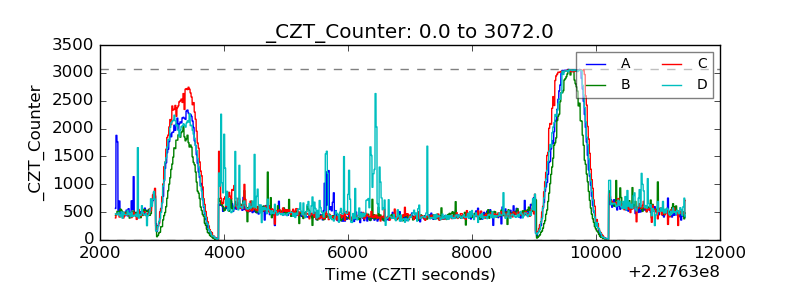 |
| +2.5 Volts monitor |  |
| +5 Volts monitor |  |
| _ROLL_ROT | 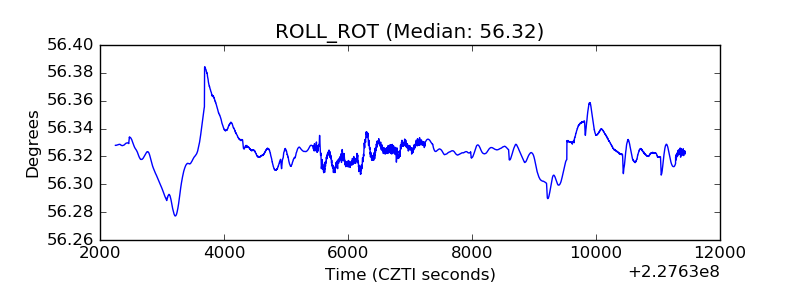 |
| _Roll_DEC | 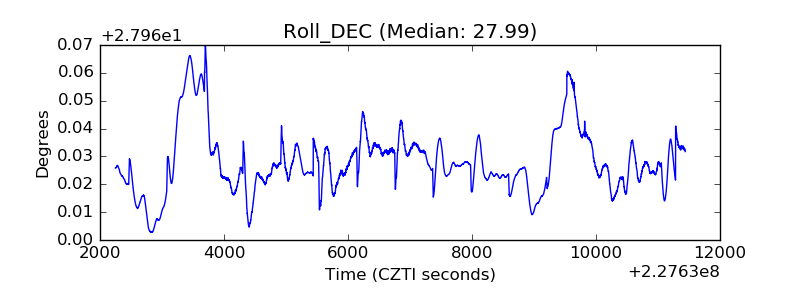 |
| _Roll_RA | 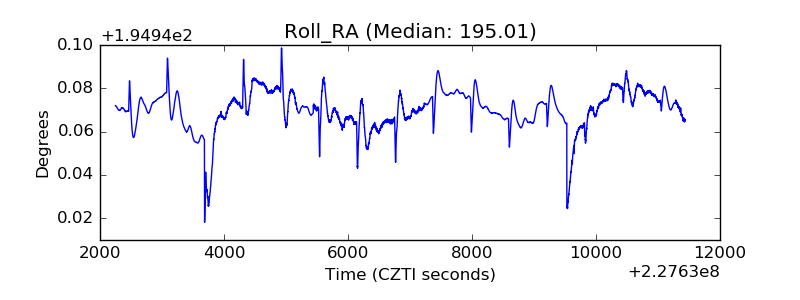 |
| Veto Counter | 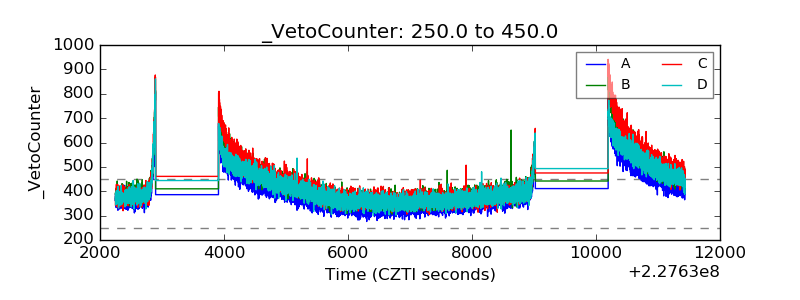 |