| Param | Original file | Final file |
|---|---|---|
| Filename | modeM0/AS1G06_077T01_9000001090_07973cztM0_level2.evt | modeM0/AS1G06_077T01_9000001090_07973cztM0_level2_quad_clean.evt |
| Size (bytes) | 574,260,480 | 103,118,400 |
| Size | 547.7 MB | 98.3 MB |
| Events in quadrant A | 4,310,468 | 649,688 |
| Events in quadrant B | 3,620,104 | 692,509 |
| Events in quadrant C | 3,519,561 | 691,042 |
| Events in quadrant D | 5,460,262 | 595,420 |
| Mode SS | |||
|---|---|---|---|
| Quadrant | BADHDUFLAG | Total packets | Discarded packets |
| A | 0 | 144 | 0 |
| B | 0 | 144 | 0 |
| C | 0 | 144 | 0 |
| D | 0 | 144 | 0 |
| Mode M0 | |||
|---|---|---|---|
| Quadrant | BADHDUFLAG | Total packets | Discarded packets |
| A | 0 | 17501 | 3 |
| B | 0 | 15474 | 2 |
| C | 0 | 15211 | 2 |
| D | 0 | 21242 | 2 |
| Mode M9 | |||
|---|---|---|---|
| Quadrant | BADHDUFLAG | Total packets | Discarded packets |
| A | 0 | 25 | 0 |
| B | 0 | 25 | 0 |
| C | 0 | 25 | 0 |
| D | 0 | 25 | 0 |
| Quadrant | Total seconds | Saturated seconds | Saturation percentage |
|---|---|---|---|
| A | 7100 | 361 | 5.084507% |
| B | 7100 | 102 | 1.436620% |
| C | 7100 | 61 | 0.859155% |
| D | 7100 | 836 | 11.774648% |
Noise dominated data is calculated using 1-second bins in cleaned event files. If a bin has >2000 counts, and if more than 50% of those come from <1% of pixels, then it is considered to be noise-dominated and hence unusable.
| Quadrant | # 1 sec bins | Bins with >0 counts | Bins with >2000 counts | High rate bins dominated by noise | Noise dominated (total time) | Noise dominated (detector-on time) | Marked lightcurve |
|---|---|---|---|---|---|---|---|
| A | 9530 | 7102 | 262 | 262 | 2.75% | 3.69% | 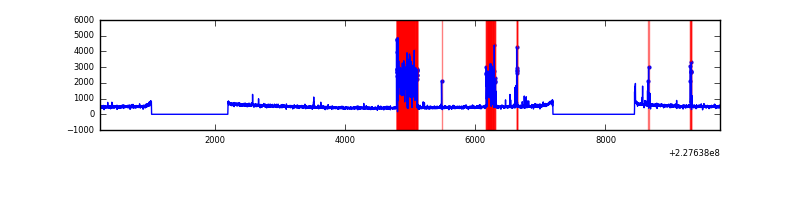 |
| B | 9530 | 7102 | 9 | 9 | 0.09% | 0.13% | 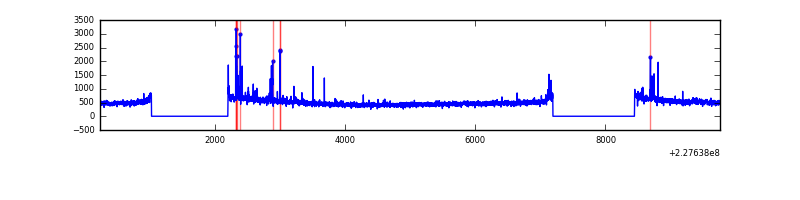 |
| C | 9530 | 7102 | 0 | 0 | 0.00% | 0.00% | 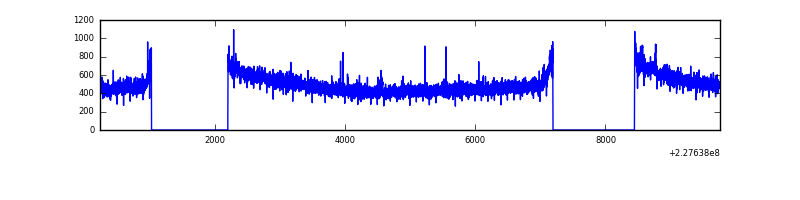 |
| D | 9530 | 7102 | 659 | 659 | 6.92% | 9.28% | 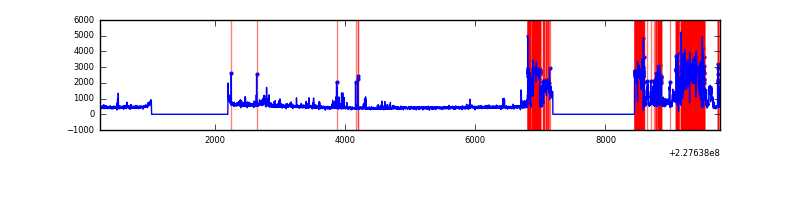 |
Top three noisy pixels from each quadrant. If the there are fewer than three noisy pixels in the level2.evt file, extra rows are filled as -1
| Pixel properties | Quadrant properties | ||||||
|---|---|---|---|---|---|---|---|
| Quadrant | DetID | PixID | Counts | Sigma | Mean | Median | Sigma |
| A | 0 | 254 | 866028 | 4913.28 | 874 | 858 | 176.1 |
| A | 0 | 128 | 30095 | 166.03 | 874 | 858 | 176.1 |
| A | 15 | 234 | 22197 | 121.18 | 874 | 858 | 176.1 |
| B | 4 | 239 | 84206 | 490.87 | 900 | 878 | 169.8 |
| B | 12 | 111 | 18363 | 103.0 | 900 | 878 | 169.8 |
| B | 11 | 51 | 17134 | 95.76 | 900 | 878 | 169.8 |
| C | 1 | 16 | 59112 | 287.77 | 883 | 889 | 202.3 |
| C | 8 | 208 | 8195 | 36.11 | 883 | 889 | 202.3 |
| C | 13 | 61 | 6713 | 28.79 | 883 | 889 | 202.3 |
| D | 1 | 52 | 2225542 | 11216.64 | 812 | 791 | 198.3 |
| D | 2 | 14 | 71839 | 358.21 | 812 | 791 | 198.3 |
| D | 1 | 20 | 45338 | 224.59 | 812 | 791 | 198.3 |
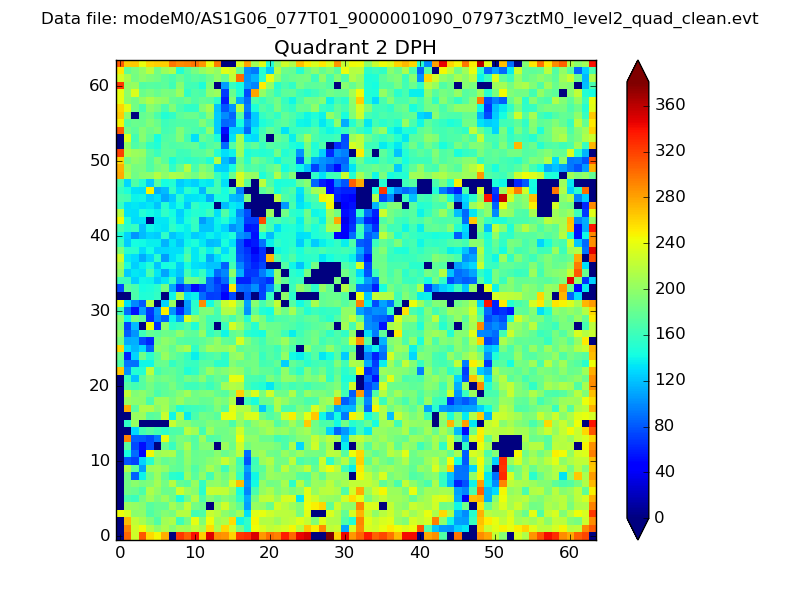
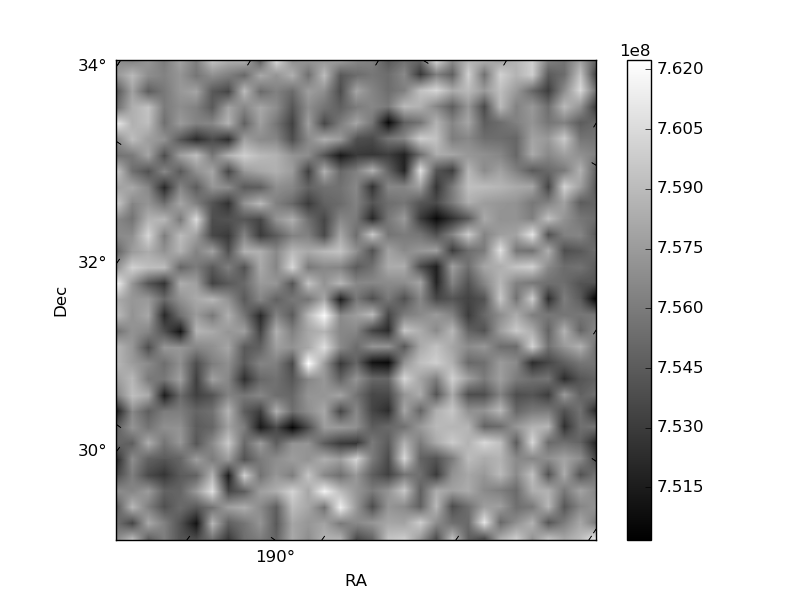
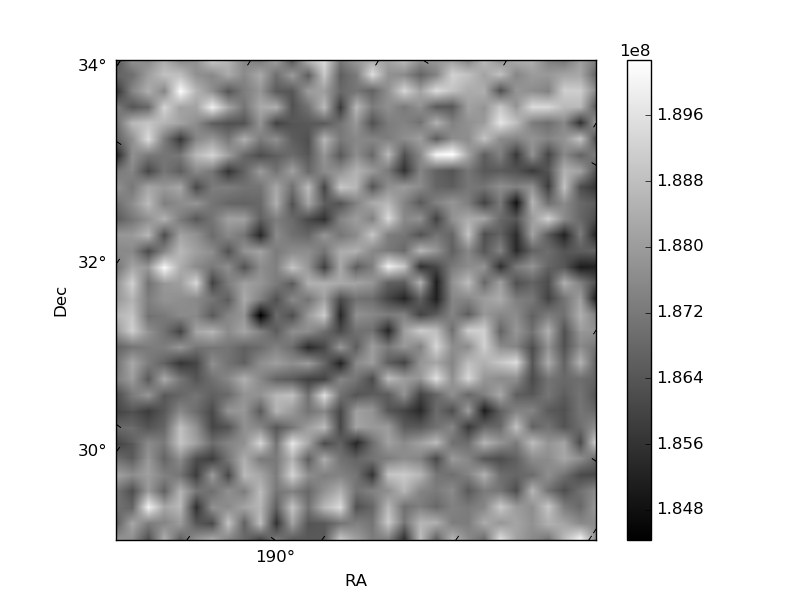
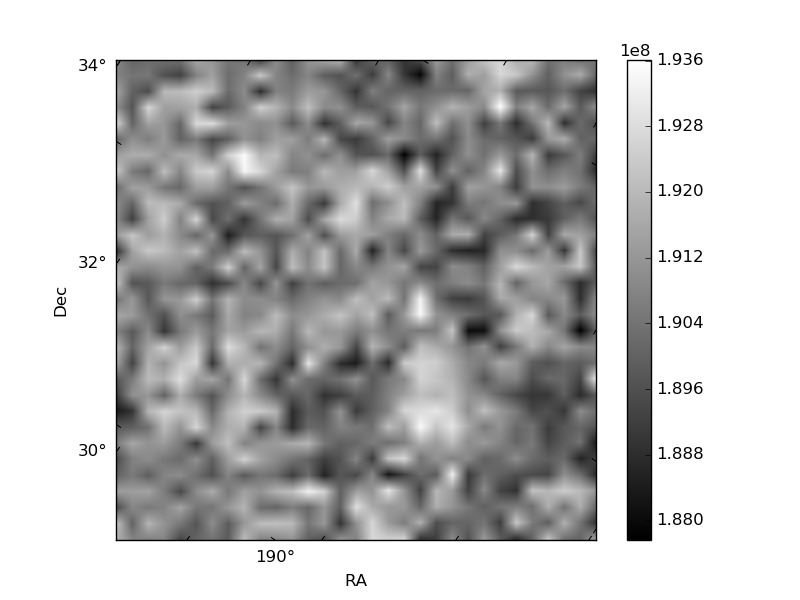
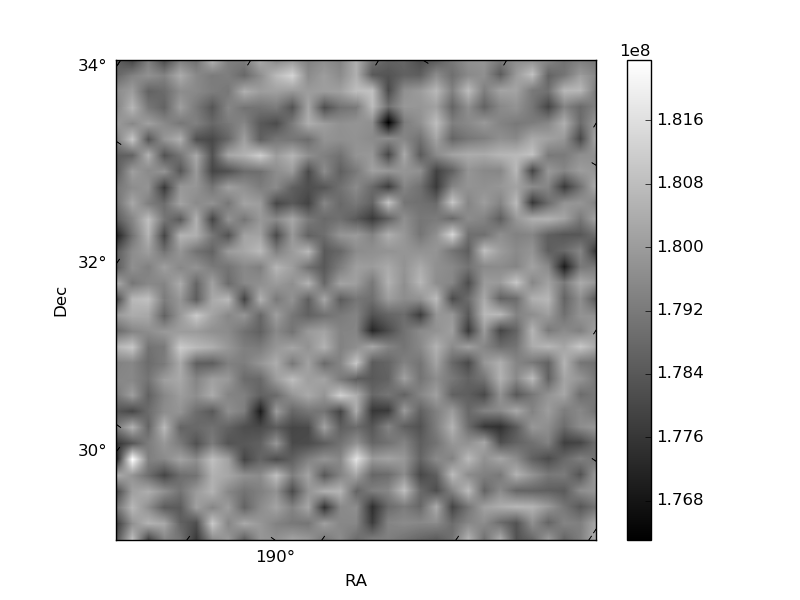
Histogram calculated using DETX and DETY for each event in the final _common_clean file
| Quadrant A | 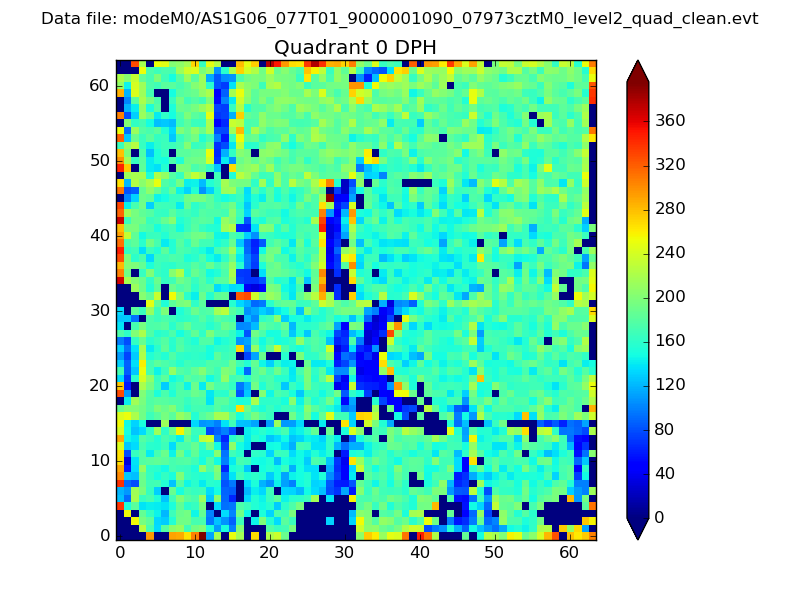 |
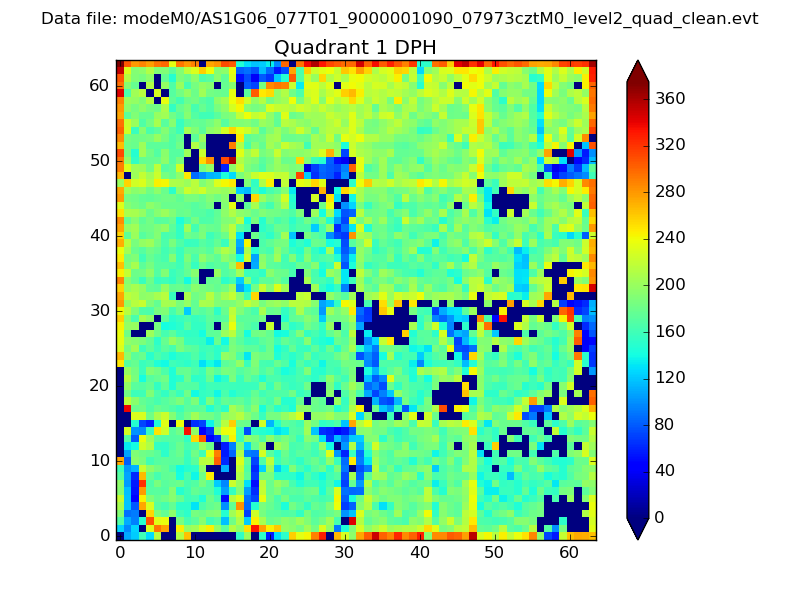 |
Quadrant B |
|---|---|---|---|
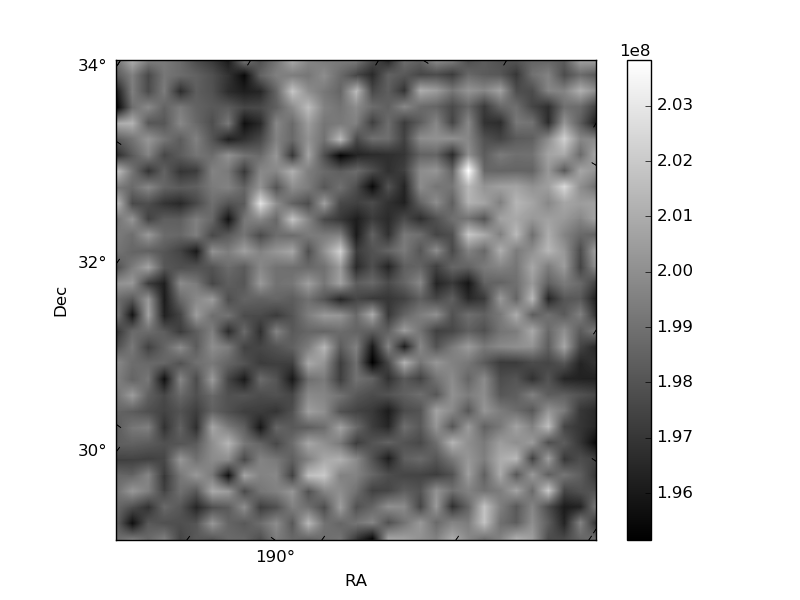
| Quadrant D | 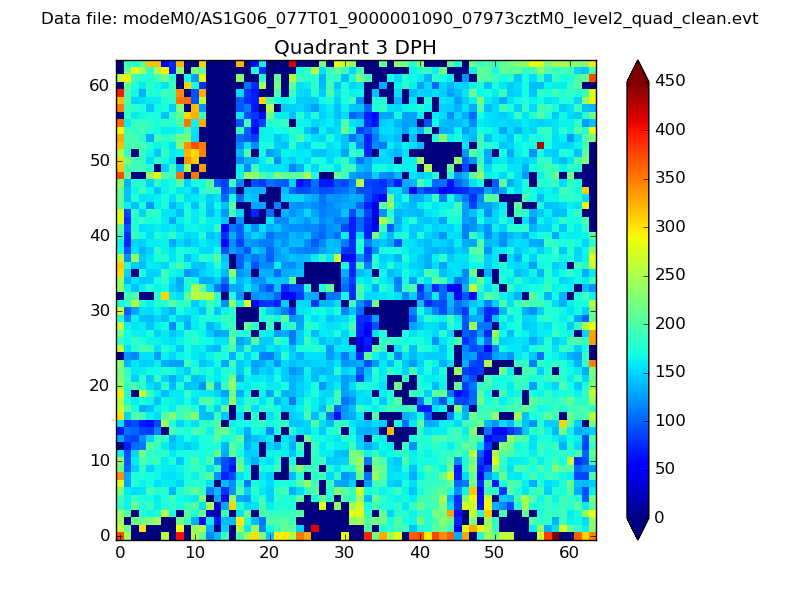 |
 |
Quadrant C |
| Plot type | Count rate plots | Images |
|---|---|---|
| Comparison with Poisson distribution Blue bars denote a histogram of data divided into 1 sec bins. Red curve is a Poisson curve with rate = median count rate of data. |
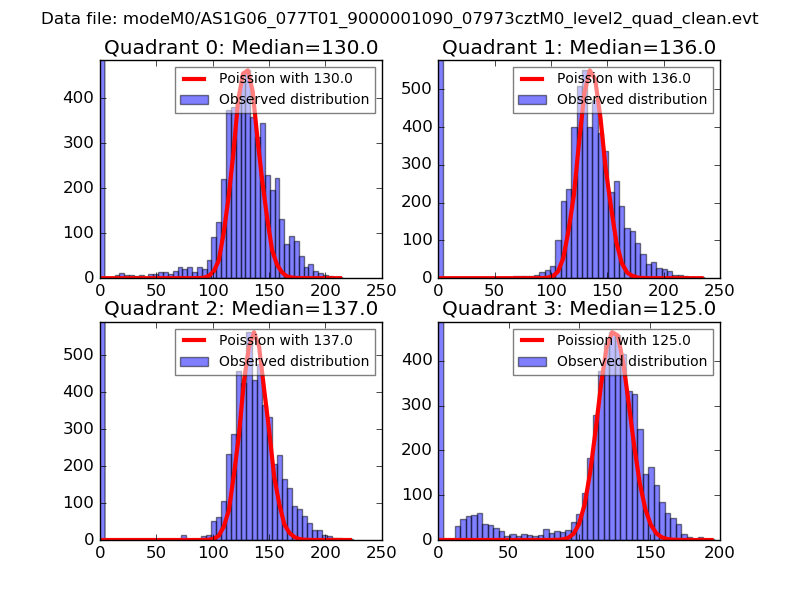 |
 |
| Quadrant-wise count rates Data is divided into 100 sec bins |
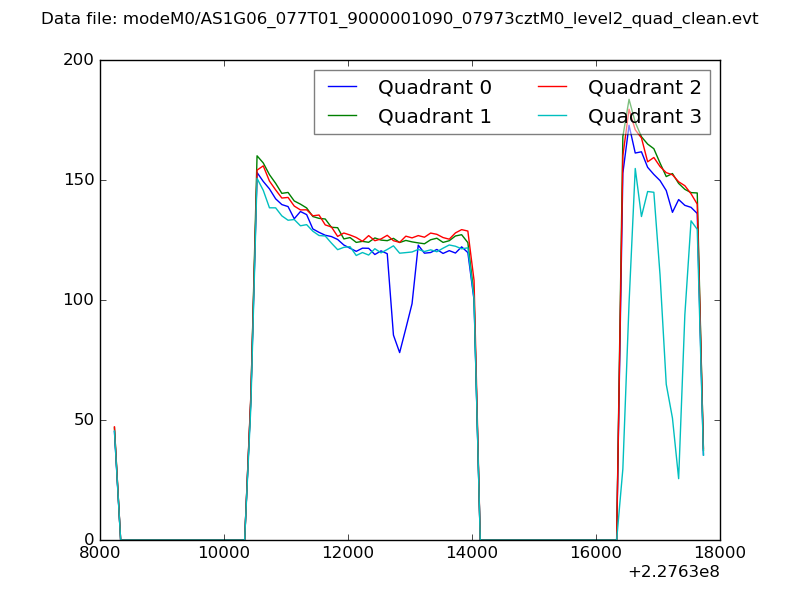 |
|
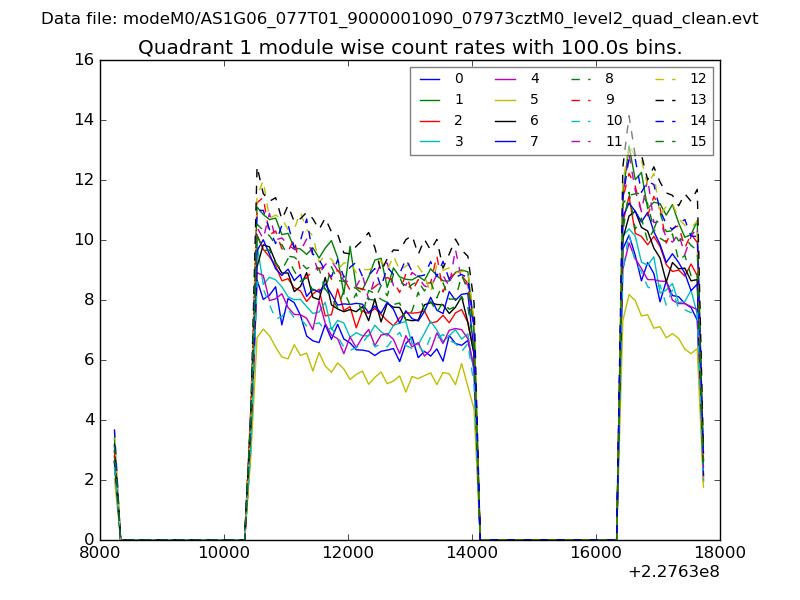
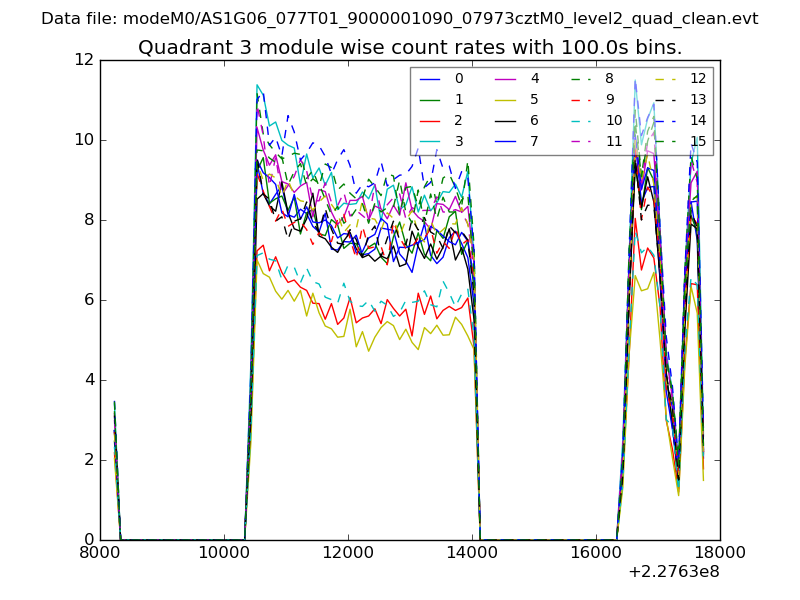
| Module-wise count rates for Quadrant A Data is divided into 100 sec bins |
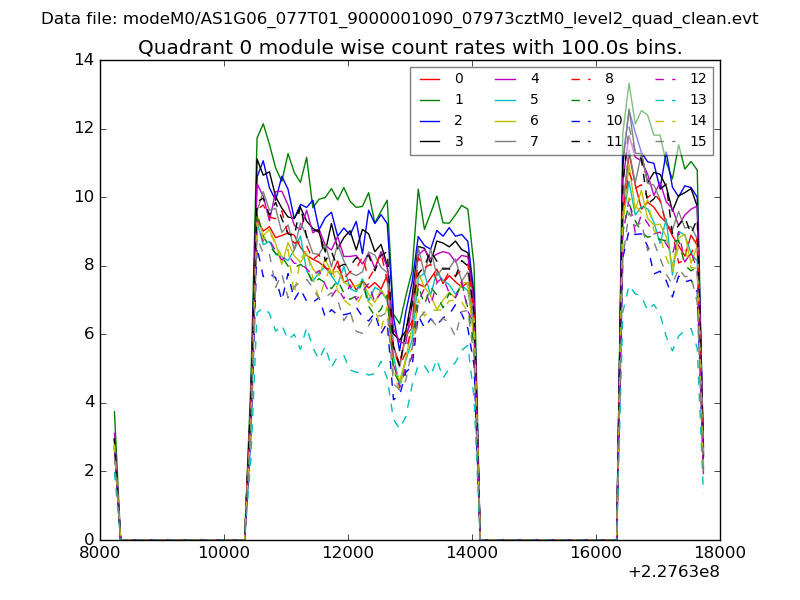 |
 |
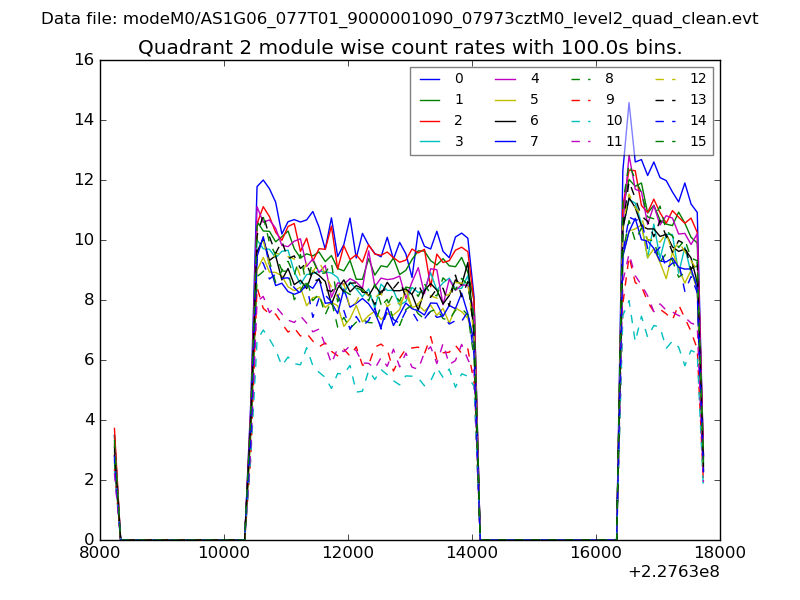
| Module-wise count rates for Quadrant B Data is divided into 100 sec bins |
 |
 |
| Module-wise count rates for Quadrant C Data is divided into 100 sec bins |
 |
 |
| Module-wise count rates for Quadrant D Data is divided into 100 sec bins |
 |
 |
| Parameter | Plot |
|---|---|
| CZT HV Monitor | 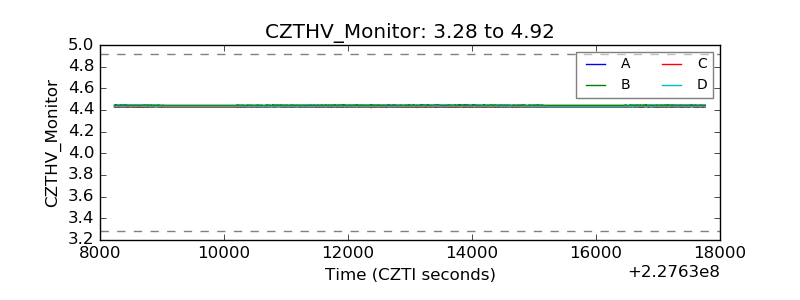 |
| D_VDD | 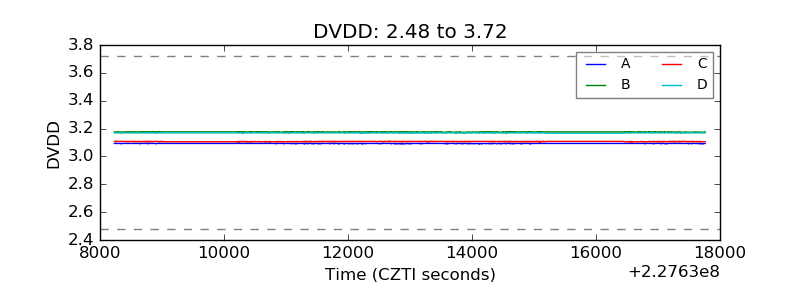 |
| Temperature 1 | 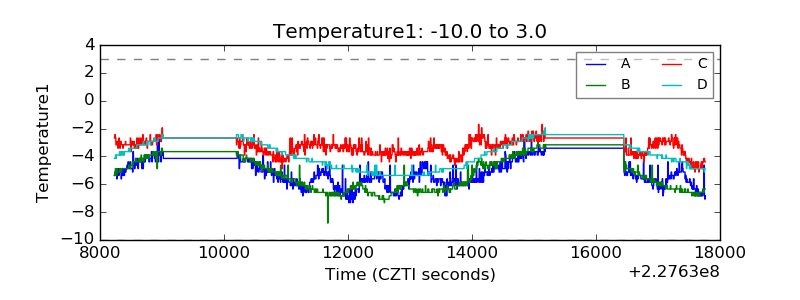 |
| Veto HV Monitor | 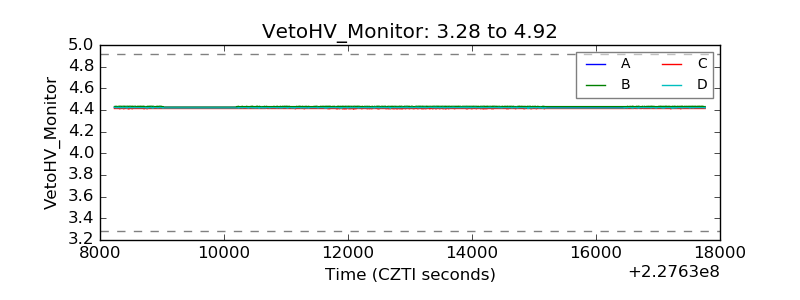 |
| Veto LLD | 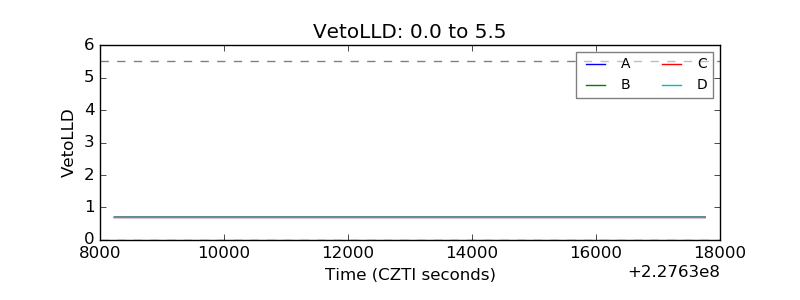 |
| Alpha Counter | 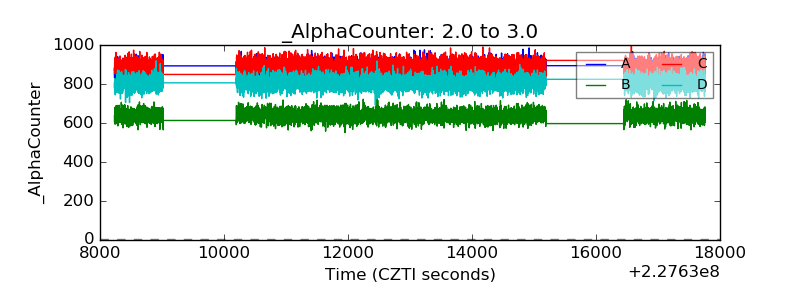 |
| _CPM_Rate | 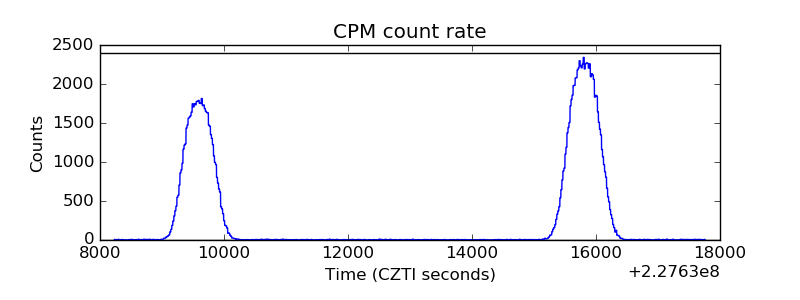 |
| CZT Counter | 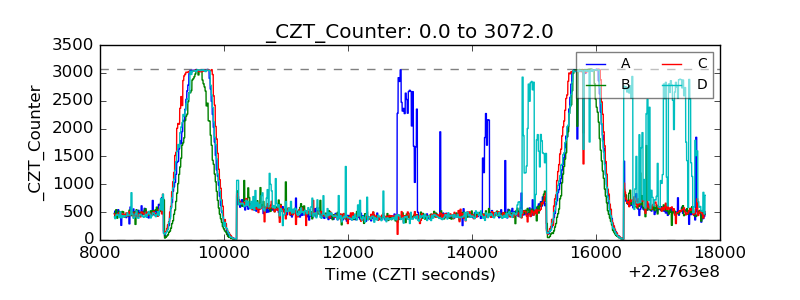 |
| +2.5 Volts monitor |  |
| +5 Volts monitor |  |
| _ROLL_ROT | 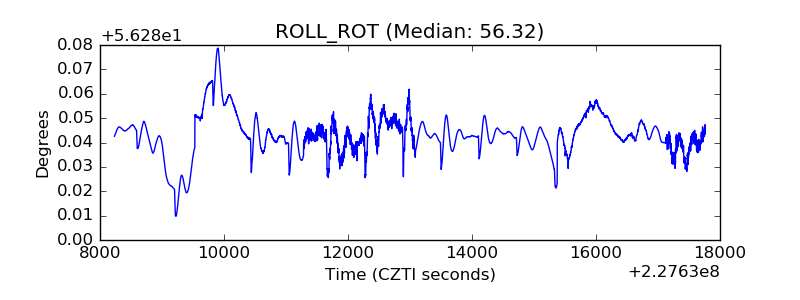 |
| _Roll_DEC | 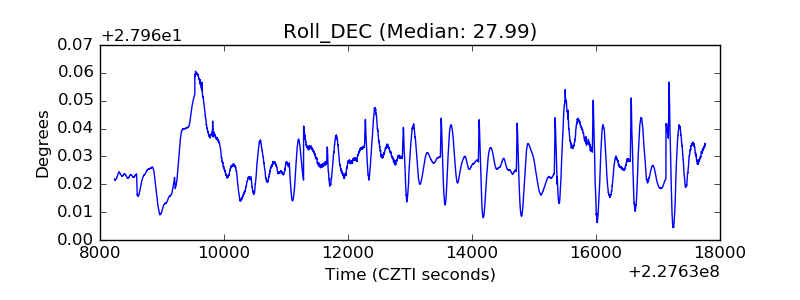 |
| _Roll_RA | 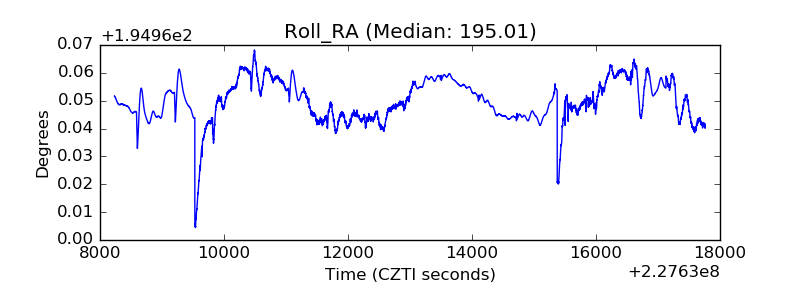 |
| Veto Counter | 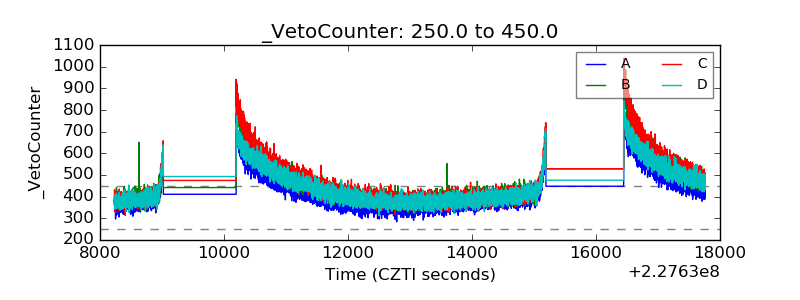 |