| Param | Original file | Final file |
|---|---|---|
| Filename | modeM0/AS1G06_077T01_9000001090_07980cztM0_level2.evt | modeM0/AS1G06_077T01_9000001090_07980cztM0_level2_quad_clean.evt |
| Size (bytes) | 483,494,400 | 87,785,280 |
| Size | 461.1 MB | 83.7 MB |
| Events in quadrant A | 3,493,367 | 526,529 |
| Events in quadrant B | 3,662,705 | 543,944 |
| Events in quadrant C | 3,452,067 | 543,778 |
| Events in quadrant D | 3,525,289 | 522,683 |
| Mode SS | |||
|---|---|---|---|
| Quadrant | BADHDUFLAG | Total packets | Discarded packets |
| A | 0 | 152 | 2 |
| B | 0 | 152 | 4 |
| C | 0 | 152 | 2 |
| D | 0 | 152 | 0 |
| Mode M0 | |||
|---|---|---|---|
| Quadrant | BADHDUFLAG | Total packets | Discarded packets |
| A | 0 | 15633 | 81 |
| B | 0 | 16054 | 66 |
| C | 0 | 15529 | 61 |
| D | 0 | 16001 | 73 |
| Quadrant | Total seconds | Saturated seconds | Saturation percentage |
|---|---|---|---|
| A | 7482 | 225 | 3.007217% |
| B | 7488 | 236 | 3.151709% |
| C | 7490 | 142 | 1.895861% |
| D | 7484 | 184 | 2.458578% |
Noise dominated data is calculated using 1-second bins in cleaned event files. If a bin has >2000 counts, and if more than 50% of those come from <1% of pixels, then it is considered to be noise-dominated and hence unusable.
| Quadrant | # 1 sec bins | Bins with >0 counts | Bins with >2000 counts | High rate bins dominated by noise | Noise dominated (total time) | Noise dominated (detector-on time) | Marked lightcurve |
|---|---|---|---|---|---|---|---|
| A | 7570 | 7516 | 1 | 1 | 0.01% | 0.01% | 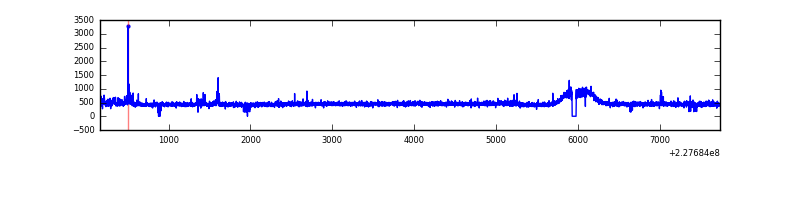 |
| B | 7570 | 7516 | 8 | 8 | 0.11% | 0.11% | 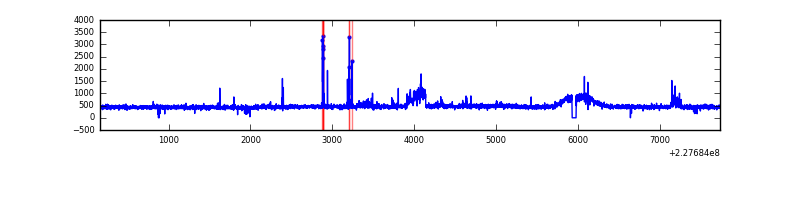 |
| C | 7570 | 7515 | 0 | 0 | 0.00% | 0.00% | 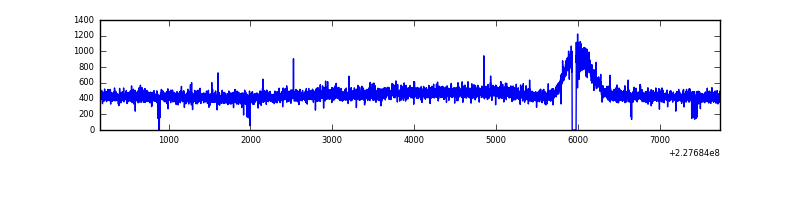 |
| D | 7570 | 7512 | 22 | 22 | 0.29% | 0.29% | 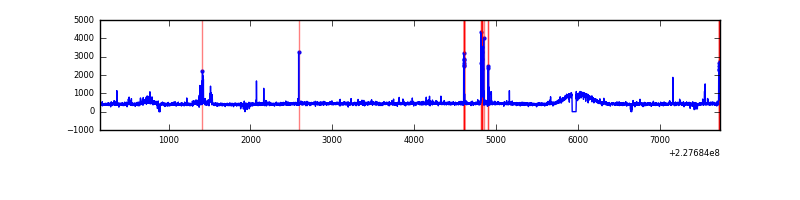 |
Top three noisy pixels from each quadrant. If the there are fewer than three noisy pixels in the level2.evt file, extra rows are filled as -1
| Pixel properties | Quadrant properties | ||||||
|---|---|---|---|---|---|---|---|
| Quadrant | DetID | PixID | Counts | Sigma | Mean | Median | Sigma |
| A | 15 | 239 | 68662 | 371.1 | 886 | 867 | 182.7 |
| A | 0 | 128 | 10953 | 55.21 | 886 | 867 | 182.7 |
| A | 0 | 226 | 8192 | 40.1 | 886 | 867 | 182.7 |
| B | 5 | 250 | 143318 | 815.01 | 890 | 864 | 174.8 |
| B | 11 | 51 | 31192 | 173.51 | 890 | 864 | 174.8 |
| B | 0 | 168 | 25936 | 143.44 | 890 | 864 | 174.8 |
| C | 1 | 16 | 36642 | 176.35 | 867 | 871 | 202.8 |
| C | 8 | 128 | 16490 | 77.0 | 867 | 871 | 202.8 |
| C | 8 | 112 | 6836 | 29.41 | 867 | 871 | 202.8 |
| D | 1 | 52 | 90339 | 384.13 | 858 | 839 | 233.0 |
| D | 2 | 152 | 86484 | 367.59 | 858 | 839 | 233.0 |
| D | 13 | 169 | 47947 | 202.19 | 858 | 839 | 233.0 |
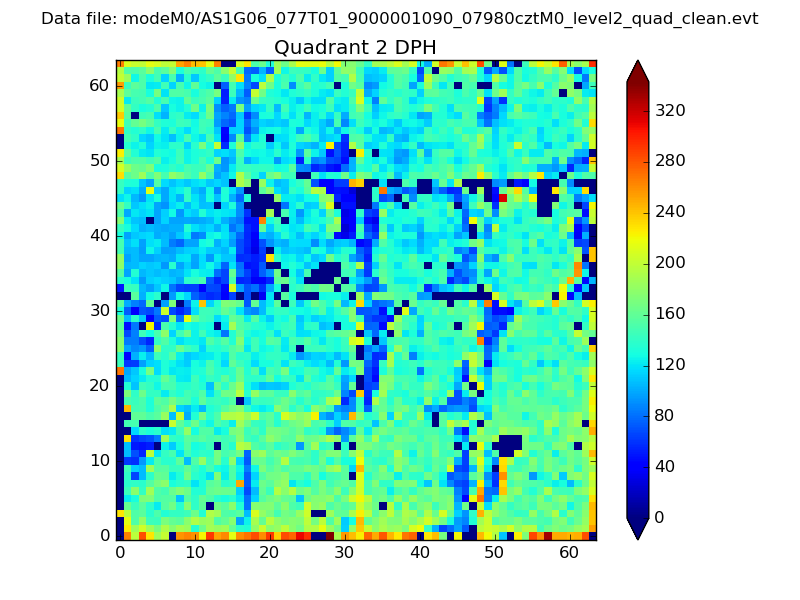
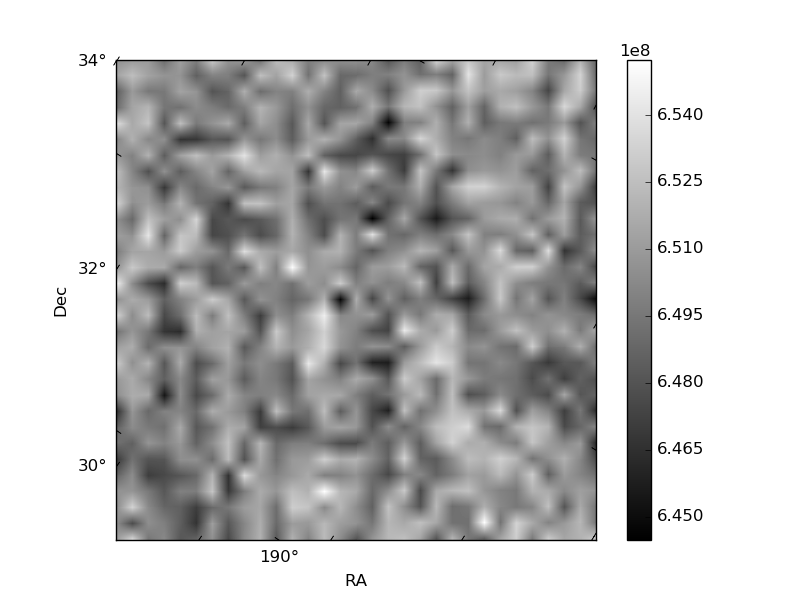
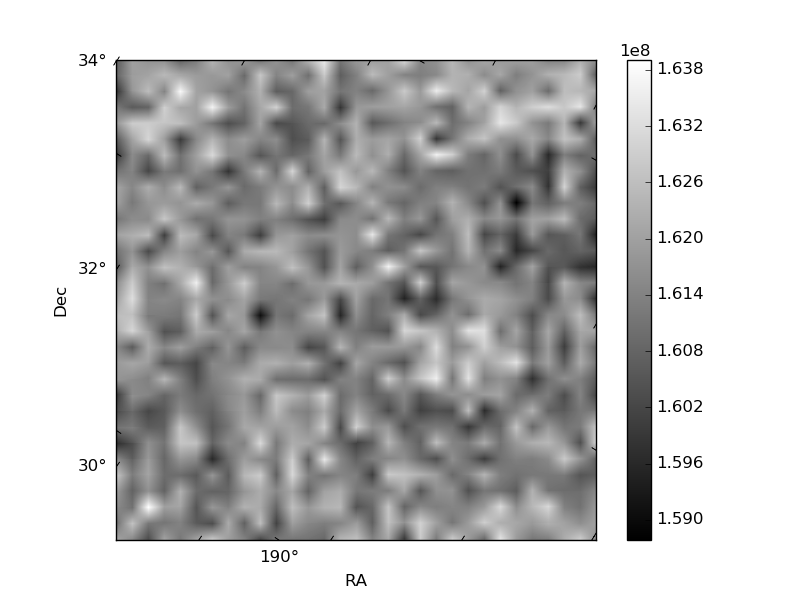
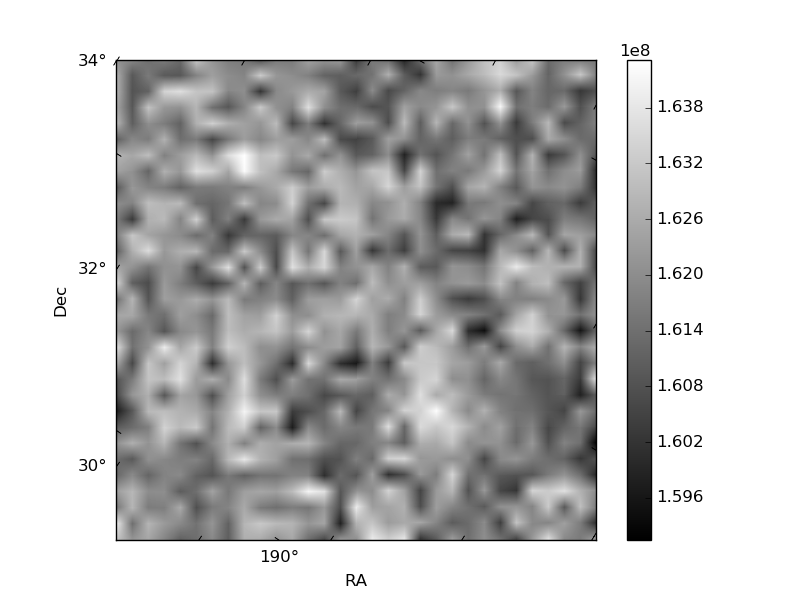
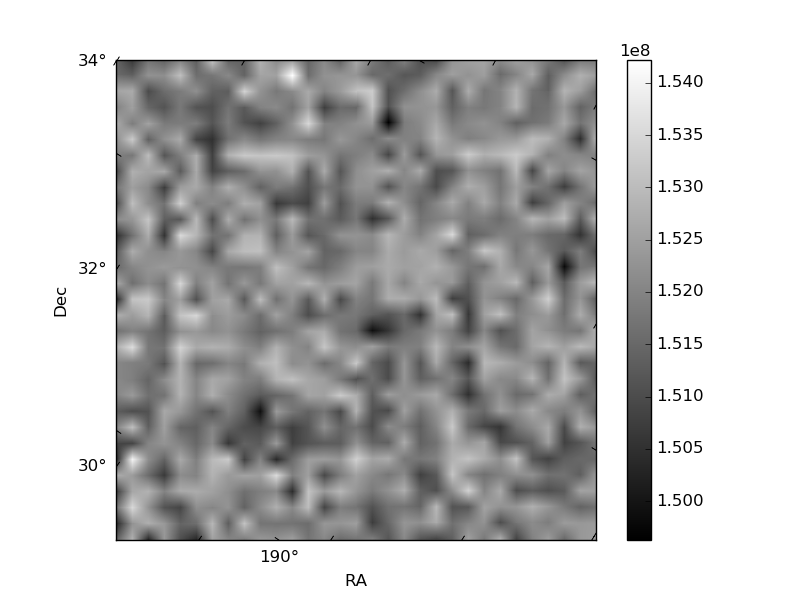
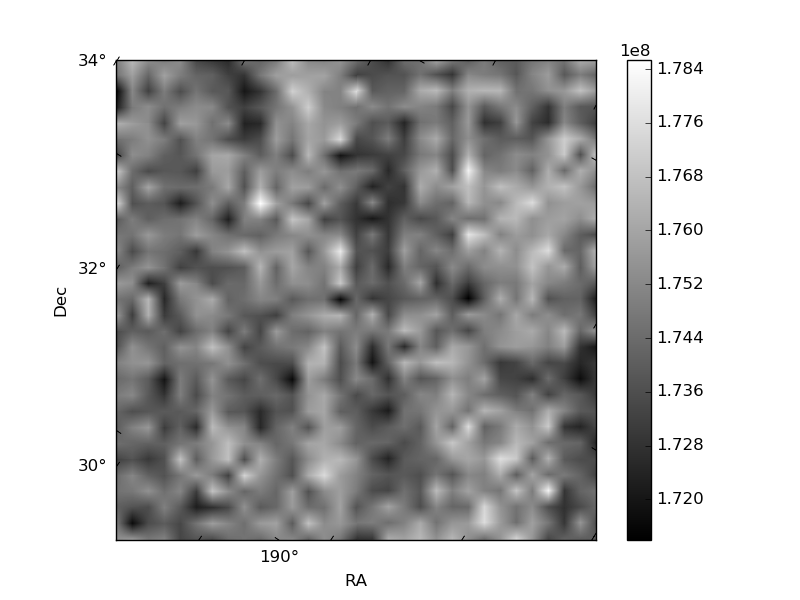
Histogram calculated using DETX and DETY for each event in the final _common_clean file
| Quadrant A | 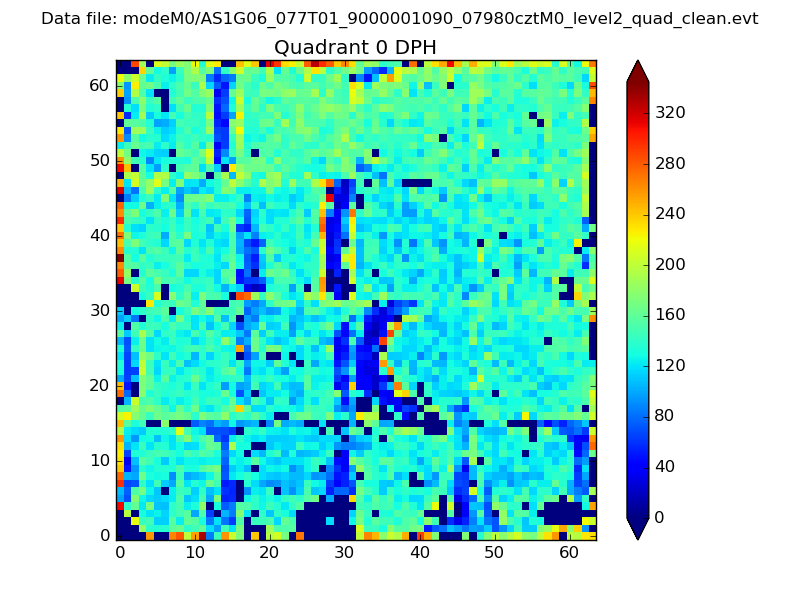 |
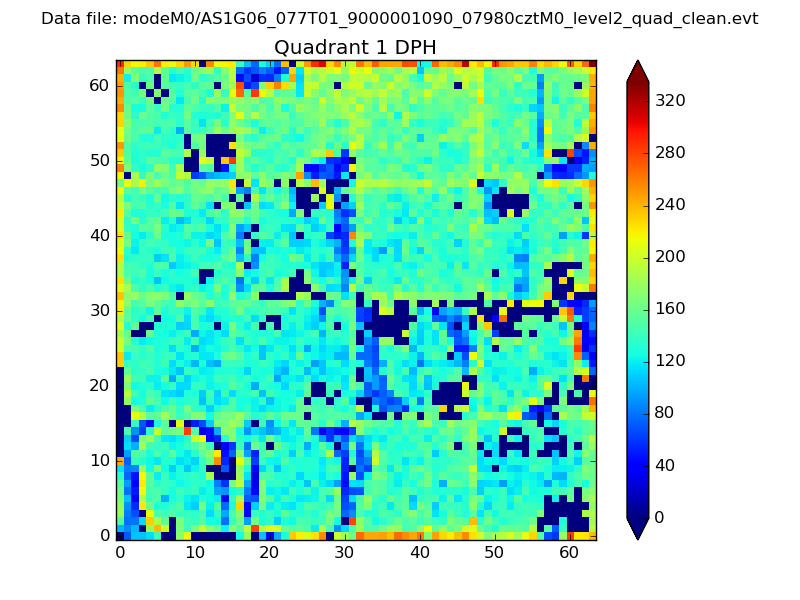 |
Quadrant B |
|---|---|---|---|
| Quadrant D | 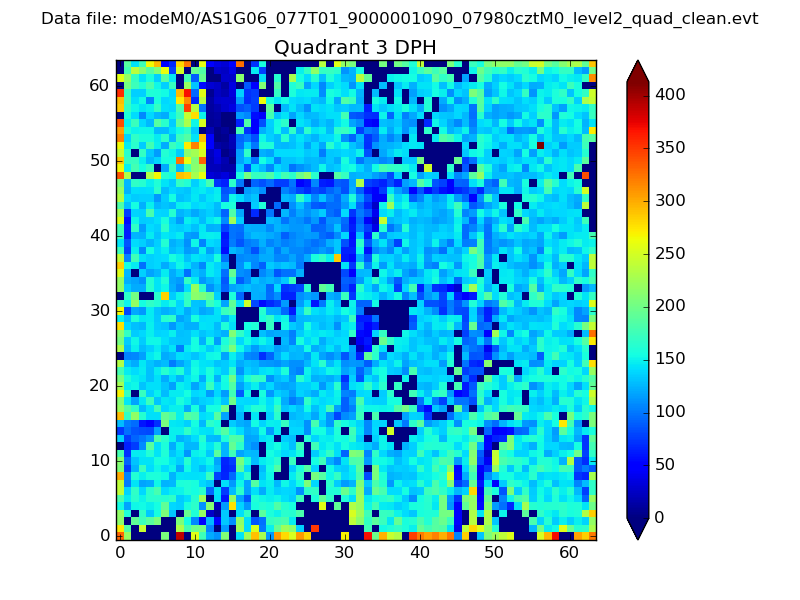 |
 |
Quadrant C |
| Plot type | Count rate plots | Images |
|---|---|---|
| Comparison with Poisson distribution Blue bars denote a histogram of data divided into 1 sec bins. Red curve is a Poisson curve with rate = median count rate of data. |
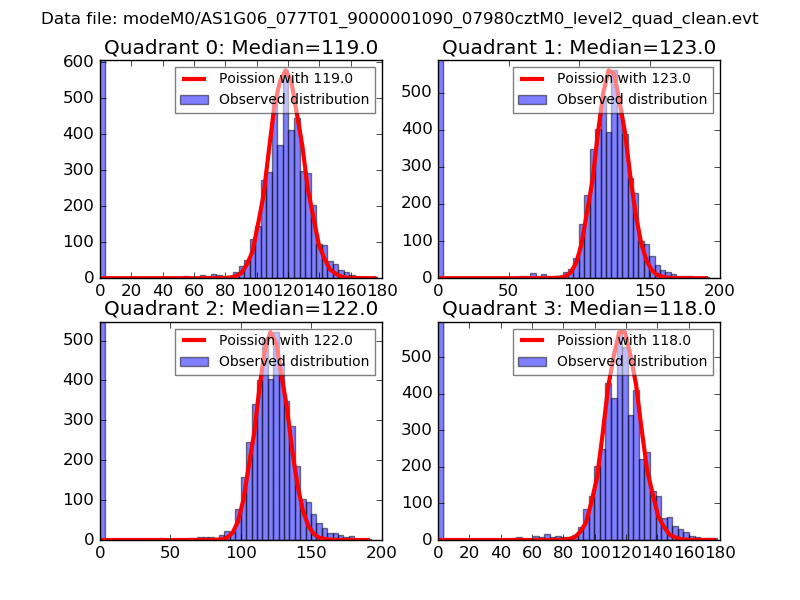 |
 |
| Quadrant-wise count rates Data is divided into 100 sec bins |
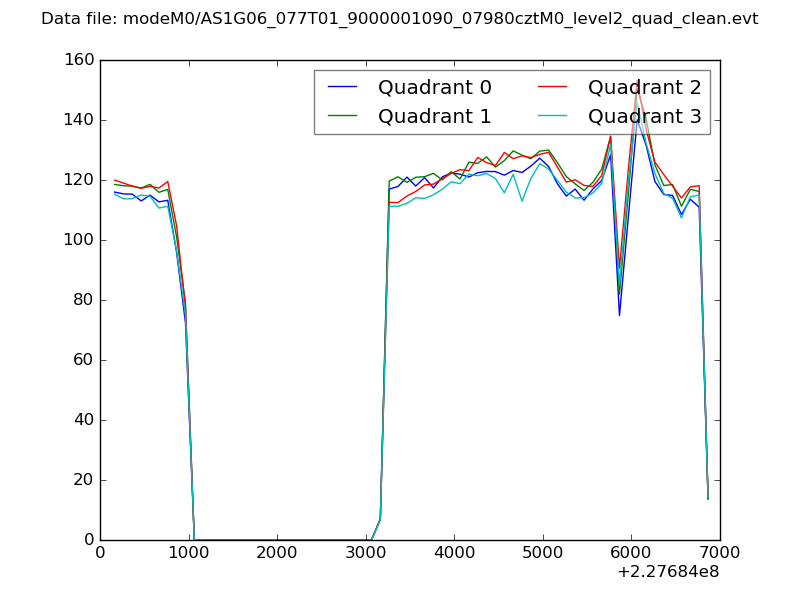 |
|
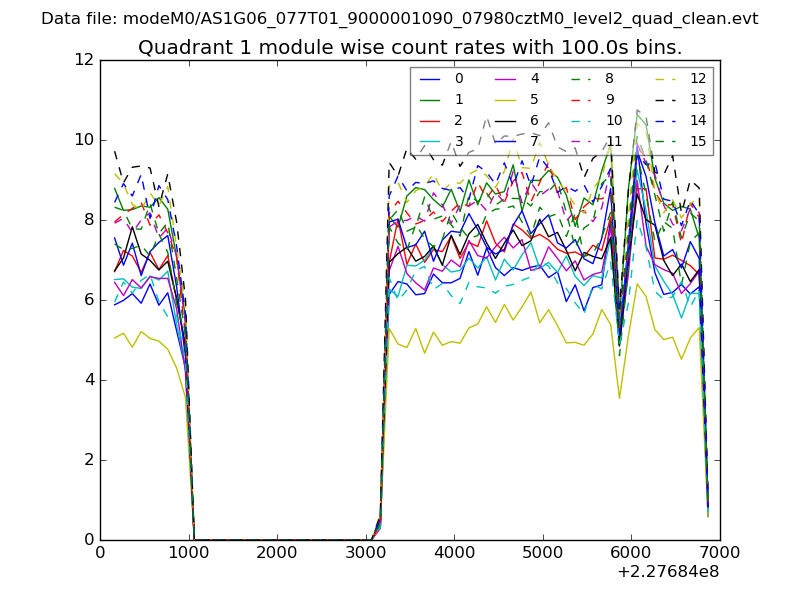
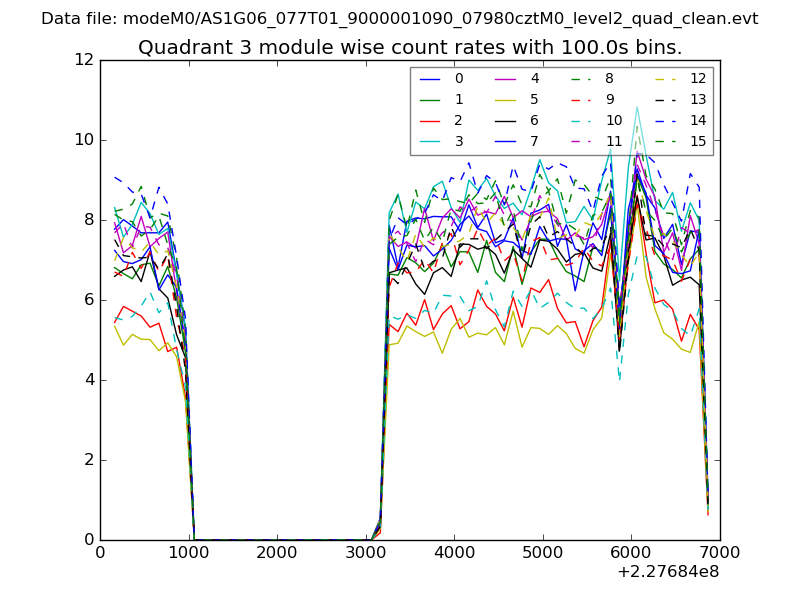
| Module-wise count rates for Quadrant A Data is divided into 100 sec bins |
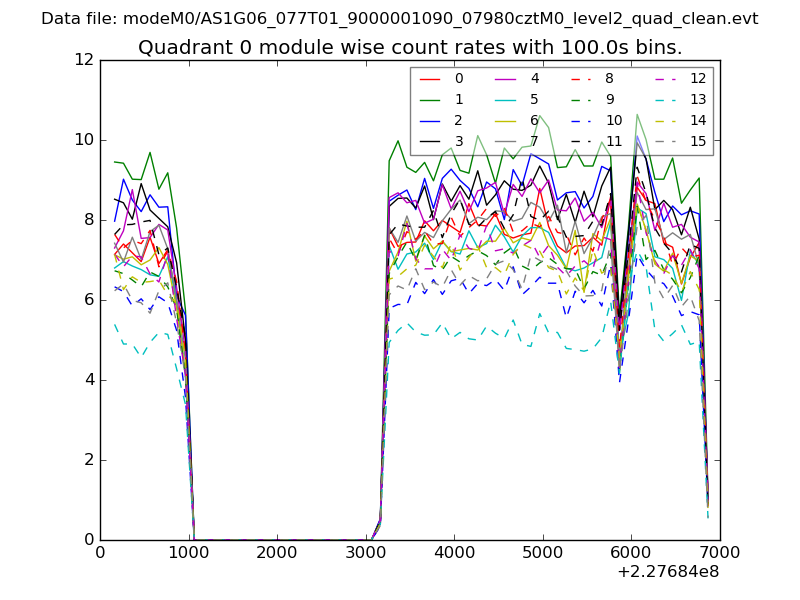 |
 |
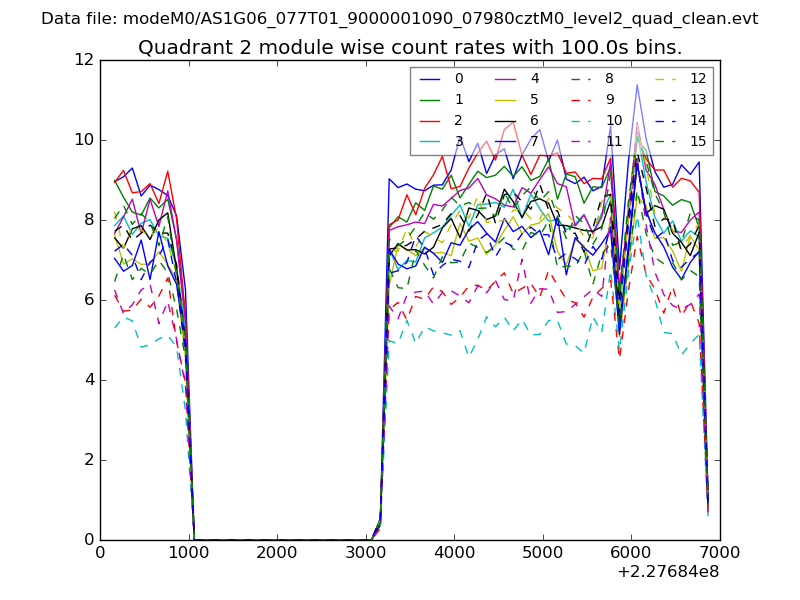
| Module-wise count rates for Quadrant B Data is divided into 100 sec bins |
 |
 |
| Module-wise count rates for Quadrant C Data is divided into 100 sec bins |
 |
 |
| Module-wise count rates for Quadrant D Data is divided into 100 sec bins |
 |
 |
| Parameter | Plot |
|---|---|
| CZT HV Monitor | 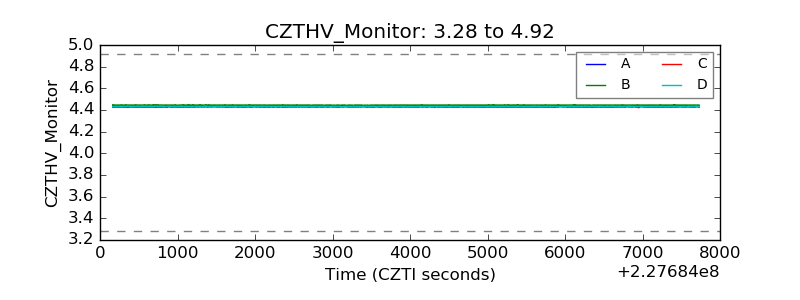 |
| D_VDD | 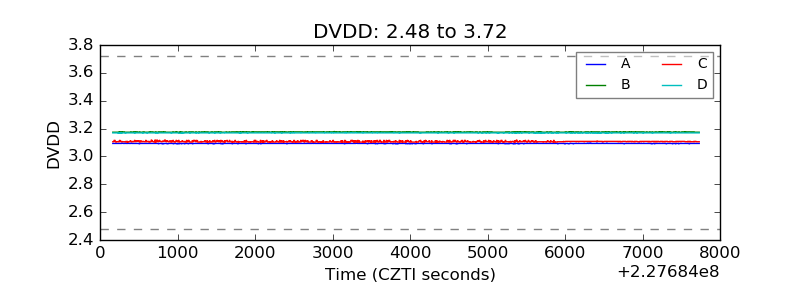 |
| Temperature 1 | 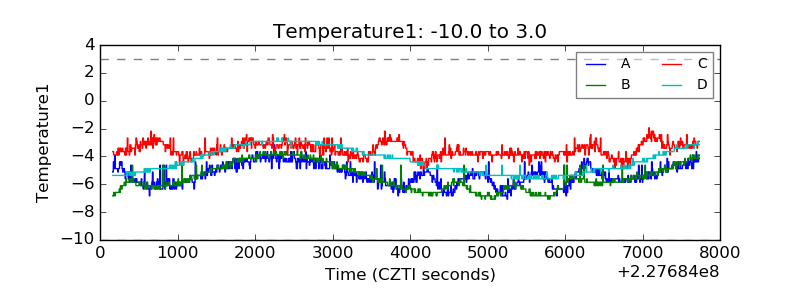 |
| Veto HV Monitor | 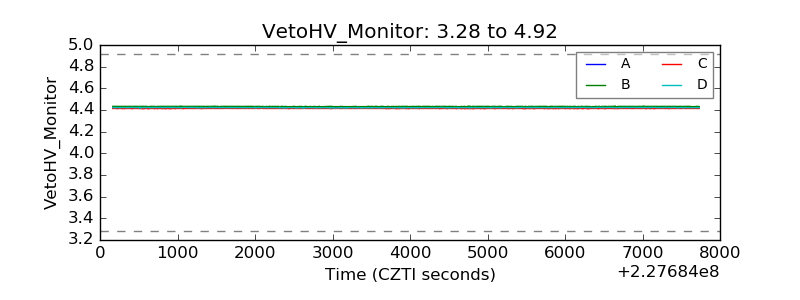 |
| Veto LLD | 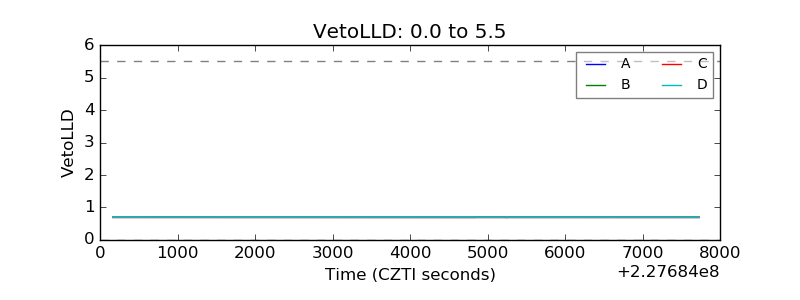 |
| Alpha Counter | 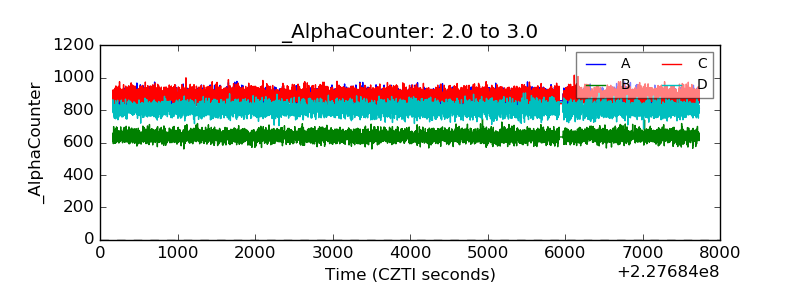 |
| _CPM_Rate | 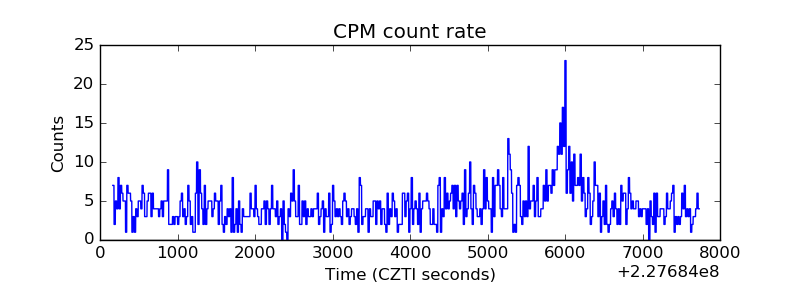 |
| CZT Counter | 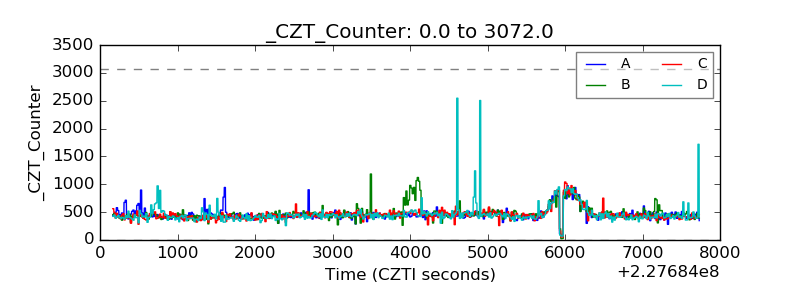 |
| +2.5 Volts monitor |  |
| +5 Volts monitor |  |
| _ROLL_ROT | 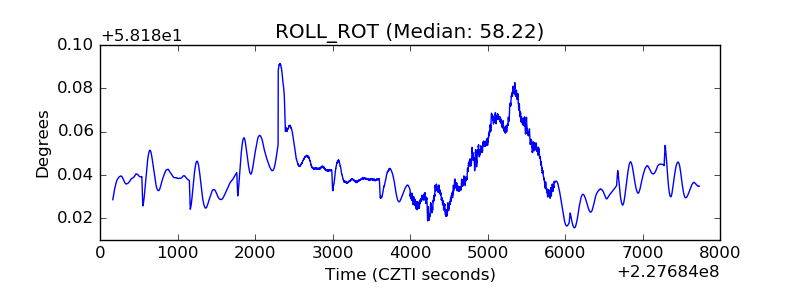 |
| _Roll_DEC | 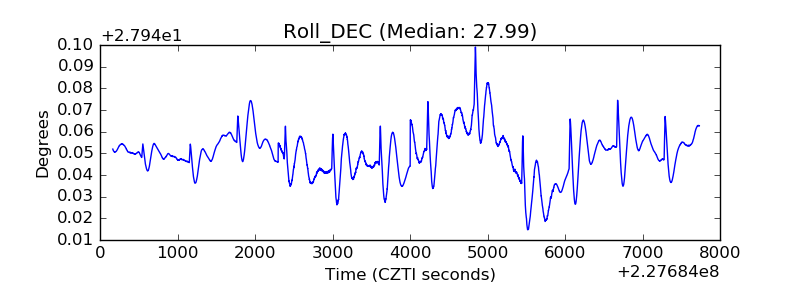 |
| _Roll_RA | 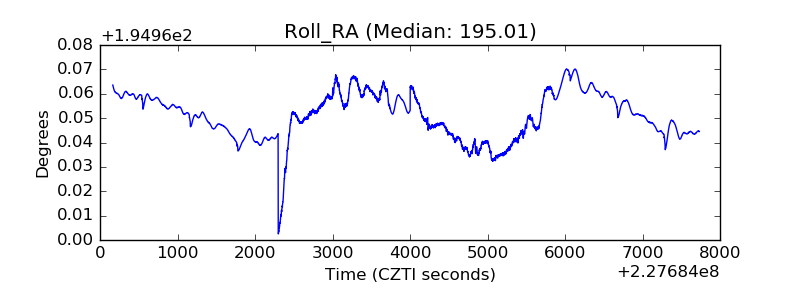 |
| Veto Counter | 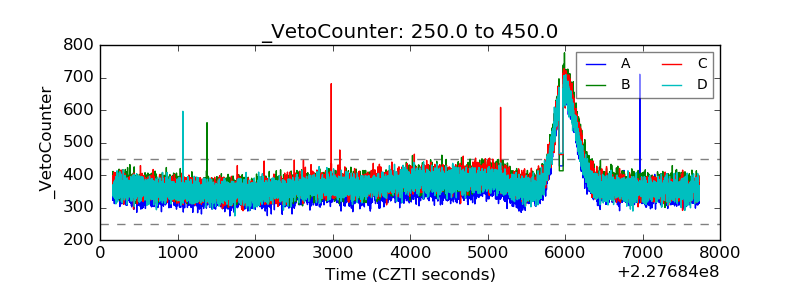 |