| Param | Original file | Final file |
|---|---|---|
| Filename | modeM0/AS1G06_077T01_9000001090_07981cztM0_level2.evt | modeM0/AS1G06_077T01_9000001090_07981cztM0_level2_quad_clean.evt |
| Size (bytes) | 563,227,200 | 87,088,320 |
| Size | 537.1 MB | 83.1 MB |
| Events in quadrant A | 4,043,310 | 516,819 |
| Events in quadrant B | 3,842,414 | 536,972 |
| Events in quadrant C | 3,850,554 | 535,610 |
| Events in quadrant D | 4,784,678 | 498,151 |
| Mode SS | |||
|---|---|---|---|
| Quadrant | BADHDUFLAG | Total packets | Discarded packets |
| A | 0 | 162 | 0 |
| B | 0 | 162 | 0 |
| C | 0 | 162 | 0 |
| D | 0 | 162 | 0 |
| Mode M0 | |||
|---|---|---|---|
| Quadrant | BADHDUFLAG | Total packets | Discarded packets |
| A | 0 | 17176 | 10 |
| B | 0 | 16643 | 2 |
| C | 0 | 16805 | 2 |
| D | 0 | 19684 | 4 |
| Mode M9 | |||
|---|---|---|---|
| Quadrant | BADHDUFLAG | Total packets | Discarded packets |
| A | 0 | 3 | 0 |
| B | 0 | 3 | 0 |
| C | 0 | 3 | 0 |
| D | 0 | 3 | 0 |
| Quadrant | Total seconds | Saturated seconds | Saturation percentage |
|---|---|---|---|
| A | 7889 | 351 | 4.449233% |
| B | 7892 | 341 | 4.320831% |
| C | 7892 | 257 | 3.256462% |
| D | 7891 | 520 | 6.589786% |
Noise dominated data is calculated using 1-second bins in cleaned event files. If a bin has >2000 counts, and if more than 50% of those come from <1% of pixels, then it is considered to be noise-dominated and hence unusable.
| Quadrant | # 1 sec bins | Bins with >0 counts | Bins with >2000 counts | High rate bins dominated by noise | Noise dominated (total time) | Noise dominated (detector-on time) | Marked lightcurve |
|---|---|---|---|---|---|---|---|
| A | 8267 | 7894 | 6 | 6 | 0.07% | 0.08% | 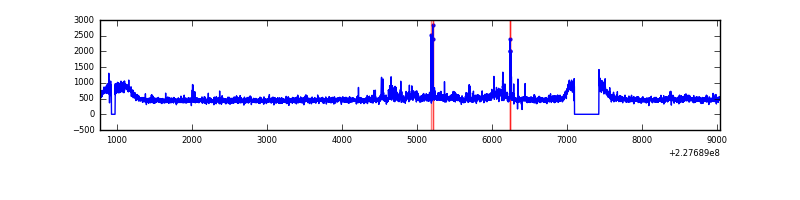 |
| B | 8267 | 7894 | 2 | 2 | 0.02% | 0.03% | 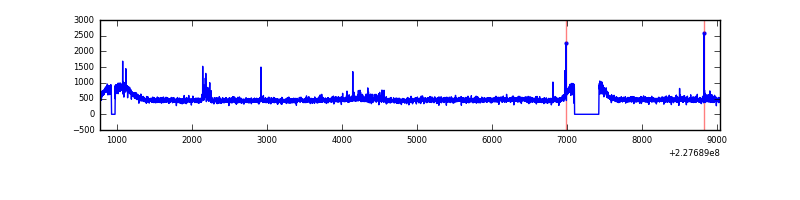 |
| C | 8267 | 7894 | 0 | 0 | 0.00% | 0.00% | 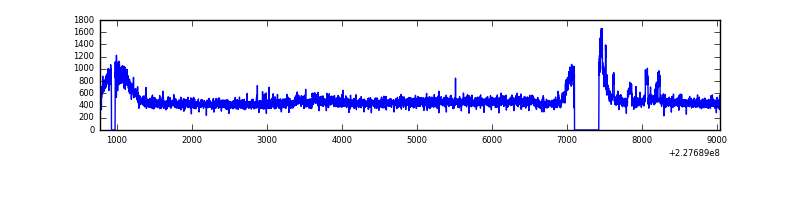 |
| D | 8267 | 7894 | 206 | 206 | 2.49% | 2.61% | 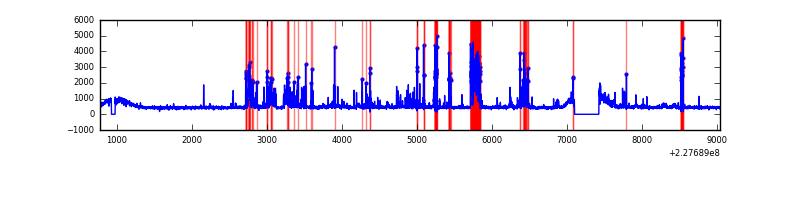 |
Top three noisy pixels from each quadrant. If the there are fewer than three noisy pixels in the level2.evt file, extra rows are filled as -1
| Pixel properties | Quadrant properties | ||||||
|---|---|---|---|---|---|---|---|
| Quadrant | DetID | PixID | Counts | Sigma | Mean | Median | Sigma |
| A | 0 | 128 | 219766 | 1099.59 | 963 | 941 | 199.0 |
| A | 15 | 239 | 72003 | 357.09 | 963 | 941 | 199.0 |
| A | 13 | 251 | 24018 | 115.96 | 963 | 941 | 199.0 |
| B | 0 | 168 | 31048 | 157.66 | 966 | 938 | 191.0 |
| B | 11 | 51 | 27233 | 137.69 | 966 | 938 | 191.0 |
| B | 12 | 111 | 21959 | 110.07 | 966 | 938 | 191.0 |
| C | 1 | 16 | 181122 | 813.74 | 940 | 941 | 221.4 |
| C | 13 | 61 | 7016 | 27.44 | 940 | 941 | 221.4 |
| C | 8 | 222 | 3485 | 11.49 | 940 | 941 | 221.4 |
| D | 1 | 52 | 1134286 | 4965.88 | 928 | 898 | 228.2 |
| D | 5 | 97 | 79983 | 346.51 | 928 | 898 | 228.2 |
| D | 13 | 169 | 56080 | 241.78 | 928 | 898 | 228.2 |
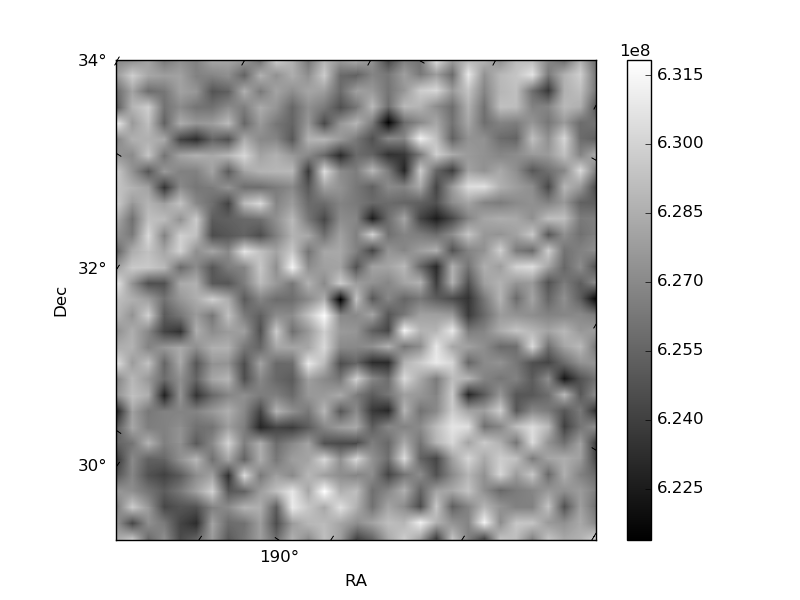
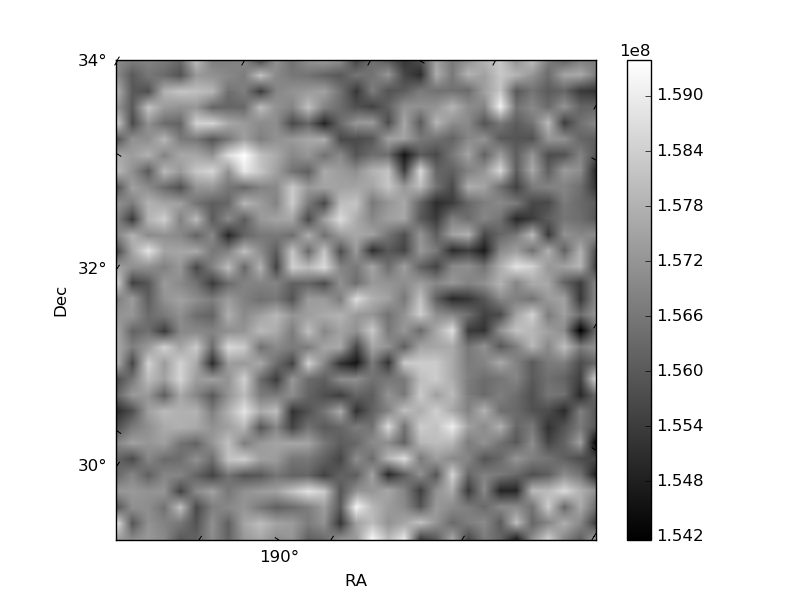
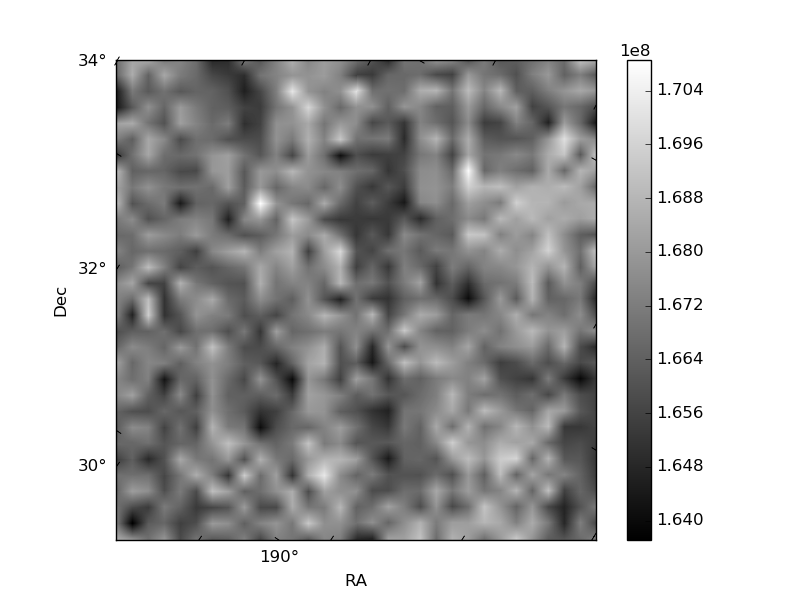
Histogram calculated using DETX and DETY for each event in the final _common_clean file
| Quadrant A | 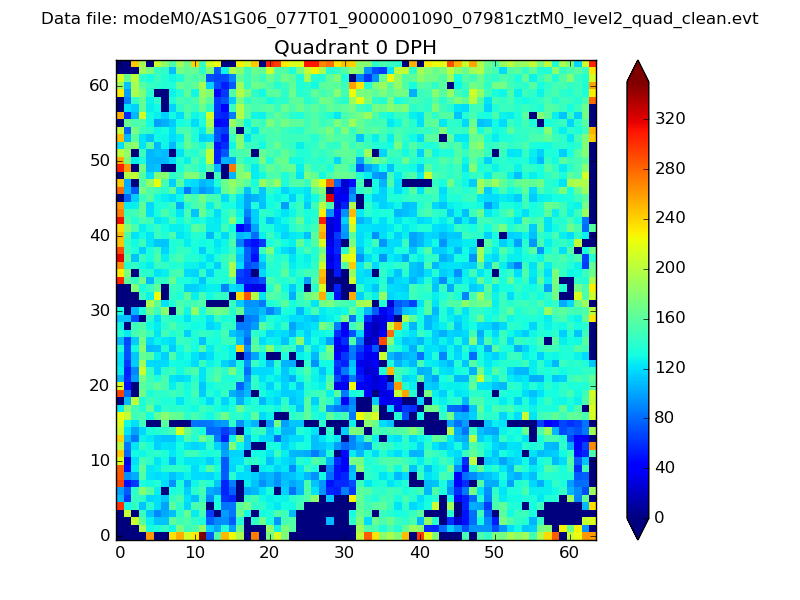 |
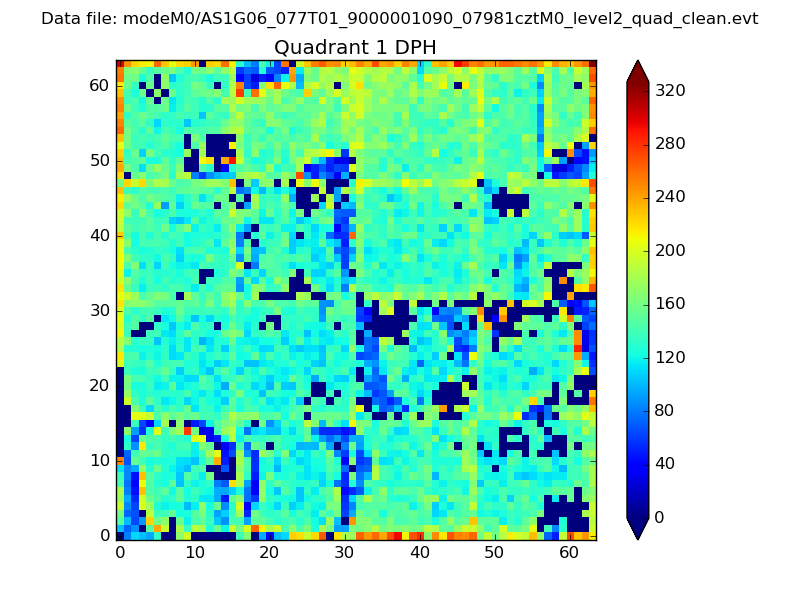 |
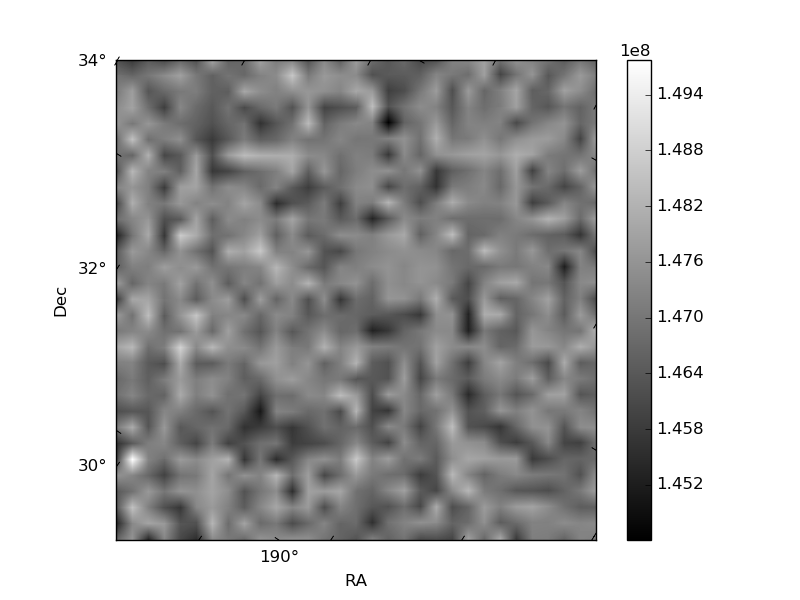
Quadrant B |
|---|---|---|---|
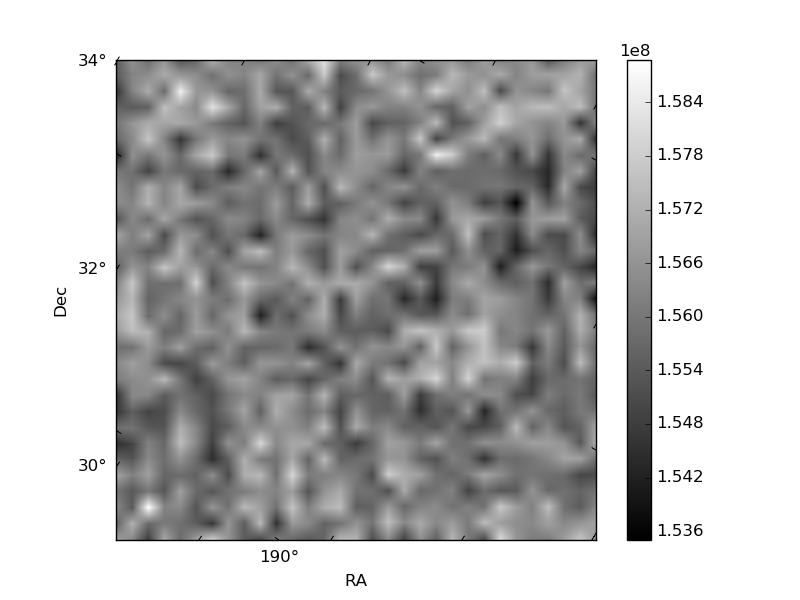
| Quadrant D | 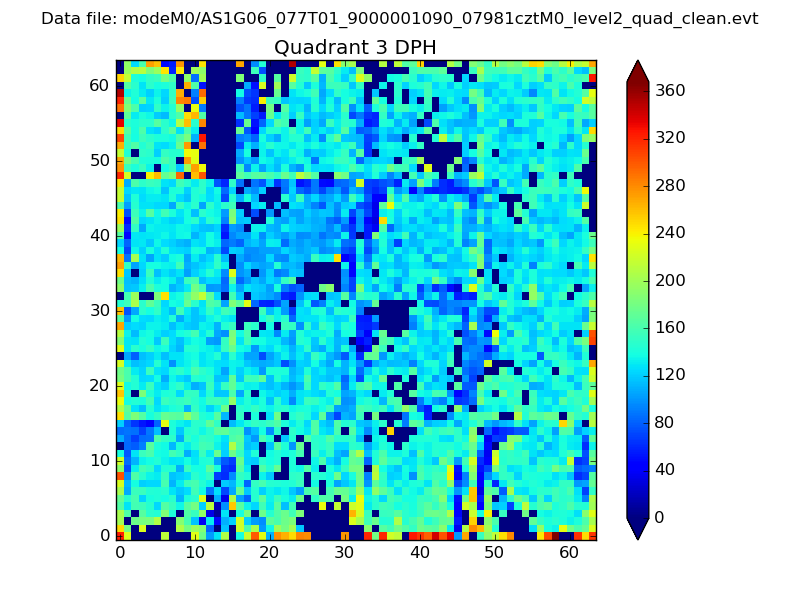 |
 |
Quadrant C |
| Plot type | Count rate plots | Images |
|---|---|---|
| Comparison with Poisson distribution Blue bars denote a histogram of data divided into 1 sec bins. Red curve is a Poisson curve with rate = median count rate of data. |
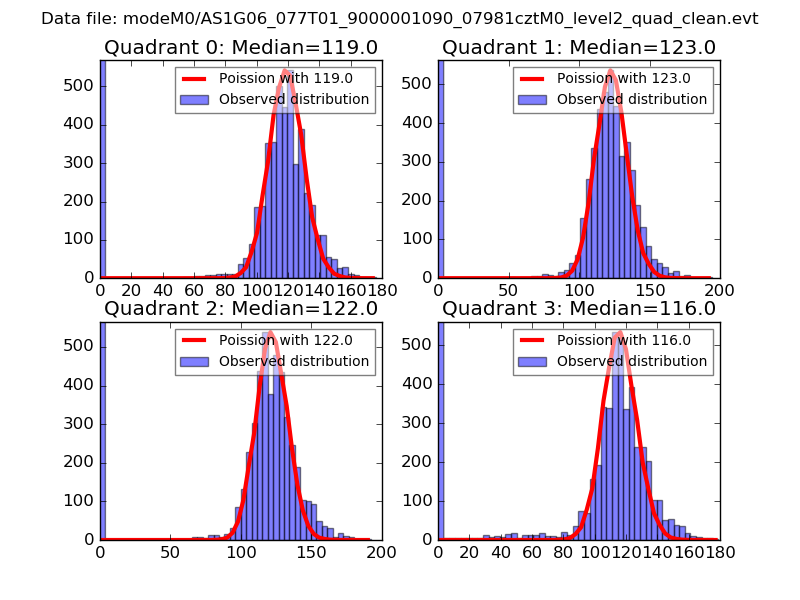 |
 |
| Quadrant-wise count rates Data is divided into 100 sec bins |
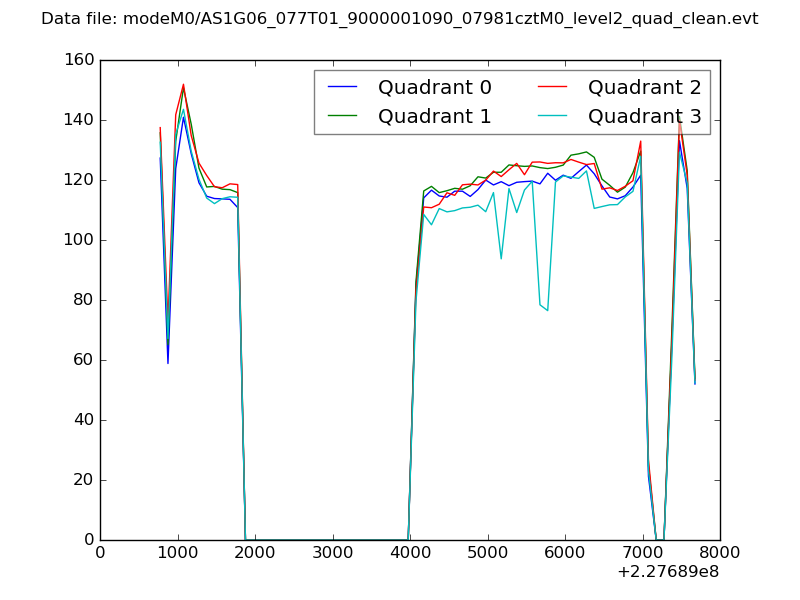 |
|
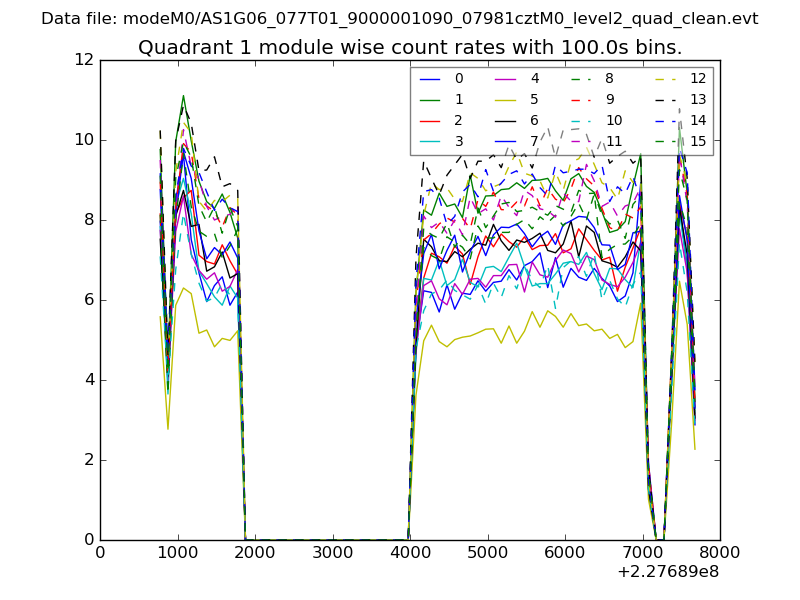
| Module-wise count rates for Quadrant A Data is divided into 100 sec bins |
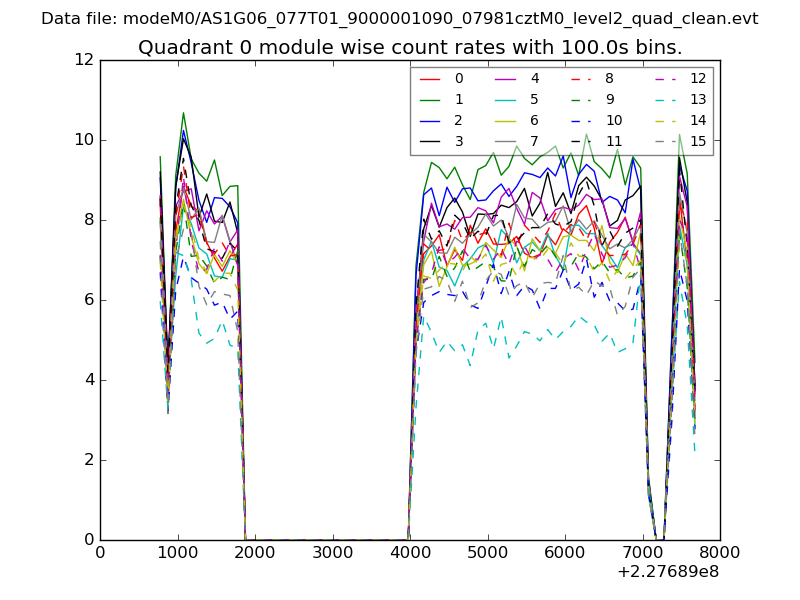 |
 |
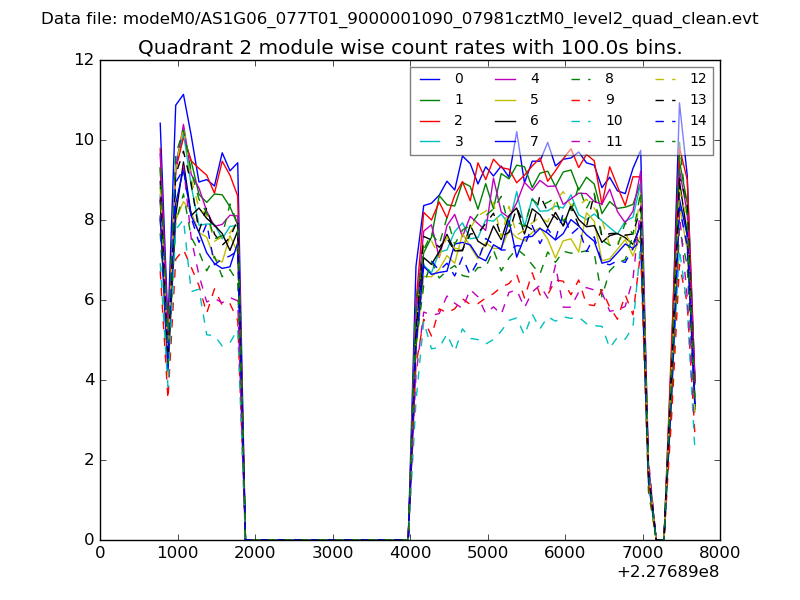
| Module-wise count rates for Quadrant B Data is divided into 100 sec bins |
 |
 |
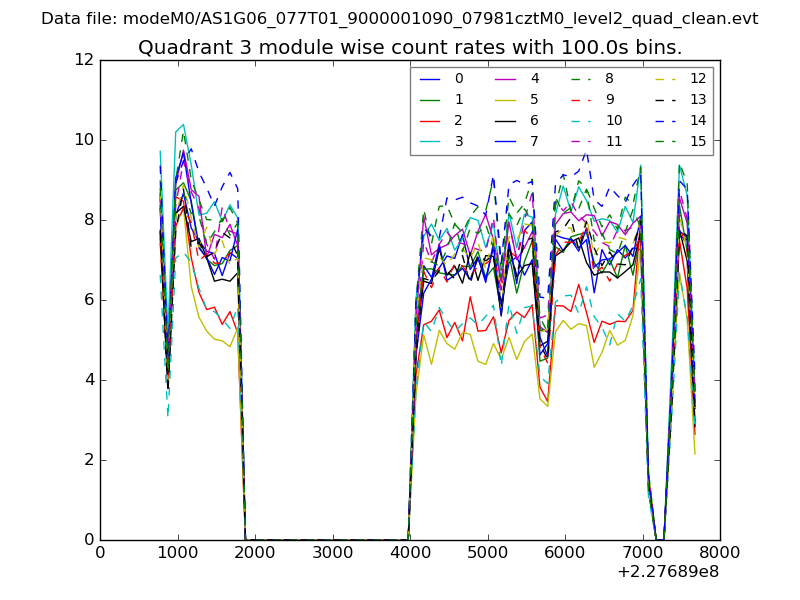
| Module-wise count rates for Quadrant C Data is divided into 100 sec bins |
 |
 |
| Module-wise count rates for Quadrant D Data is divided into 100 sec bins |
 |
 |
| Parameter | Plot |
|---|---|
| CZT HV Monitor | 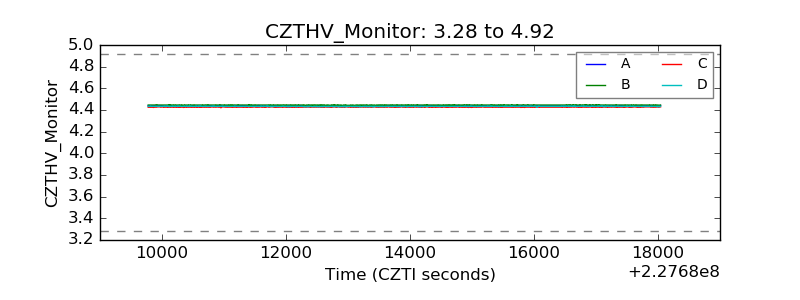 |
| D_VDD | 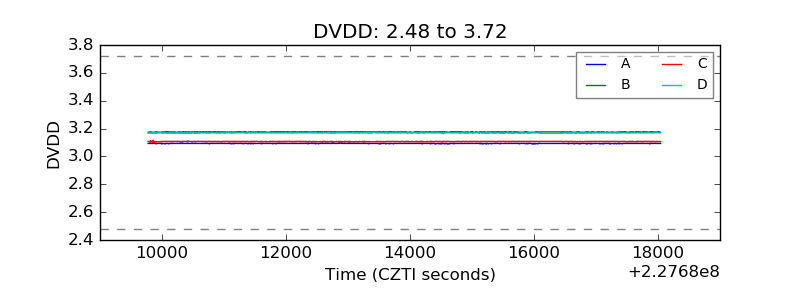 |
| Temperature 1 | 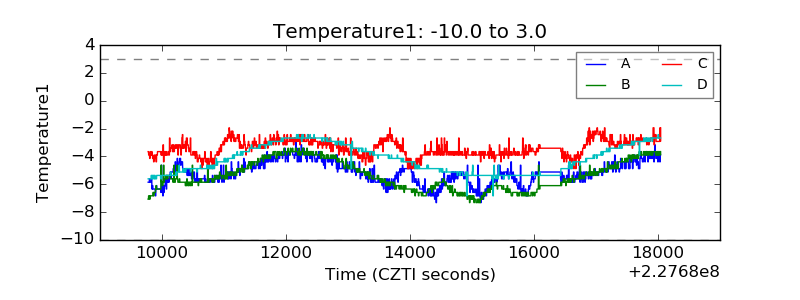 |
| Veto HV Monitor | 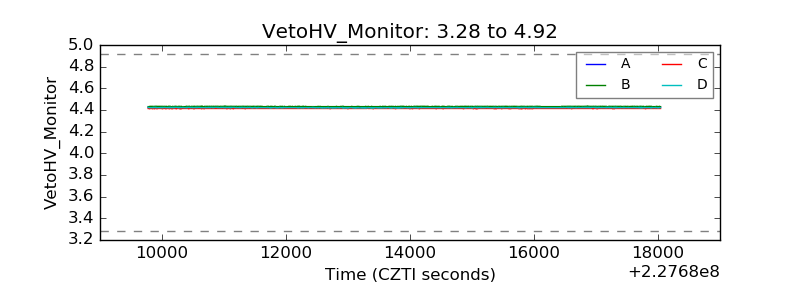 |
| Veto LLD | 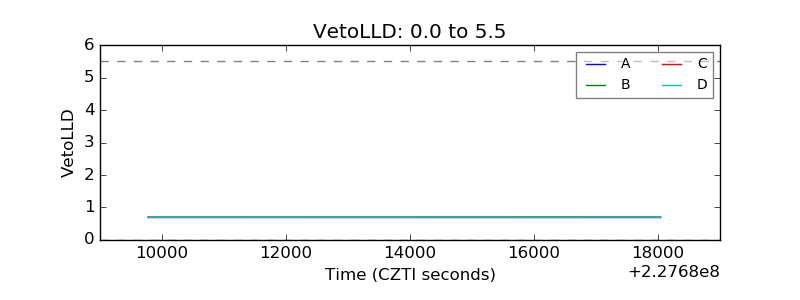 |
| Alpha Counter | 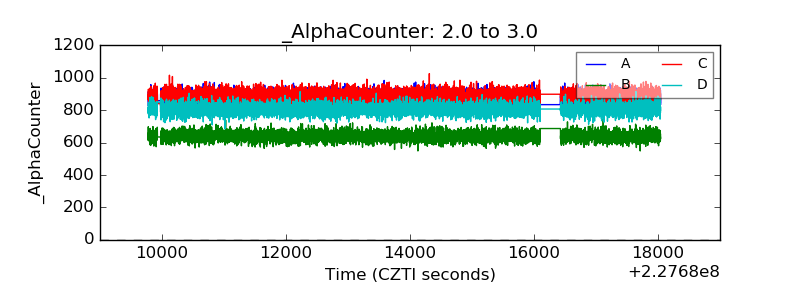 |
| _CPM_Rate |  |
| CZT Counter |  |
| +2.5 Volts monitor |  |
| +5 Volts monitor |  |
| _ROLL_ROT | 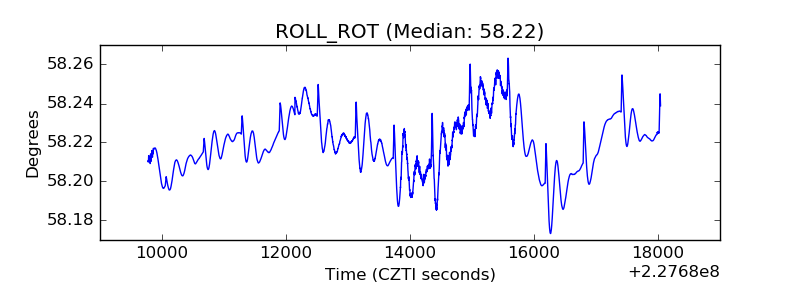 |
| _Roll_DEC | 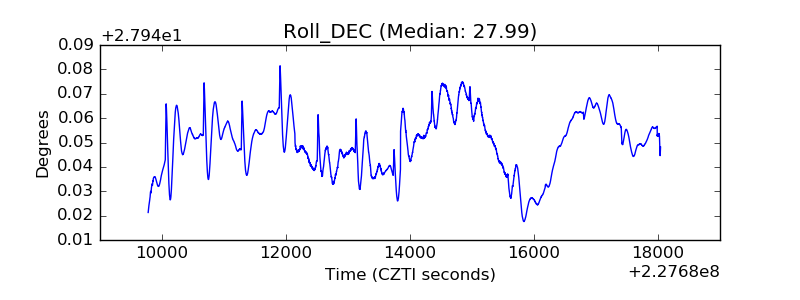 |
| _Roll_RA | 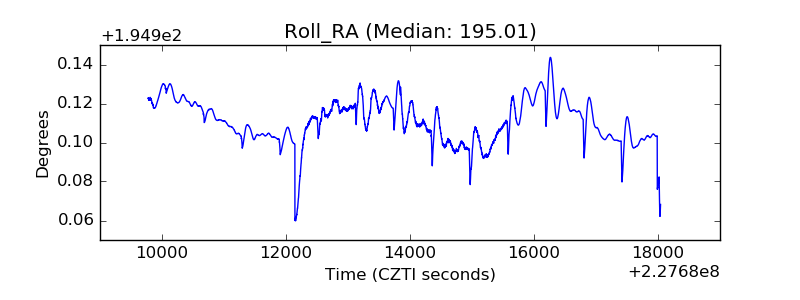 |
| Veto Counter | 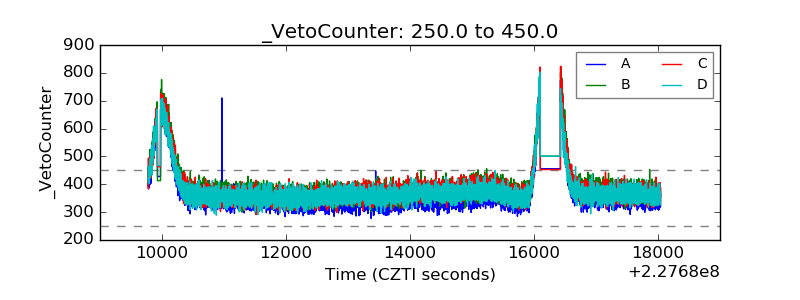 |