| Param | Original file | Final file |
|---|---|---|
| Filename | modeM0/AS1G06_077T01_9000001090_07983cztM0_level2.evt | modeM0/AS1G06_077T01_9000001090_07983cztM0_level2_quad_clean.evt |
| Size (bytes) | 1,063,224,000 | 136,923,840 |
| Size | 1014.0 MB | 130.6 MB |
| Events in quadrant A | 11,109,762 | 791,160 |
| Events in quadrant B | 6,248,802 | 836,795 |
| Events in quadrant C | 6,337,187 | 831,513 |
| Events in quadrant D | 7,639,784 | 802,777 |
| Mode SS | |||
|---|---|---|---|
| Quadrant | BADHDUFLAG | Total packets | Discarded packets |
| A | 0 | 260 | 0 |
| B | 0 | 260 | 0 |
| C | 0 | 260 | 0 |
| D | 0 | 260 | 0 |
| Mode M0 | |||
|---|---|---|---|
| Quadrant | BADHDUFLAG | Total packets | Discarded packets |
| A | 0 | 41624 | 29 |
| B | 0 | 26886 | 22 |
| C | 0 | 27011 | 9 |
| D | 0 | 31570 | 14 |
| Mode M9 | |||
|---|---|---|---|
| Quadrant | BADHDUFLAG | Total packets | Discarded packets |
| A | 0 | 13 | 0 |
| B | 0 | 13 | 0 |
| C | 0 | 13 | 0 |
| D | 0 | 13 | 0 |
| Quadrant | Total seconds | Saturated seconds | Saturation percentage |
|---|---|---|---|
| A | 12786 | 1541 | 12.052245% |
| B | 12787 | 271 | 2.119340% |
| C | 12794 | 162 | 1.266219% |
| D | 12792 | 650 | 5.081301% |
Noise dominated data is calculated using 1-second bins in cleaned event files. If a bin has >2000 counts, and if more than 50% of those come from <1% of pixels, then it is considered to be noise-dominated and hence unusable.
| Quadrant | # 1 sec bins | Bins with >0 counts | Bins with >2000 counts | High rate bins dominated by noise | Noise dominated (total time) | Noise dominated (detector-on time) | Marked lightcurve |
|---|---|---|---|---|---|---|---|
| A | 14052 | 12797 | 1076 | 1076 | 7.66% | 8.41% | 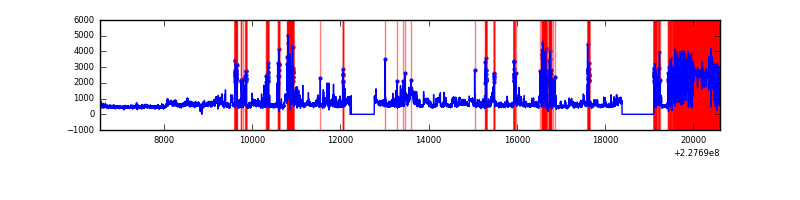 |
| B | 14052 | 12797 | 57 | 57 | 0.41% | 0.45% |  |
| C | 14052 | 12799 | 0 | 0 | 0.00% | 0.00% | 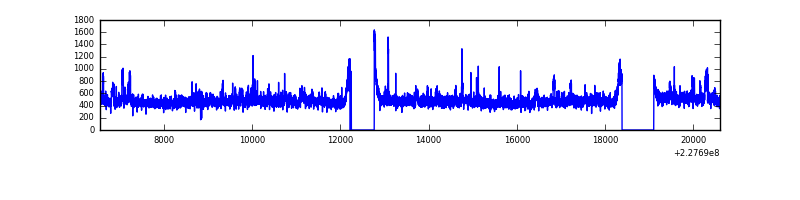 |
| D | 14052 | 12798 | 410 | 410 | 2.92% | 3.20% | 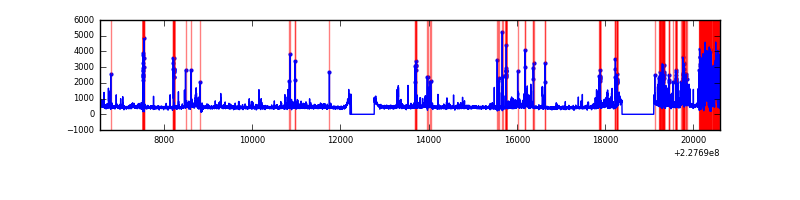 |
Top three noisy pixels from each quadrant. If the there are fewer than three noisy pixels in the level2.evt file, extra rows are filled as -1
| Pixel properties | Quadrant properties | ||||||
|---|---|---|---|---|---|---|---|
| Quadrant | DetID | PixID | Counts | Sigma | Mean | Median | Sigma |
| A | 0 | 128 | 4362224 | 15179.25 | 1409 | 1378 | 287.3 |
| A | 4 | 2 | 1300440 | 4521.78 | 1409 | 1378 | 287.3 |
| A | 0 | 226 | 13026 | 40.54 | 1409 | 1378 | 287.3 |
| B | 5 | 250 | 276569 | 936.87 | 1516 | 1480 | 293.6 |
| B | 11 | 51 | 47909 | 158.12 | 1516 | 1480 | 293.6 |
| B | 12 | 111 | 33619 | 109.46 | 1516 | 1480 | 293.6 |
| C | 1 | 16 | 577677 | 1683.2 | 1471 | 1477 | 342.3 |
| C | 13 | 61 | 11203 | 28.41 | 1471 | 1477 | 342.3 |
| C | 9 | 236 | 6335 | 14.19 | 1471 | 1477 | 342.3 |
| D | 1 | 52 | 2075390 | 5766.76 | 1440 | 1398 | 359.6 |
| D | 13 | 169 | 64523 | 175.52 | 1440 | 1398 | 359.6 |
| D | 2 | 234 | 40391 | 108.42 | 1440 | 1398 | 359.6 |
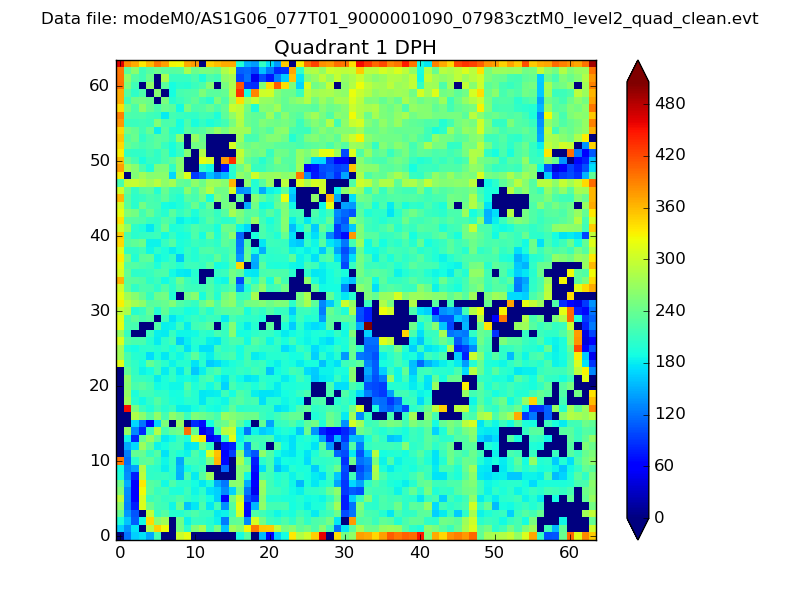
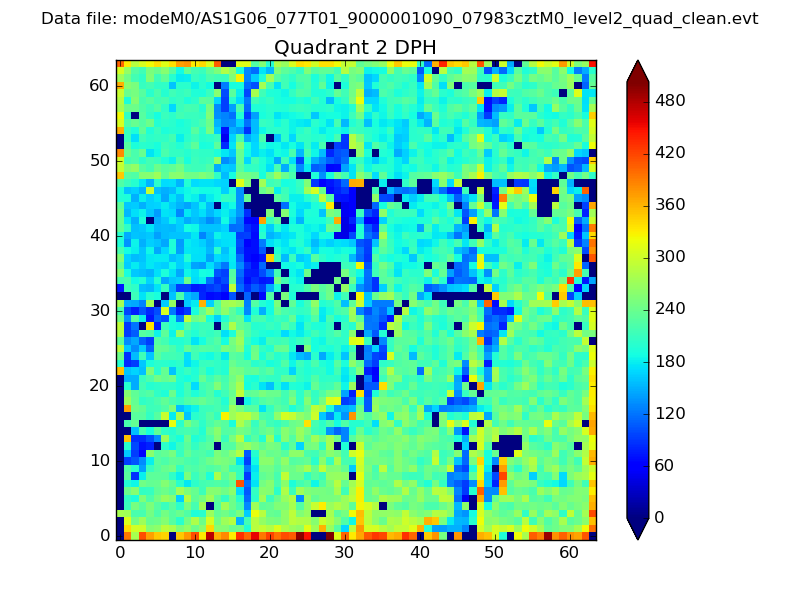
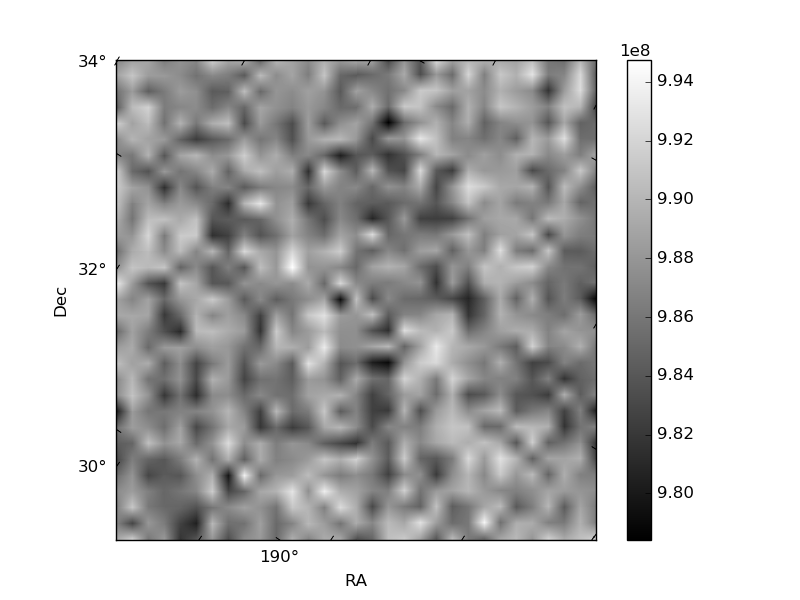
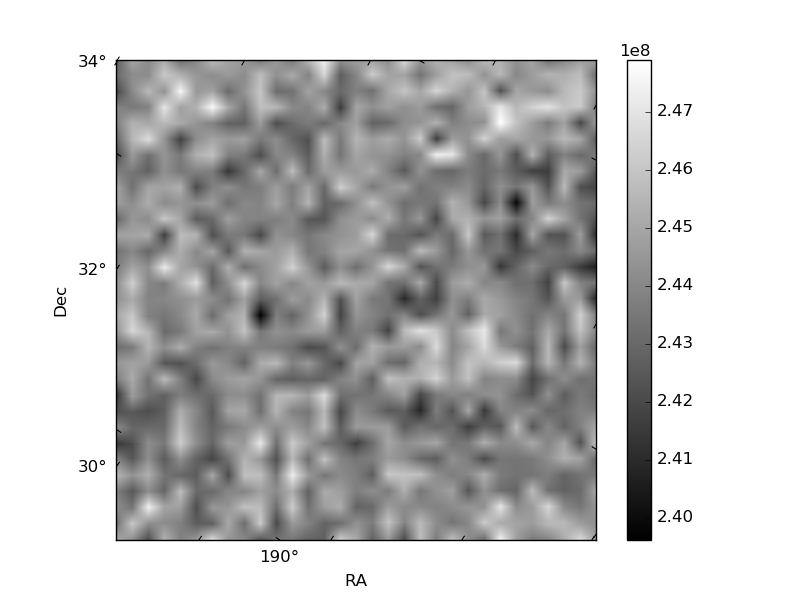
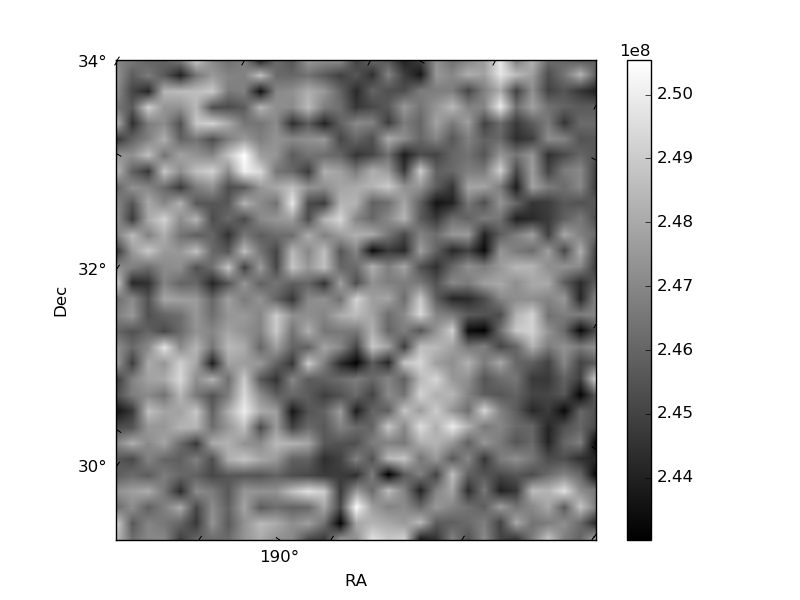
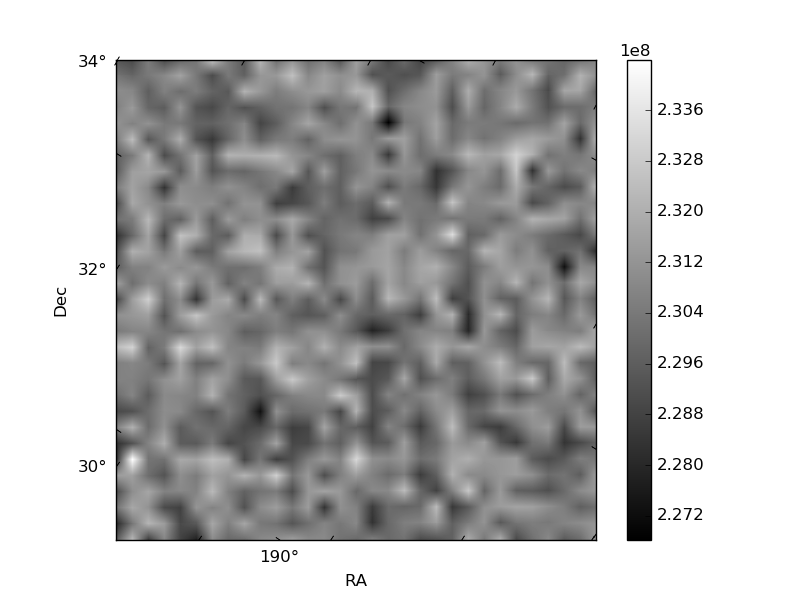
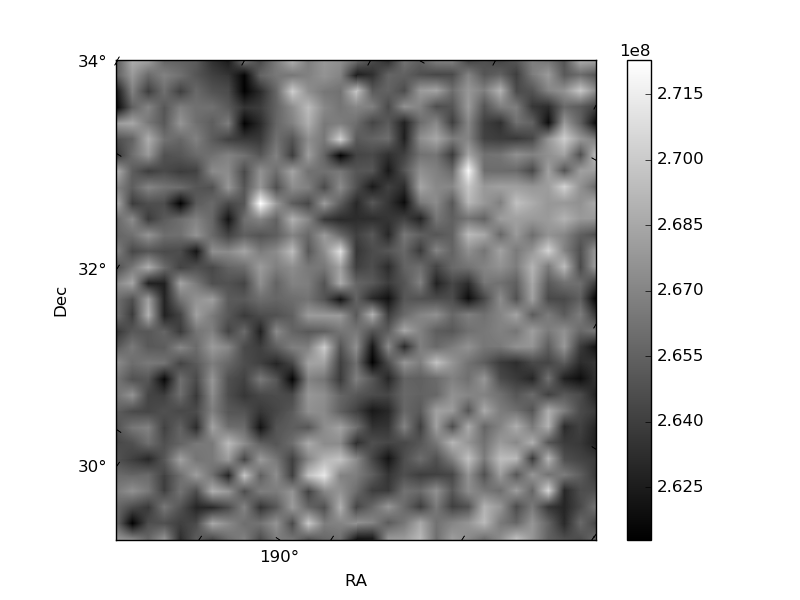
Histogram calculated using DETX and DETY for each event in the final _common_clean file
| Quadrant A | 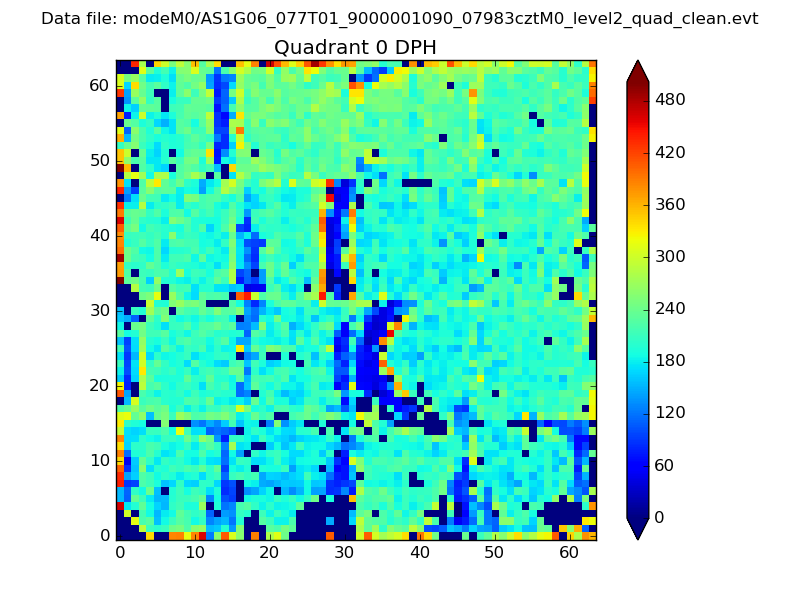 |
 |
Quadrant B |
|---|---|---|---|
| Quadrant D | 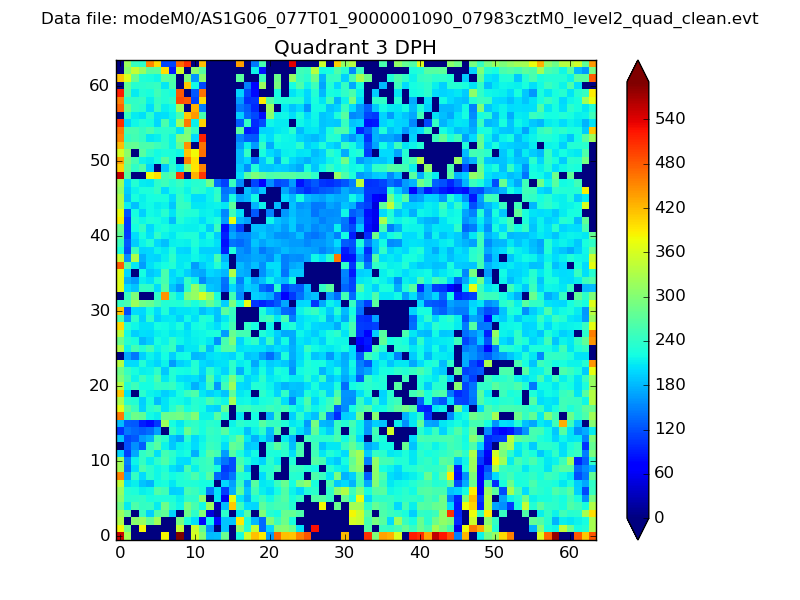 |
 |
Quadrant C |
| Plot type | Count rate plots | Images |
|---|---|---|
| Comparison with Poisson distribution Blue bars denote a histogram of data divided into 1 sec bins. Red curve is a Poisson curve with rate = median count rate of data. |
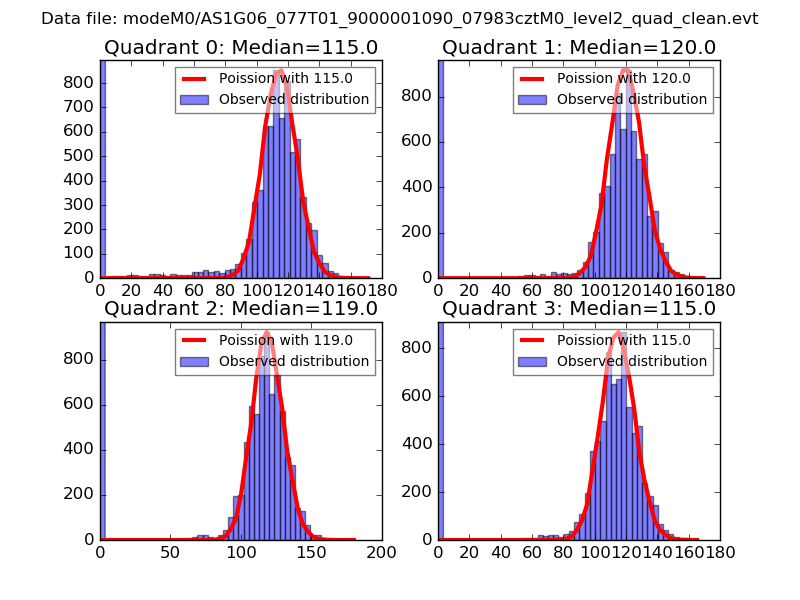 |
 |
| Quadrant-wise count rates Data is divided into 100 sec bins |
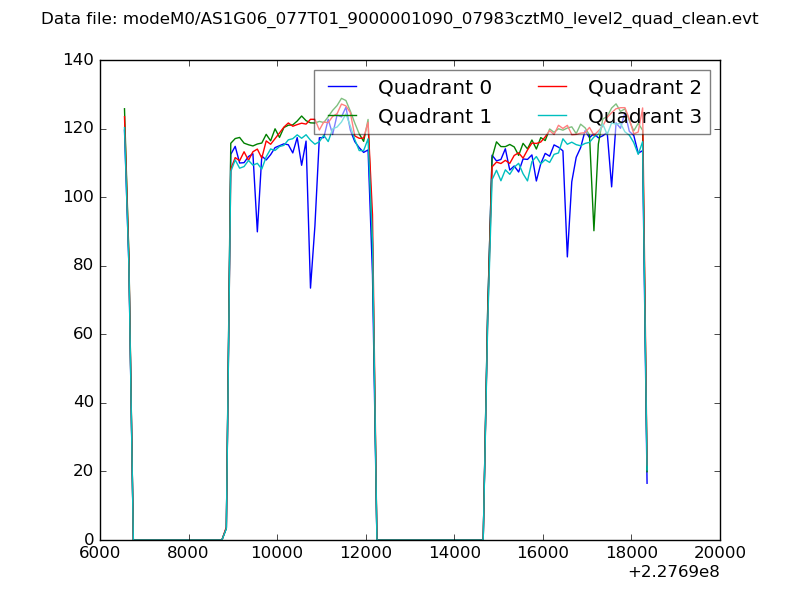 |
|
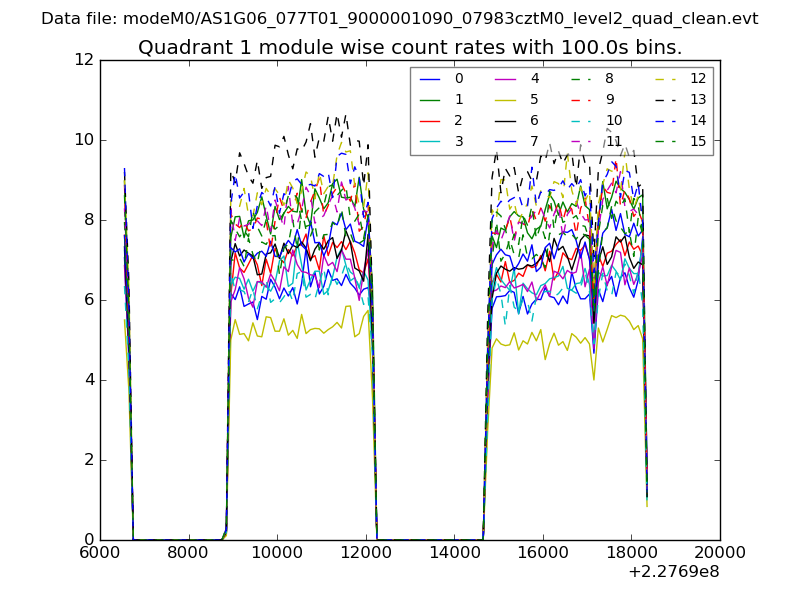
| Module-wise count rates for Quadrant A Data is divided into 100 sec bins |
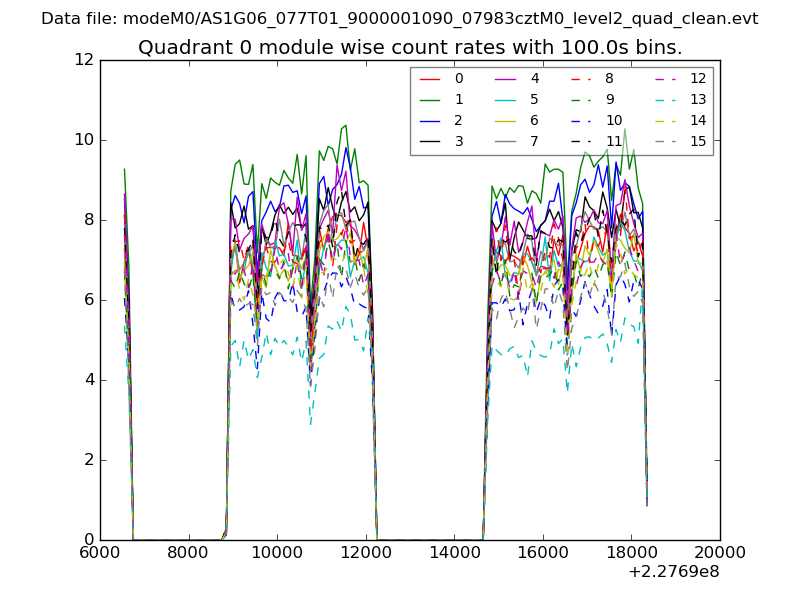 |
 |
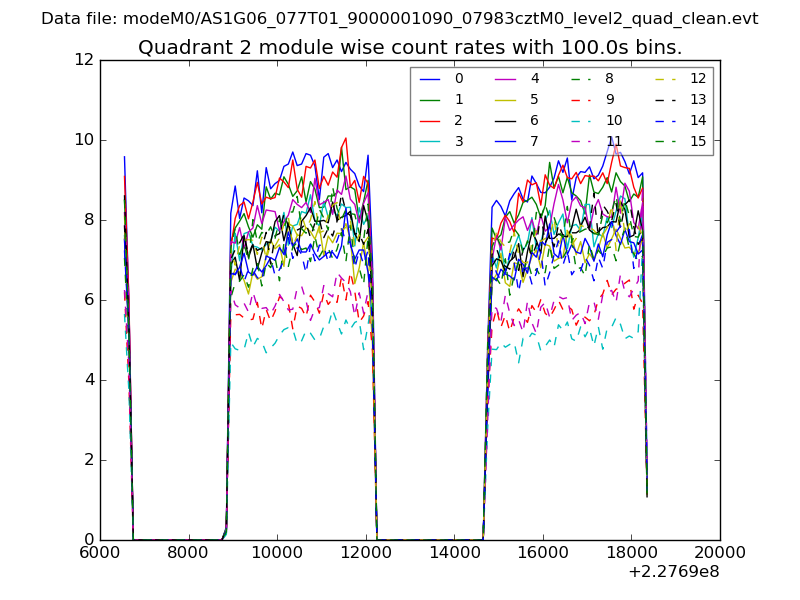
| Module-wise count rates for Quadrant B Data is divided into 100 sec bins |
 |
 |
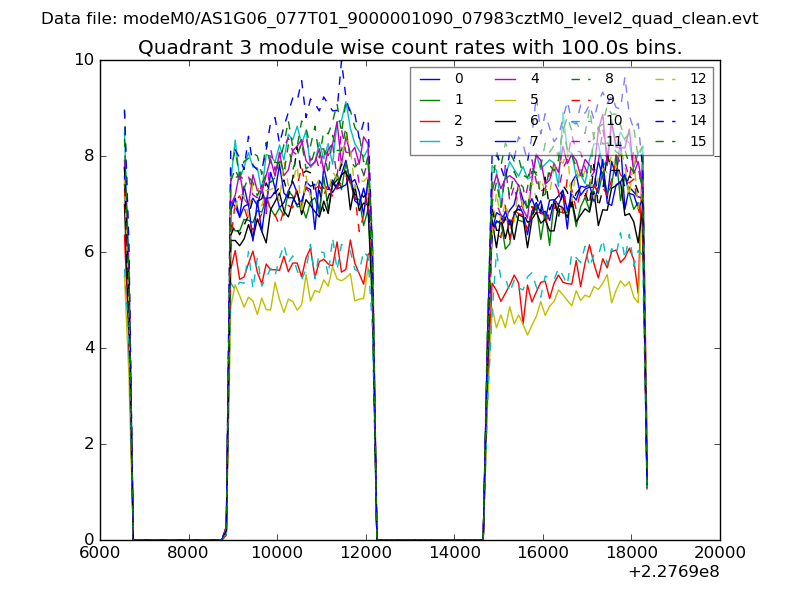
| Module-wise count rates for Quadrant C Data is divided into 100 sec bins |
 |
 |
| Module-wise count rates for Quadrant D Data is divided into 100 sec bins |
 |
 |
| Parameter | Plot |
|---|---|
| CZT HV Monitor | 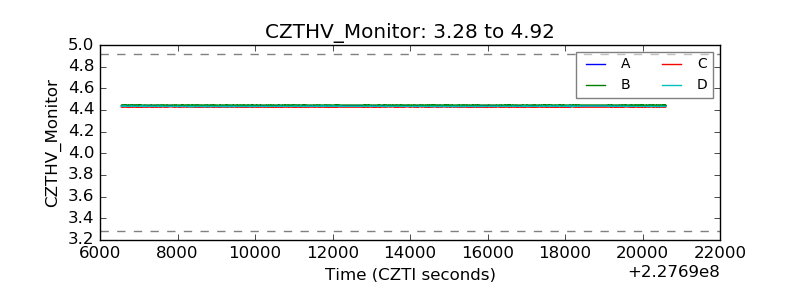 |
| D_VDD | 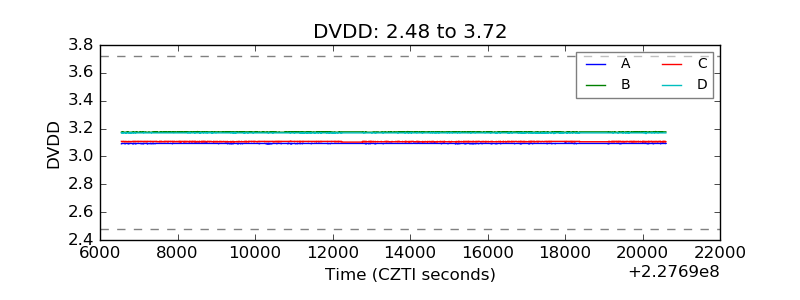 |
| Temperature 1 |  |
| Veto HV Monitor | 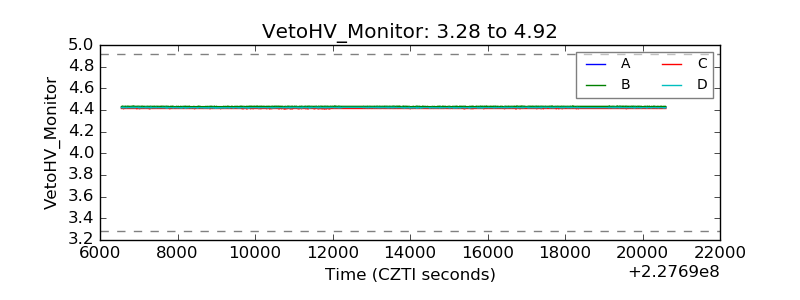 |
| Veto LLD |  |
| Alpha Counter | 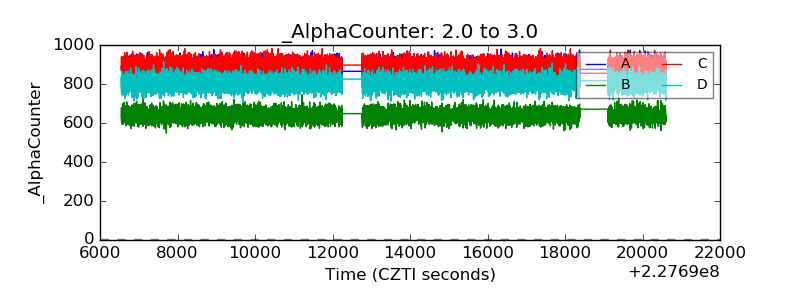 |
| _CPM_Rate | 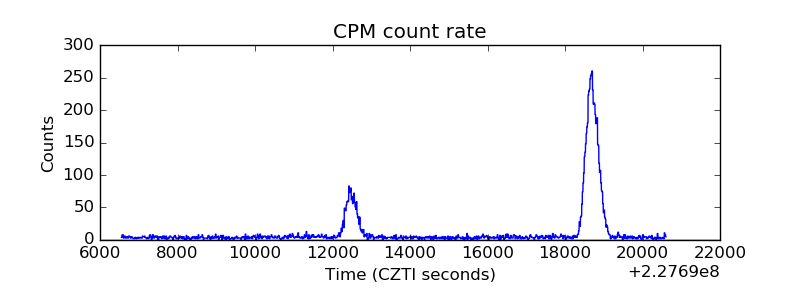 |
| CZT Counter | 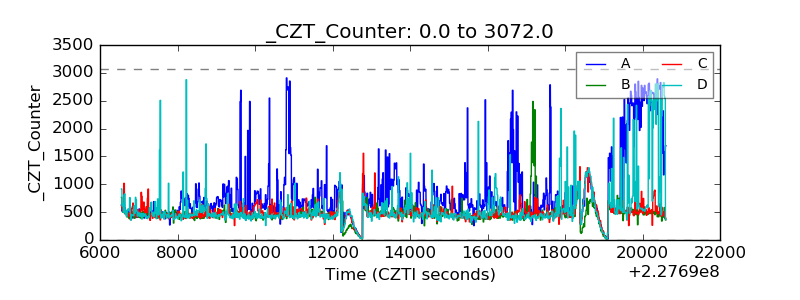 |
| +2.5 Volts monitor |  |
| +5 Volts monitor |  |
| _ROLL_ROT | 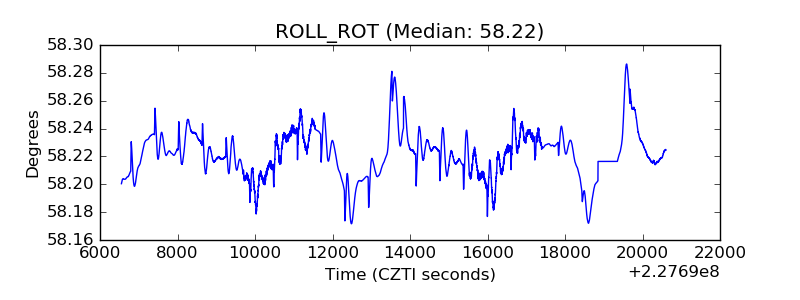 |
| _Roll_DEC | 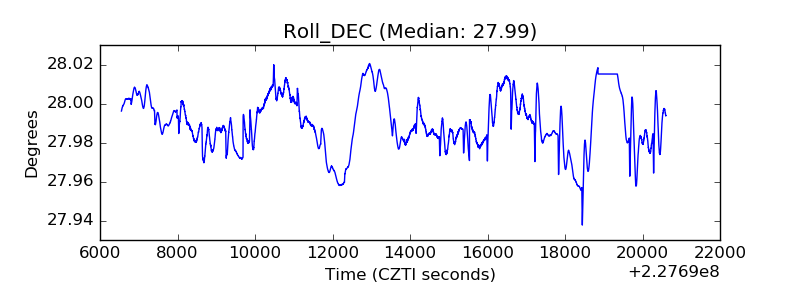 |
| _Roll_RA | 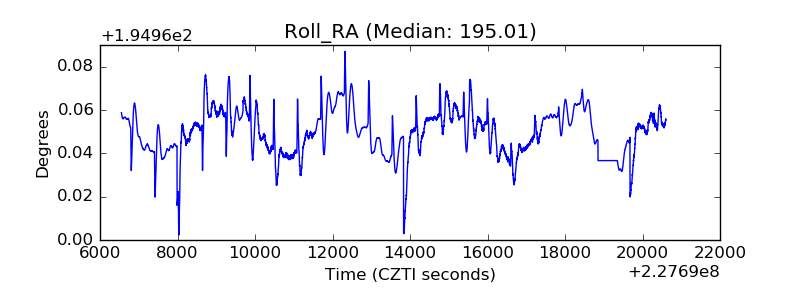 |
| Veto Counter | 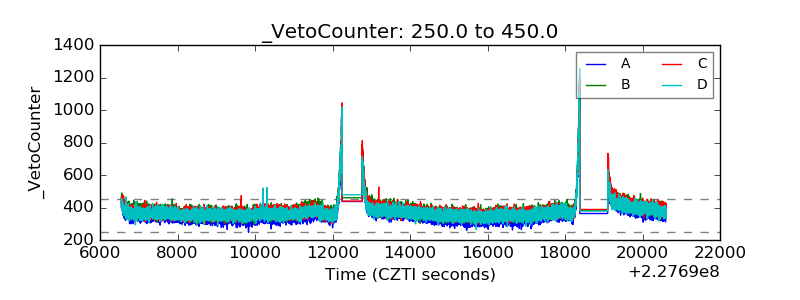 |