| Param | Original file | Final file |
|---|---|---|
| Filename | modeM0/AS1G06_077T01_9000001090_07985cztM0_level2.evt | modeM0/AS1G06_077T01_9000001090_07985cztM0_level2_quad_clean.evt |
| Size (bytes) | 518,947,200 | 59,420,160 |
| Size | 494.9 MB | 56.7 MB |
| Events in quadrant A | 7,583,975 | 282,424 |
| Events in quadrant B | 2,150,080 | 414,839 |
| Events in quadrant C | 2,204,897 | 412,093 |
| Events in quadrant D | 3,471,367 | 372,268 |
| Mode SS | |||
|---|---|---|---|
| Quadrant | BADHDUFLAG | Total packets | Discarded packets |
| A | 0 | 92 | 0 |
| B | 0 | 92 | 0 |
| C | 0 | 92 | 0 |
| D | 0 | 92 | 0 |
| Mode M0 | |||
|---|---|---|---|
| Quadrant | BADHDUFLAG | Total packets | Discarded packets |
| A | 0 | 25649 | 1 |
| B | 0 | 9546 | 1 |
| C | 0 | 9525 | 1 |
| D | 0 | 13363 | 1 |
| Mode M9 | |||
|---|---|---|---|
| Quadrant | BADHDUFLAG | Total packets | Discarded packets |
| A | 0 | 10 | 0 |
| B | 0 | 10 | 0 |
| C | 0 | 10 | 0 |
| D | 0 | 10 | 0 |
| Quadrant | Total seconds | Saturated seconds | Saturation percentage |
|---|---|---|---|
| A | 4503 | 2378 | 52.809238% |
| B | 4503 | 23 | 0.510771% |
| C | 4503 | 3 | 0.066622% |
| D | 4503 | 380 | 8.438819% |
Noise dominated data is calculated using 1-second bins in cleaned event files. If a bin has >2000 counts, and if more than 50% of those come from <1% of pixels, then it is considered to be noise-dominated and hence unusable.
| Quadrant | # 1 sec bins | Bins with >0 counts | Bins with >2000 counts | High rate bins dominated by noise | Noise dominated (total time) | Noise dominated (detector-on time) | Marked lightcurve |
|---|---|---|---|---|---|---|---|
| A | 4503 | 4503 | 2051 | 2051 | 45.55% | 45.55% | 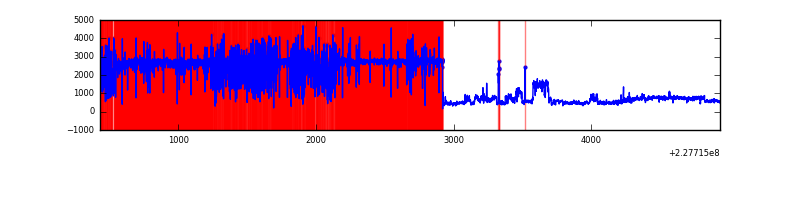 |
| B | 4503 | 4503 | 7 | 7 | 0.16% | 0.16% | 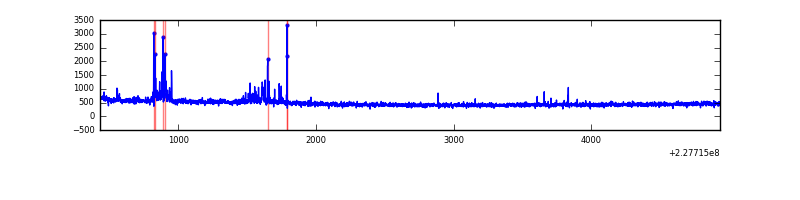 |
| C | 4503 | 4503 | 0 | 0 | 0.00% | 0.00% | 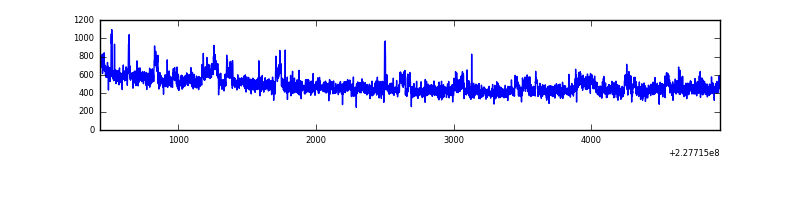 |
| D | 4503 | 4503 | 359 | 359 | 7.97% | 7.97% | 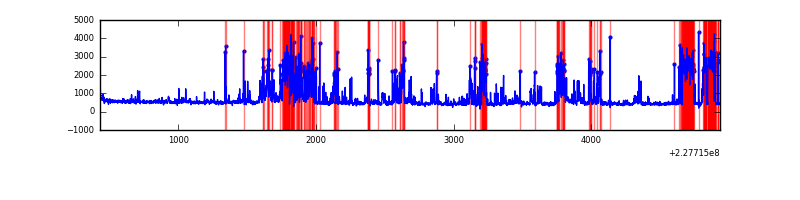 |
Top three noisy pixels from each quadrant. If the there are fewer than three noisy pixels in the level2.evt file, extra rows are filled as -1
| Pixel properties | Quadrant properties | ||||||
|---|---|---|---|---|---|---|---|
| Quadrant | DetID | PixID | Counts | Sigma | Mean | Median | Sigma |
| A | 0 | 128 | 6313768 | 94297.16 | 324 | 316 | 67.0 |
| A | 15 | 239 | 17955 | 263.45 | 324 | 316 | 67.0 |
| A | 0 | 226 | 2922 | 38.92 | 324 | 316 | 67.0 |
| B | 4 | 239 | 70630 | 687.45 | 525 | 511 | 102.0 |
| B | 11 | 51 | 18579 | 177.14 | 525 | 511 | 102.0 |
| B | 4 | 173 | 13723 | 129.53 | 525 | 511 | 102.0 |
| C | 1 | 16 | 193160 | 1599.71 | 515 | 517 | 120.4 |
| C | 13 | 61 | 3758 | 26.91 | 515 | 517 | 120.4 |
| C | 12 | 4 | 3229 | 22.52 | 515 | 517 | 120.4 |
| D | 1 | 52 | 1584830 | 13127.61 | 493 | 478 | 120.7 |
| D | 13 | 169 | 14420 | 115.52 | 493 | 478 | 120.7 |
| D | 2 | 234 | 13788 | 110.28 | 493 | 478 | 120.7 |
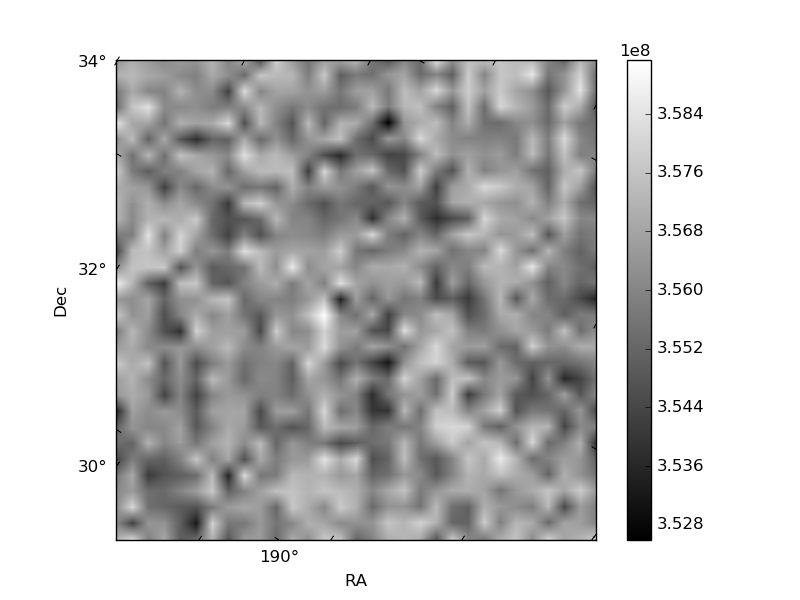
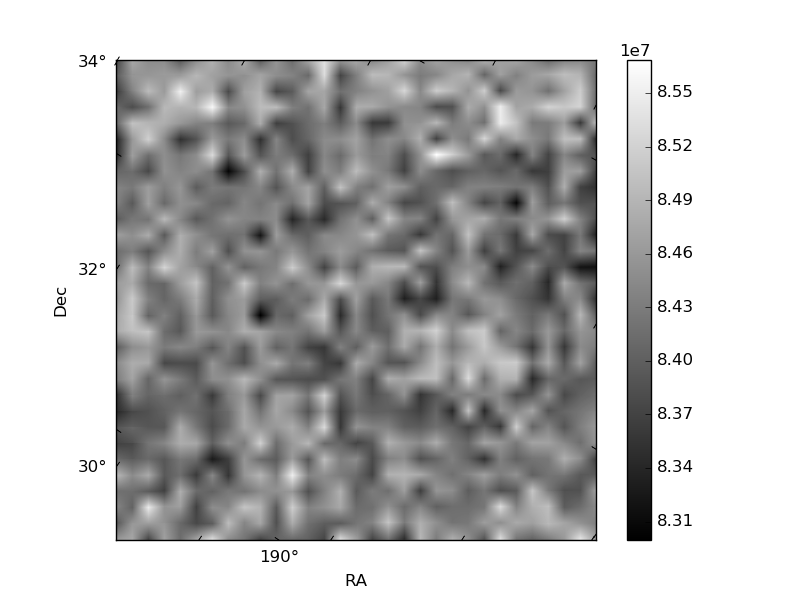
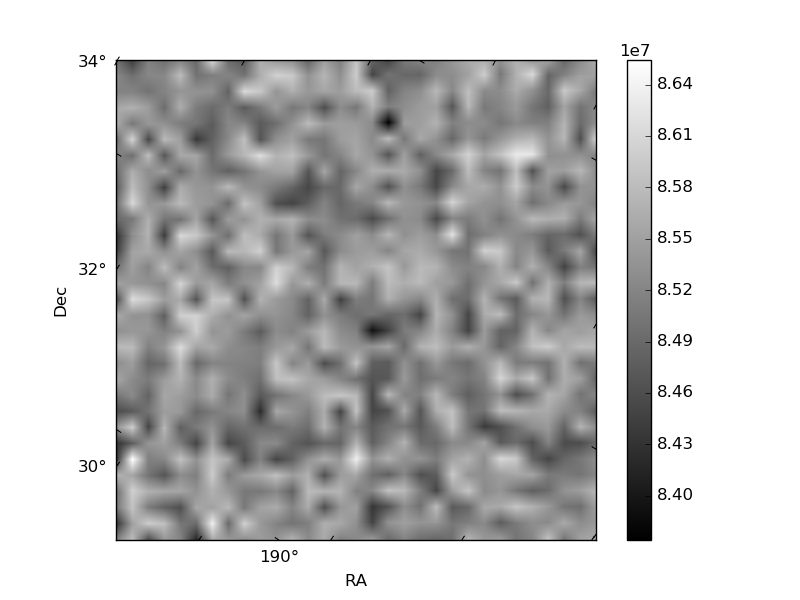
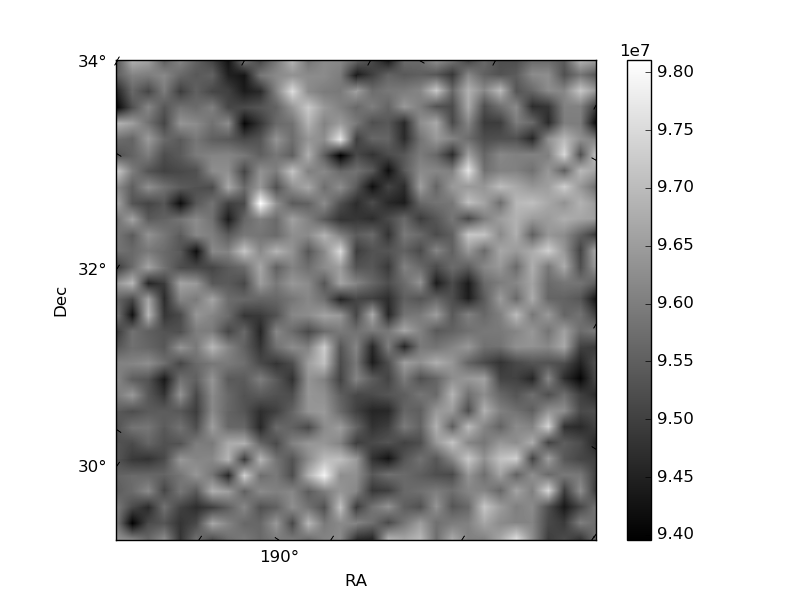
Histogram calculated using DETX and DETY for each event in the final _common_clean file
| Quadrant A | 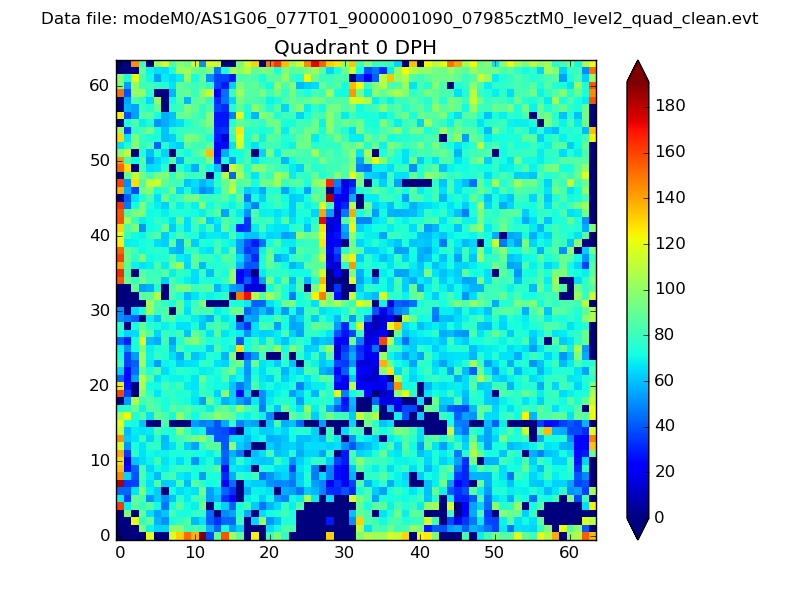 |
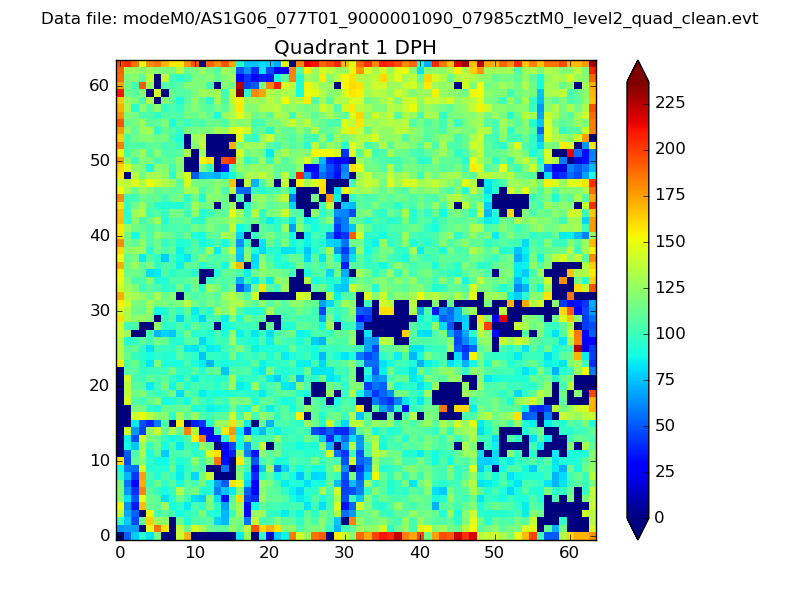 |
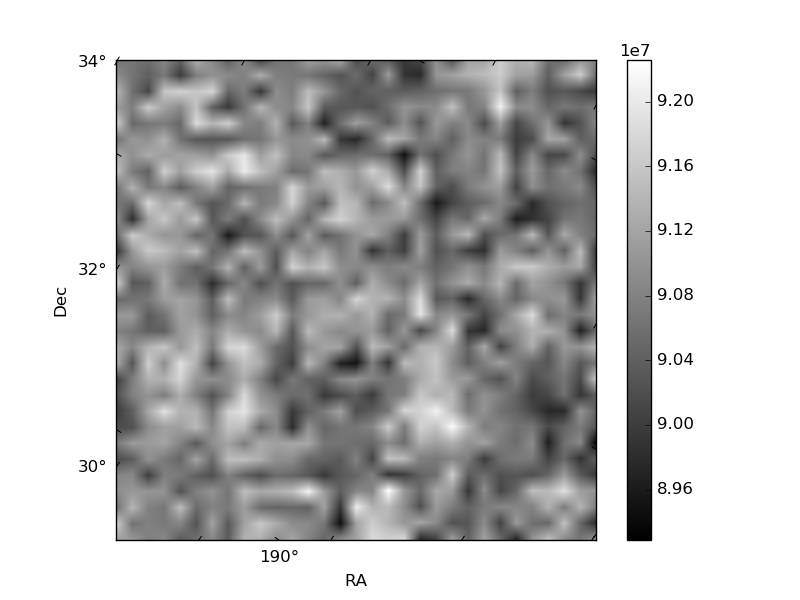
Quadrant B |
|---|---|---|---|
| Quadrant D | 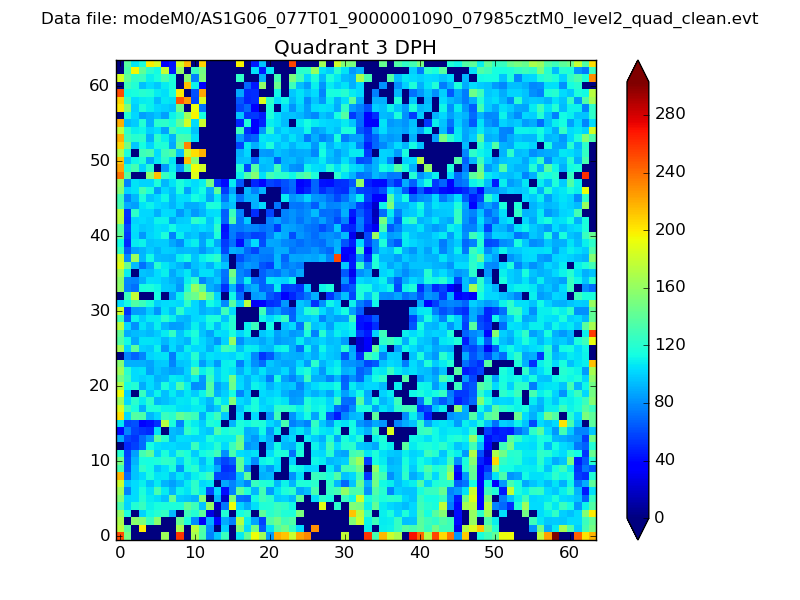 |
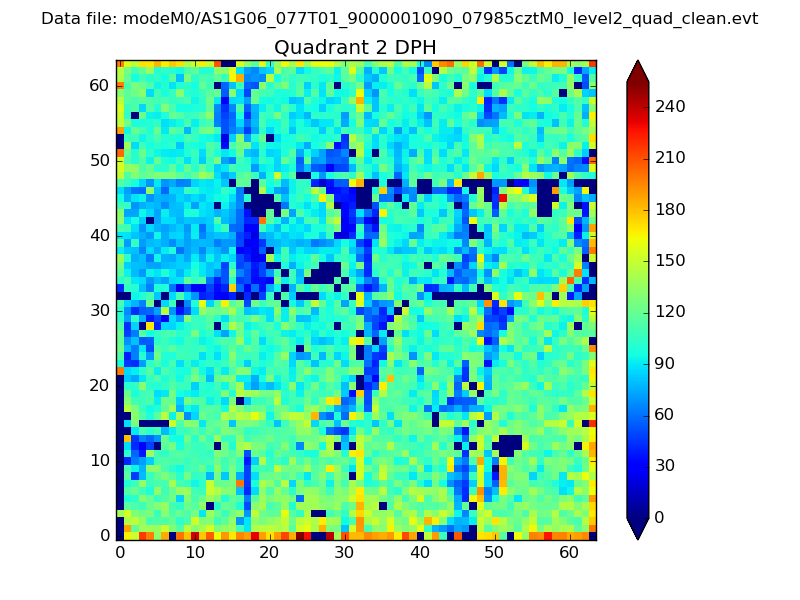 |
Quadrant C |
| Plot type | Count rate plots | Images |
|---|---|---|
| Comparison with Poisson distribution Blue bars denote a histogram of data divided into 1 sec bins. Red curve is a Poisson curve with rate = median count rate of data. |
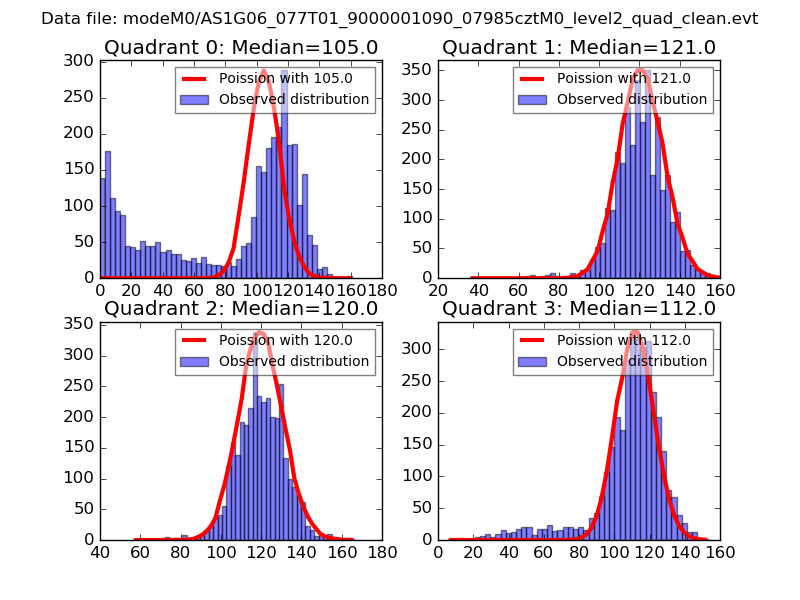 |
 |
| Quadrant-wise count rates Data is divided into 100 sec bins |
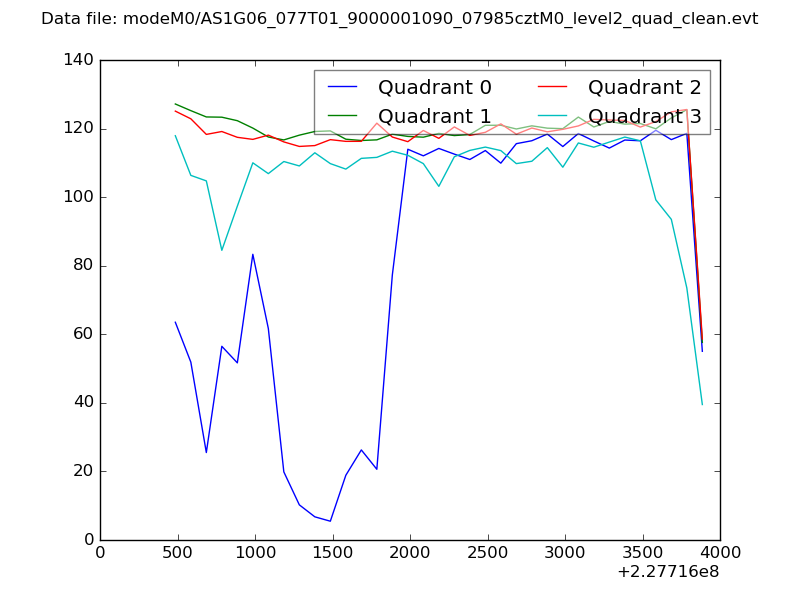 |
|
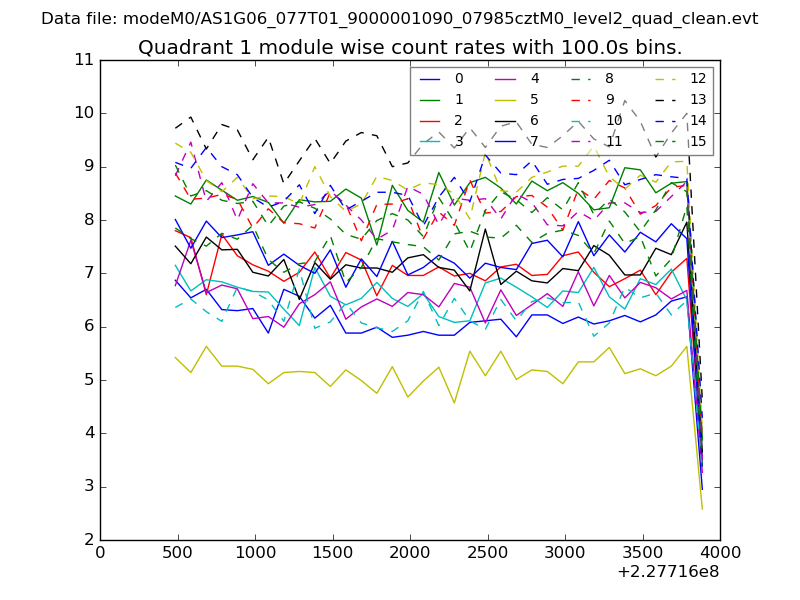
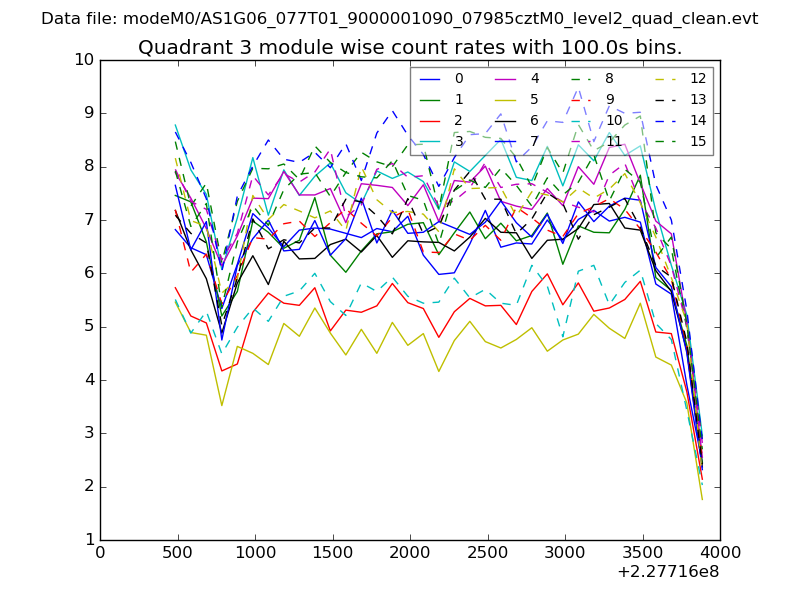
| Module-wise count rates for Quadrant A Data is divided into 100 sec bins |
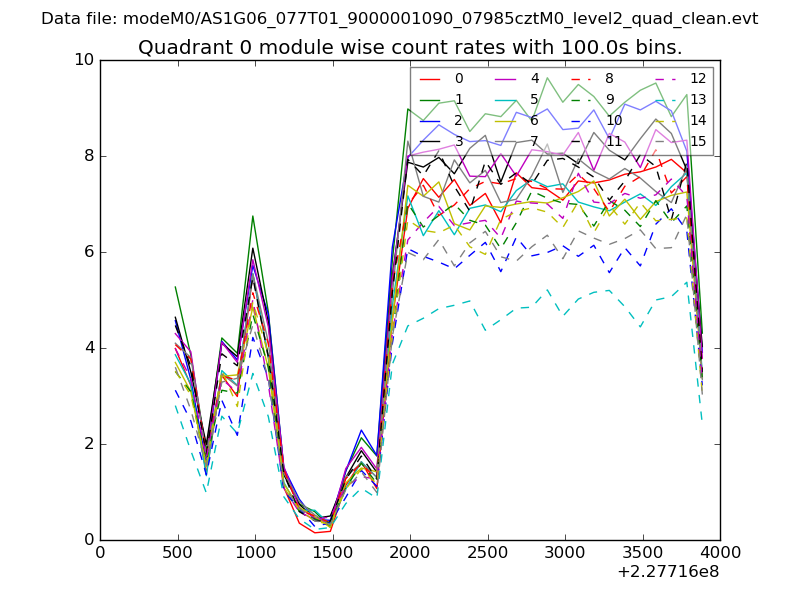 |
 |
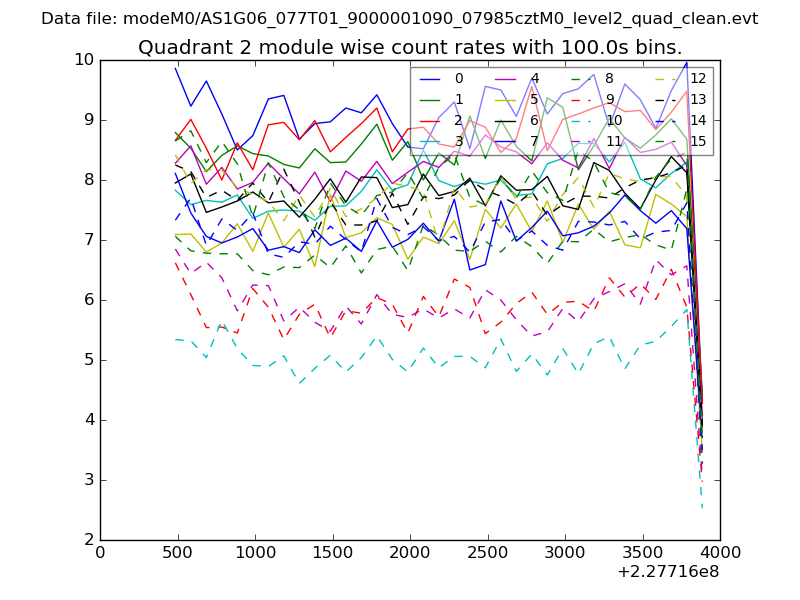
| Module-wise count rates for Quadrant B Data is divided into 100 sec bins |
 |
 |
| Module-wise count rates for Quadrant C Data is divided into 100 sec bins |
 |
 |
| Module-wise count rates for Quadrant D Data is divided into 100 sec bins |
 |
 |
| Parameter | Plot |
|---|---|
| CZT HV Monitor | 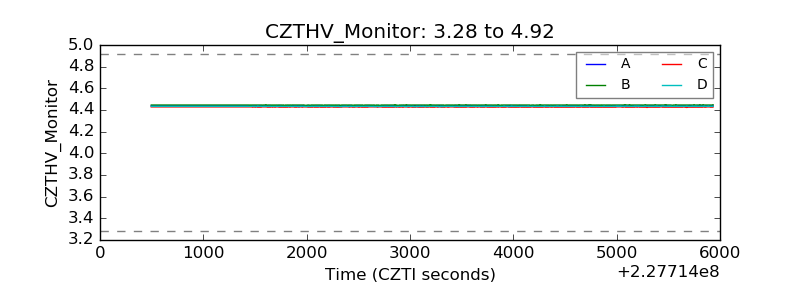 |
| D_VDD | 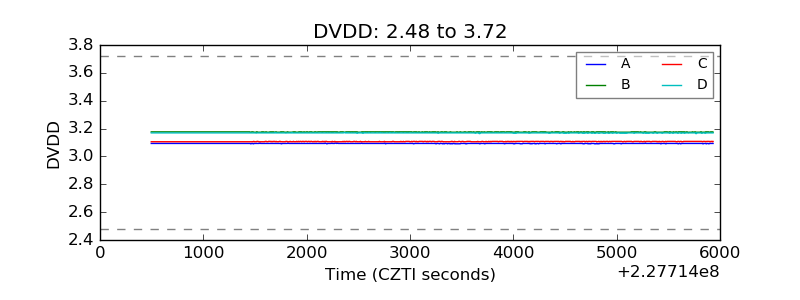 |
| Temperature 1 | 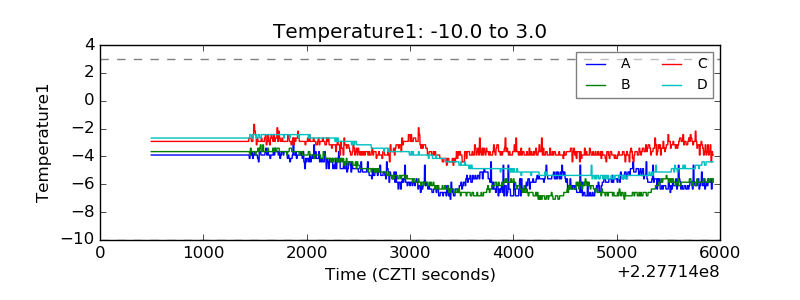 |
| Veto HV Monitor |  |
| Veto LLD | 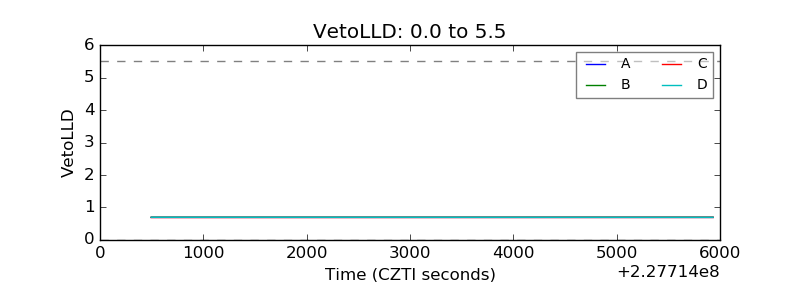 |
| Alpha Counter | 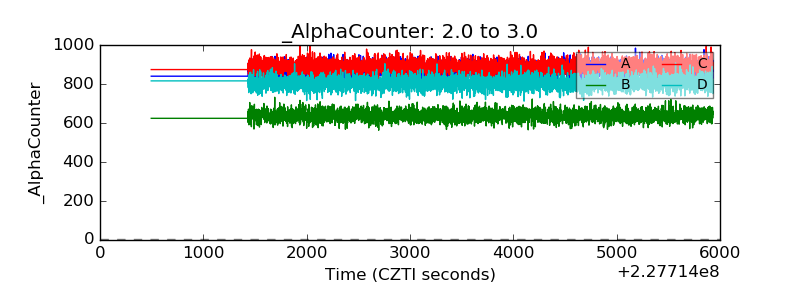 |
| _CPM_Rate | 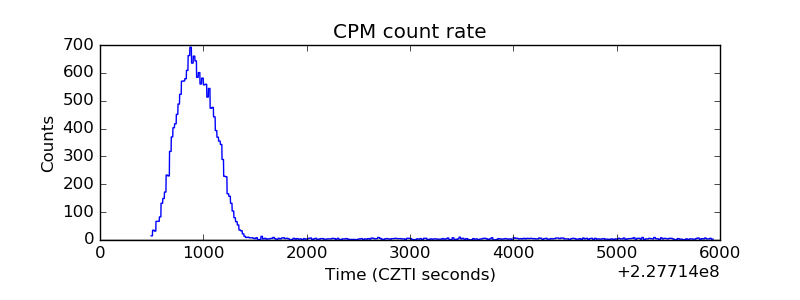 |
| CZT Counter | 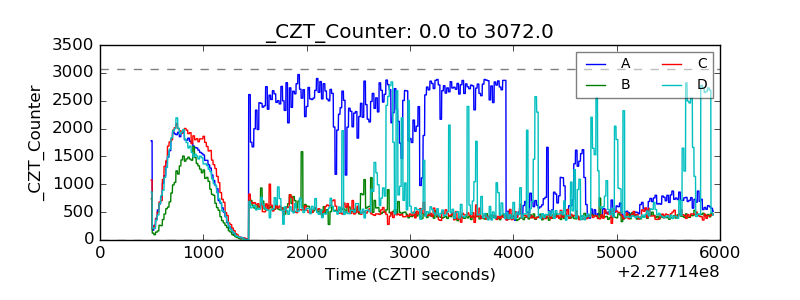 |
| +2.5 Volts monitor |  |
| +5 Volts monitor |  |
| _ROLL_ROT | 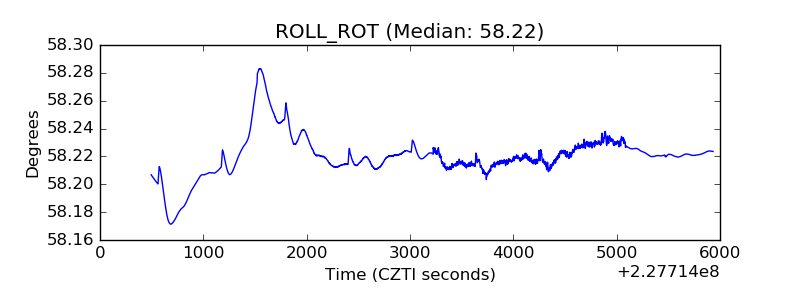 |
| _Roll_DEC | 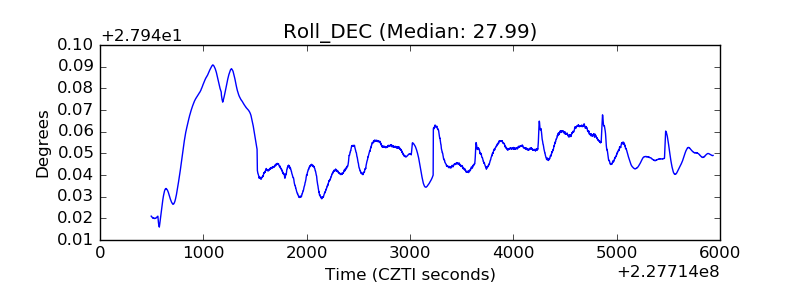 |
| _Roll_RA | 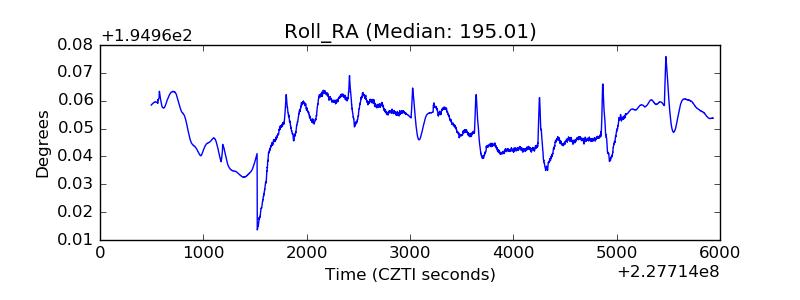 |
| Veto Counter | 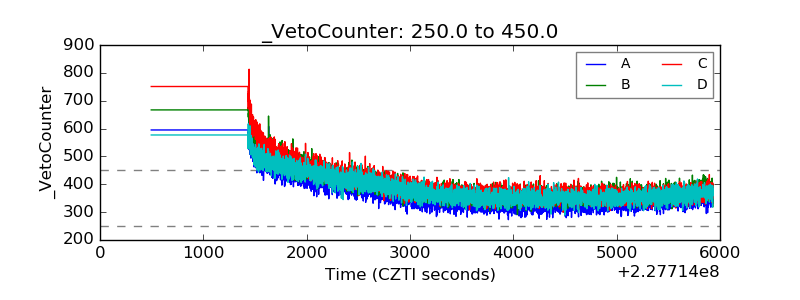 |