| Param | Original file | Final file |
|---|---|---|
| Filename | modeM0/AS1G06_028T01_9000001094cztM0_level2.fits | modeM0/AS1G06_028T01_9000001094cztM0_level2_quad_clean.evt |
| Size (bytes) | 225,155,520 | 244,186,560 |
| Size | 214.7 MB | 232.9 MB |
| Events in quadrant A | 1,353,372 | 1,481,071 |
| Events in quadrant B | 1,338,640 | 1,527,615 |
| Events in quadrant C | 1,397,904 | 1,513,372 |
| Events in quadrant D | 1,163,082 | 1,307,925 |
| Mode M0 | |||
|---|---|---|---|
| Quadrant | BADHDUFLAG | Total packets | Discarded packets |
| A | 0 | 57968 | 0 |
| B | 0 | 51767 | 0 |
| C | 0 | 52530 | 0 |
| D | 0 | 65518 | 0 |
| Mode M9 | |||
|---|---|---|---|
| Quadrant | BADHDUFLAG | Total packets | Discarded packets |
| A | 0 | 52 | 0 |
| B | 0 | 52 | 0 |
| C | 0 | 52 | 0 |
| D | 0 | 52 | 0 |
| Mode SS | |||
|---|---|---|---|
| Quadrant | BADHDUFLAG | Total packets | Discarded packets |
| A | 0 | 462 | 0 |
| B | 0 | 462 | 0 |
| C | 0 | 462 | 0 |
| D | 0 | 462 | 0 |
| Quadrant | Total seconds | Saturated seconds | Saturation percentage |
|---|---|---|---|
| A | 22746 | 510 | 2.242152% |
| B | 22746 | 540 | 2.374044% |
| C | 22746 | 395 | 1.736569% |
| D | 22746 | 1686 | 7.412292% |
Noise dominated data is calculated using 1-second bins in cleaned event files. If a bin has >2000 counts, and if more than 50% of those come from <1% of pixels, then it is considered to be noise-dominated and hence unusable.
| Quadrant | # 1 sec bins | Bins with >0 counts | Bins with >2000 counts | High rate bins dominated by noise | Noise dominated (total time) | Noise dominated (detector-on time) | Marked lightcurve |
|---|---|---|---|---|---|---|---|
| A | 27876 | 22732 | 0 | 0 | 0.00% | 0.00% |  |
| B | 27876 | 22746 | 0 | 0 | 0.00% | 0.00% |  |
| C | 27876 | 22746 | 0 | 0 | 0.00% | 0.00% | 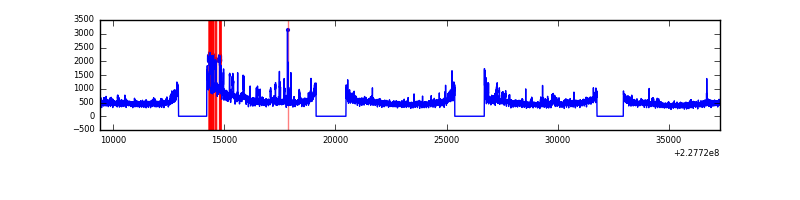 |
| D | 27876 | 22717 | 0 | 0 | 0.00% | 0.00% | 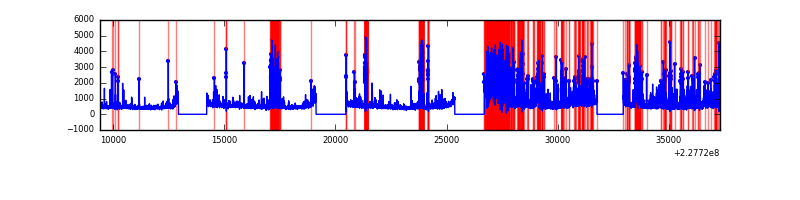 |
Top three noisy pixels from each quadrant. If the there are fewer than three noisy pixels in the level2.evt file, extra rows are filled as -1
| Pixel properties | Quadrant properties | ||||||
|---|---|---|---|---|---|---|---|
| Quadrant | DetID | PixID | Counts | Sigma | Mean | Median | Sigma |
| A | 0 | 29 | 1318 | 11.01 | 351 | 331 | 89.6 |
| A | 7 | 110 | 1151 | 9.15 | 351 | 331 | 89.6 |
| A | 0 | 30 | 1029 | 7.79 | 351 | 331 | 89.6 |
| B | 2 | 9 | 1152 | 11.22 | 353 | 337 | 72.7 |
| B | 5 | 128 | 927 | 8.12 | 353 | 337 | 72.7 |
| B | 2 | 8 | 907 | 7.85 | 353 | 337 | 72.7 |
| C | 1 | 80 | 1093 | 7.61 | 368 | 345 | 98.3 |
| C | 1 | 81 | 1058 | 7.25 | 368 | 345 | 98.3 |
| C | 12 | 250 | 1004 | 6.7 | 368 | 345 | 98.3 |
| D | 6 | 231 | 853 | 6.23 | 330 | 301 | 88.5 |
| D | 7 | 5 | 832 | 6.0 | 330 | 301 | 88.5 |
| D | 6 | 38 | 815 | 5.8 | 330 | 301 | 88.5 |
Histogram calculated using DETX and DETY for each event in the final _common_clean file
| Quadrant A | 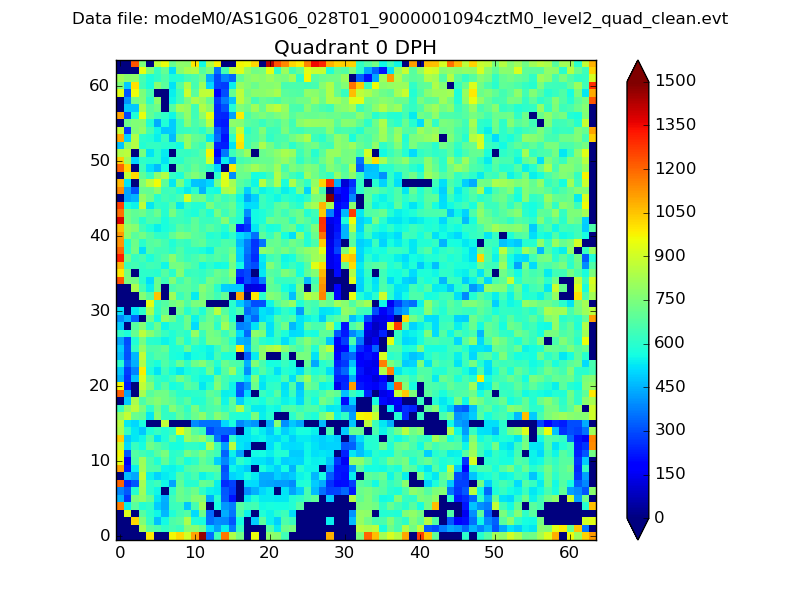 |
 |
Quadrant B |
|---|---|---|---|
| Quadrant D |  |
 |
Quadrant C |
| Plot type | Count rate plots | Images |
|---|---|---|
| Comparison with Poisson distribution Blue bars denote a histogram of data divided into 1 sec bins. Red curve is a Poisson curve with rate = median count rate of data. |
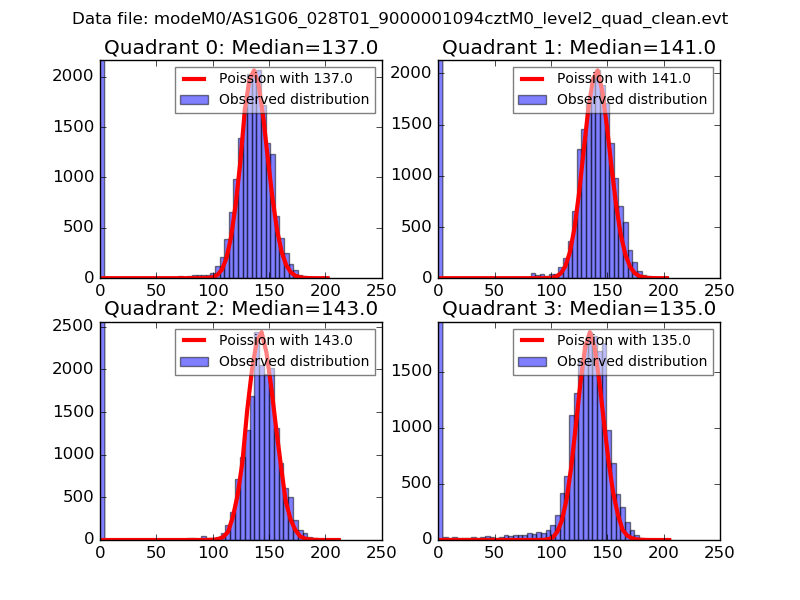 |
 |
| Quadrant-wise count rates Data is divided into 100 sec bins |
 |
|
| Module-wise count rates for Quadrant A Data is divided into 100 sec bins |
 |
 |
| Module-wise count rates for Quadrant B Data is divided into 100 sec bins |
 |
 |
| Module-wise count rates for Quadrant C Data is divided into 100 sec bins |
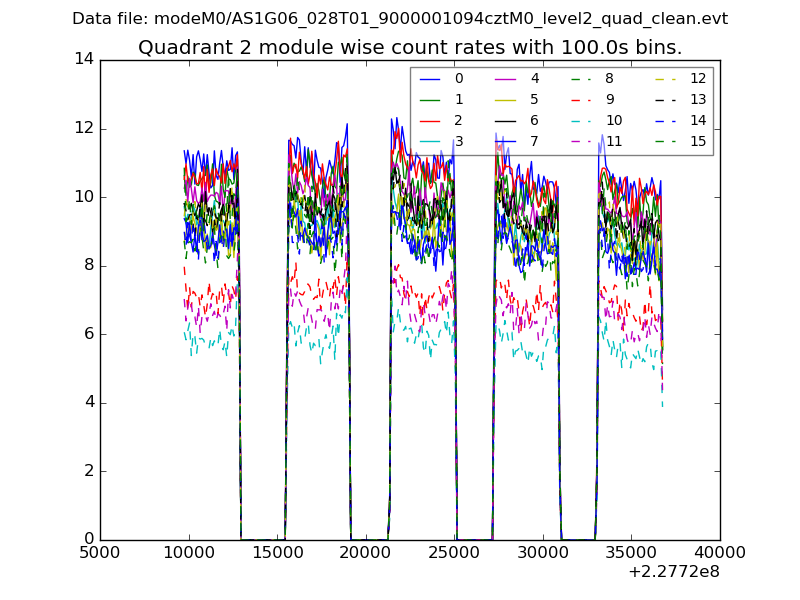 |
 |
| Module-wise count rates for Quadrant D Data is divided into 100 sec bins |
 |
 |
| Parameter | Plot |
|---|---|
| CZT HV Monitor |  |
| D_VDD |  |
| Temperature 1 |  |
| Veto HV Monitor |  |
| Veto LLD |  |
| Alpha Counter | 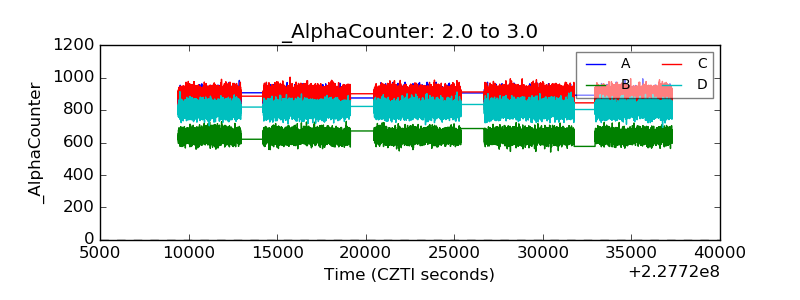 |
| _CPM_Rate | 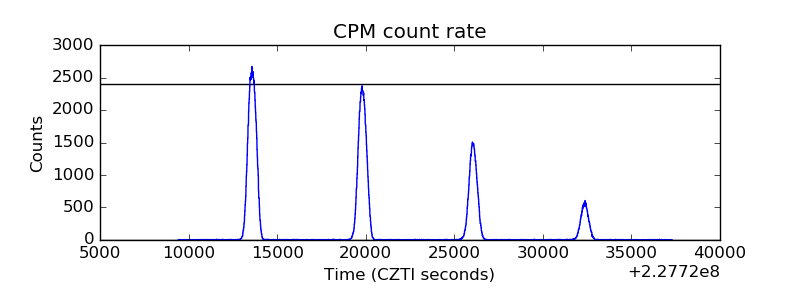 |
| CZT Counter | 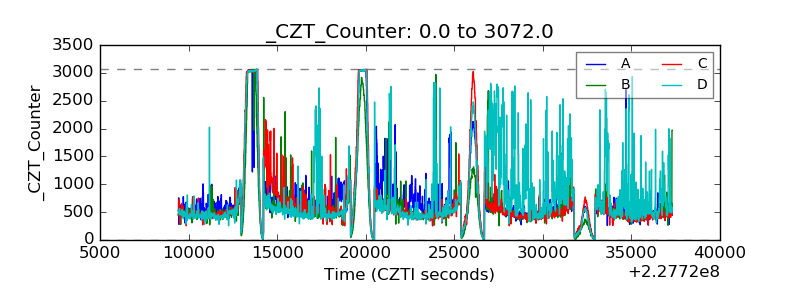 |
| +2.5 Volts monitor |  |
| +5 Volts monitor | 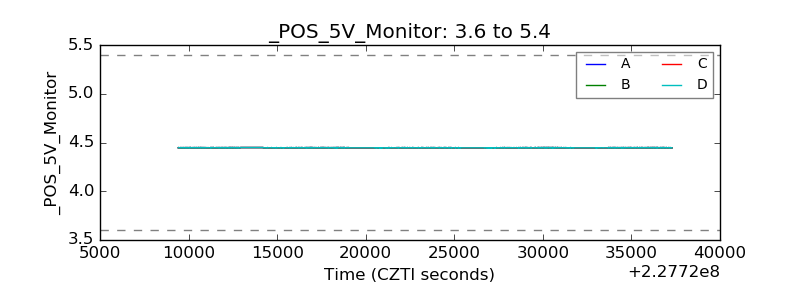 |
| _ROLL_ROT |  |
| _Roll_DEC |  |
| _Roll_RA |  |
| Veto Counter |  |