| Param | Original file | Final file |
|---|---|---|
| Filename | modeM0/AS1G06_028T01_9000001094_07990cztM0_level2.evt | modeM0/AS1G06_028T01_9000001094_07990cztM0_level2_quad_clean.evt |
| Size (bytes) | 584,507,520 | 96,243,840 |
| Size | 557.4 MB | 91.8 MB |
| Events in quadrant A | 4,636,537 | 607,644 |
| Events in quadrant B | 3,765,818 | 641,679 |
| Events in quadrant C | 3,373,397 | 653,606 |
| Events in quadrant D | 5,504,890 | 577,273 |
| Mode M0 | |||
|---|---|---|---|
| Quadrant | BADHDUFLAG | Total packets | Discarded packets |
| A | 0 | 18123 | 3 |
| B | 0 | 15269 | 2 |
| C | 0 | 14023 | 2 |
| D | 0 | 20577 | 2 |
| Mode M9 | |||
|---|---|---|---|
| Quadrant | BADHDUFLAG | Total packets | Discarded packets |
| A | 0 | 27 | 0 |
| B | 0 | 27 | 0 |
| C | 0 | 27 | 0 |
| D | 0 | 27 | 0 |
| Mode SS | |||
|---|---|---|---|
| Quadrant | BADHDUFLAG | Total packets | Discarded packets |
| A | 0 | 128 | 0 |
| B | 0 | 128 | 0 |
| C | 0 | 128 | 0 |
| D | 0 | 128 | 0 |
| Quadrant | Total seconds | Saturated seconds | Saturation percentage |
|---|---|---|---|
| A | 6224 | 282 | 4.530848% |
| B | 6224 | 248 | 3.984576% |
| C | 6224 | 84 | 1.349614% |
| D | 6224 | 995 | 15.986504% |
Noise dominated data is calculated using 1-second bins in cleaned event files. If a bin has >2000 counts, and if more than 50% of those come from <1% of pixels, then it is considered to be noise-dominated and hence unusable.
| Quadrant | # 1 sec bins | Bins with >0 counts | Bins with >2000 counts | High rate bins dominated by noise | Noise dominated (total time) | Noise dominated (detector-on time) | Marked lightcurve |
|---|---|---|---|---|---|---|---|
| A | 8899 | 6226 | 79 | 79 | 0.89% | 1.27% | 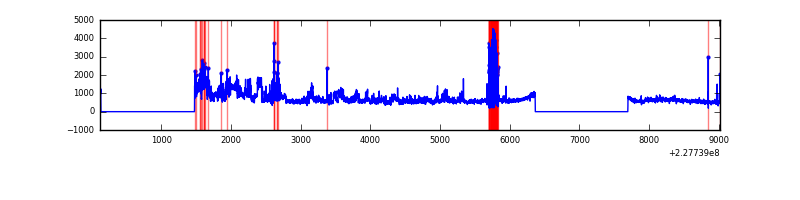 |
| B | 8899 | 6226 | 83 | 83 | 0.93% | 1.33% | 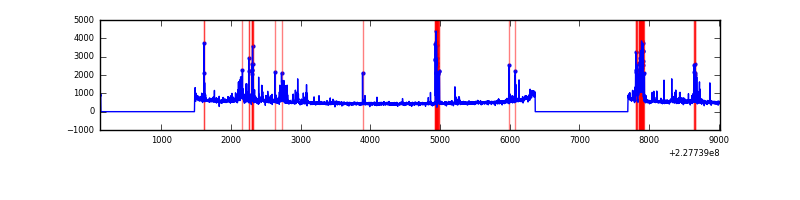 |
| C | 8899 | 6226 | 0 | 0 | 0.00% | 0.00% | 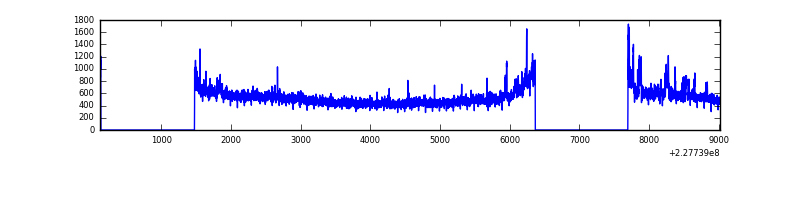 |
| D | 8899 | 6226 | 712 | 712 | 8.00% | 11.44% | 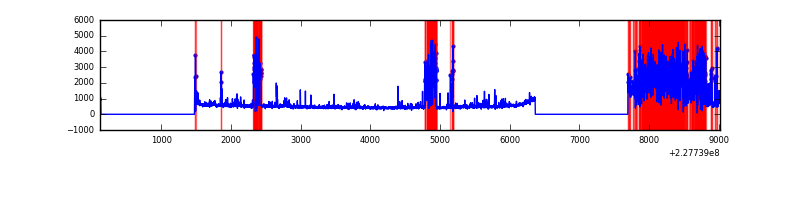 |
Top three noisy pixels from each quadrant. If the there are fewer than three noisy pixels in the level2.evt file, extra rows are filled as -1
| Pixel properties | Quadrant properties | ||||||
|---|---|---|---|---|---|---|---|
| Quadrant | DetID | PixID | Counts | Sigma | Mean | Median | Sigma |
| A | 0 | 128 | 1091993 | 6872.27 | 790 | 776 | 158.8 |
| A | 15 | 239 | 323848 | 2034.64 | 790 | 776 | 158.8 |
| A | 4 | 2 | 144728 | 906.58 | 790 | 776 | 158.8 |
| B | 4 | 239 | 384410 | 2528.95 | 810 | 795 | 151.7 |
| B | 5 | 250 | 87887 | 574.15 | 810 | 795 | 151.7 |
| B | 11 | 51 | 62952 | 409.76 | 810 | 795 | 151.7 |
| C | 1 | 16 | 223961 | 1201.72 | 805 | 813 | 185.7 |
| C | 13 | 61 | 6052 | 28.21 | 805 | 813 | 185.7 |
| C | 14 | 67 | 4064 | 17.51 | 805 | 813 | 185.7 |
| D | 1 | 83 | 1863082 | 10300.8 | 740 | 719 | 180.8 |
| D | 1 | 52 | 670919 | 3706.9 | 740 | 719 | 180.8 |
| D | 2 | 136 | 56454 | 308.27 | 740 | 719 | 180.8 |
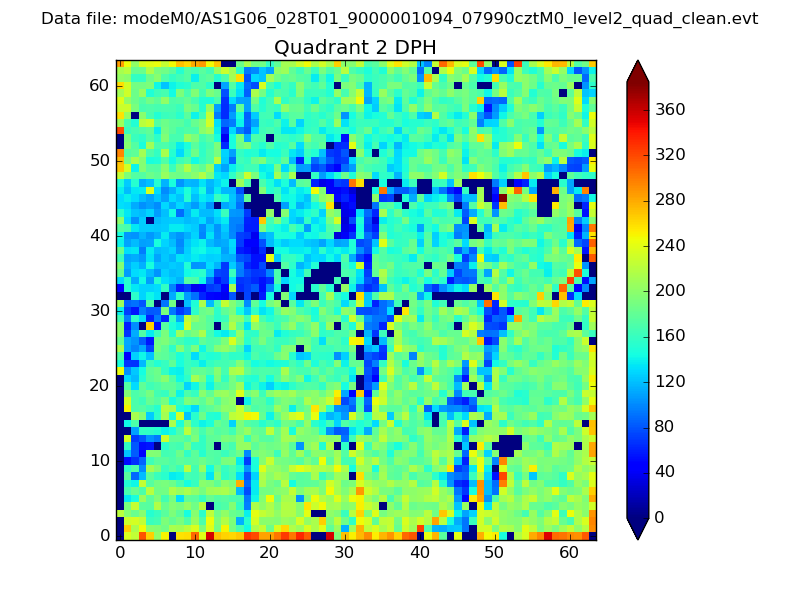
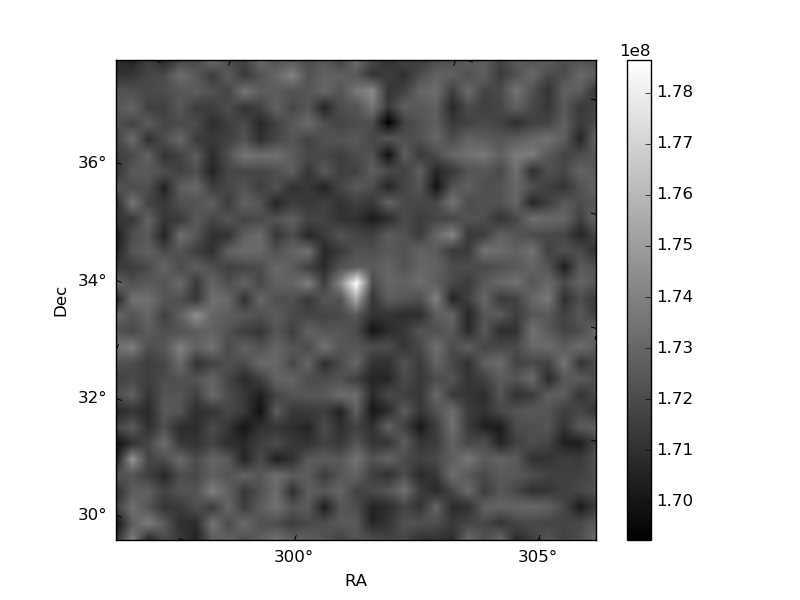
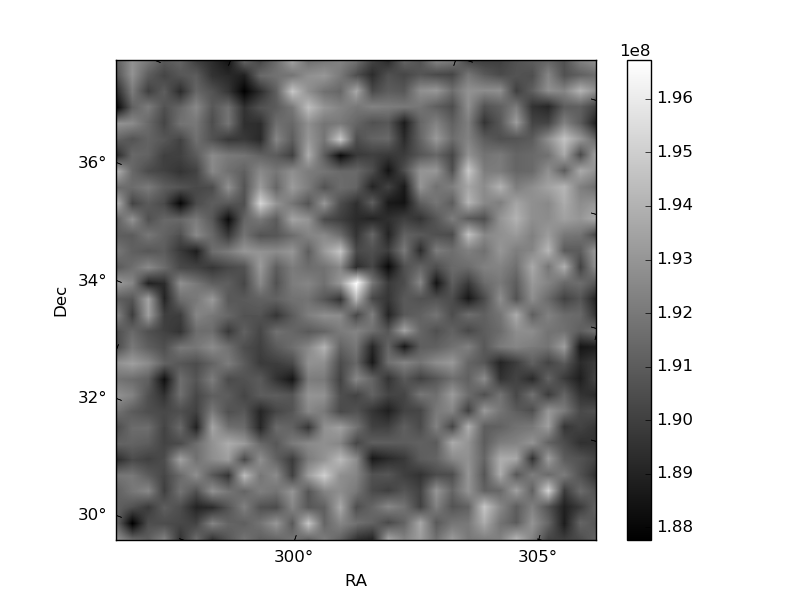
Histogram calculated using DETX and DETY for each event in the final _common_clean file
| Quadrant A | 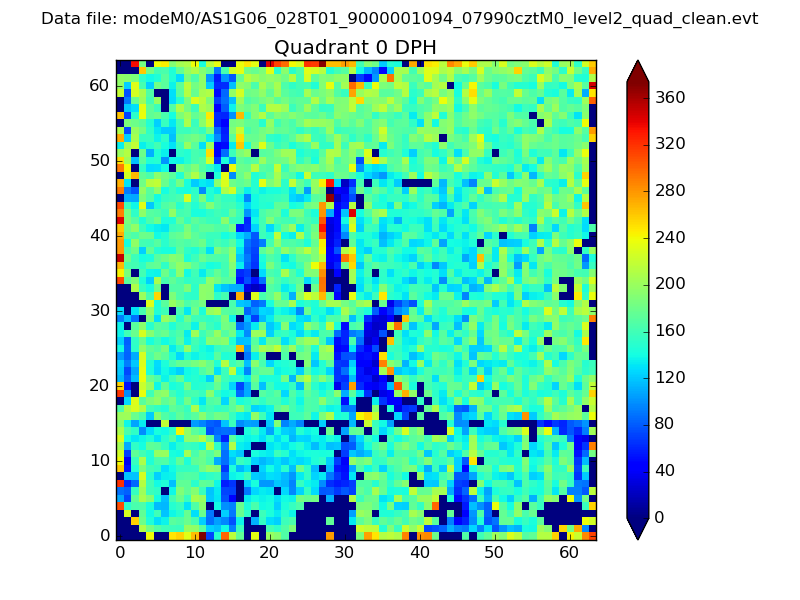 |
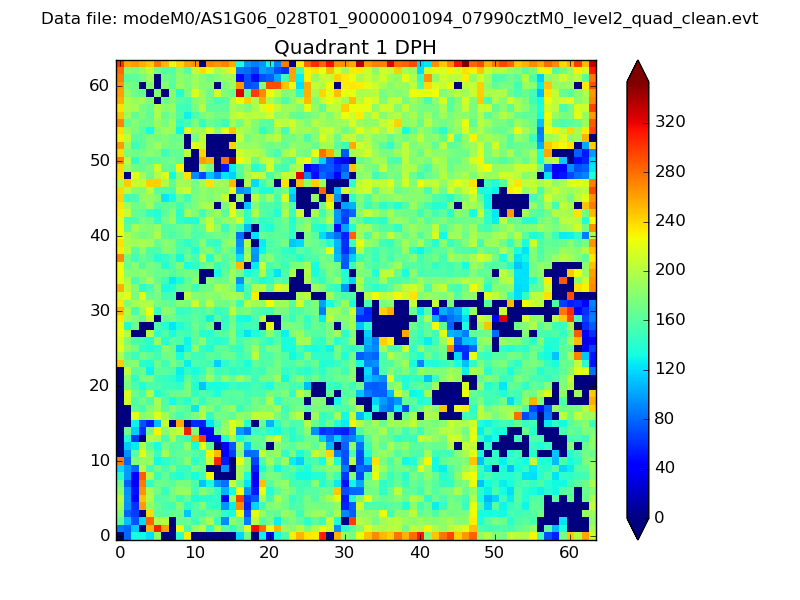 |
Quadrant B |
|---|---|---|---|
| Quadrant D | 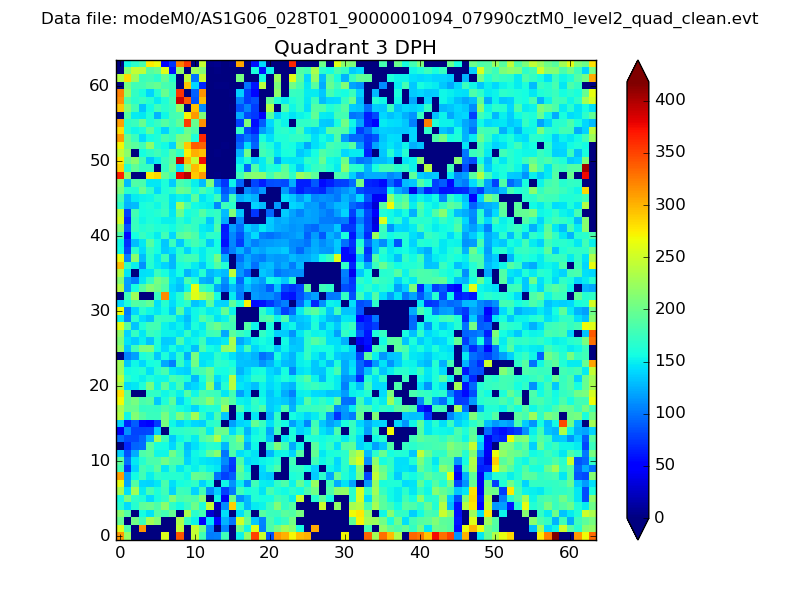 |
 |
Quadrant C |
| Plot type | Count rate plots | Images |
|---|---|---|
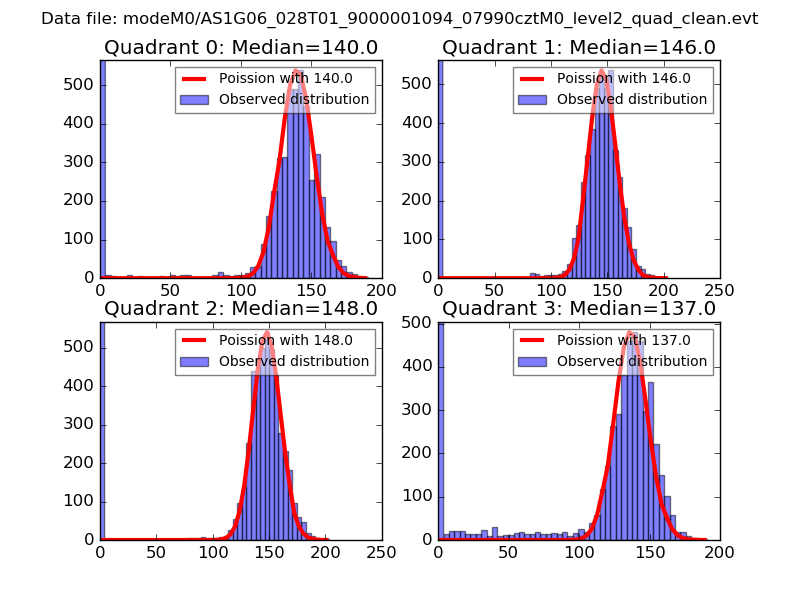
| Comparison with Poisson distribution Blue bars denote a histogram of data divided into 1 sec bins. Red curve is a Poisson curve with rate = median count rate of data. |
 |
 |
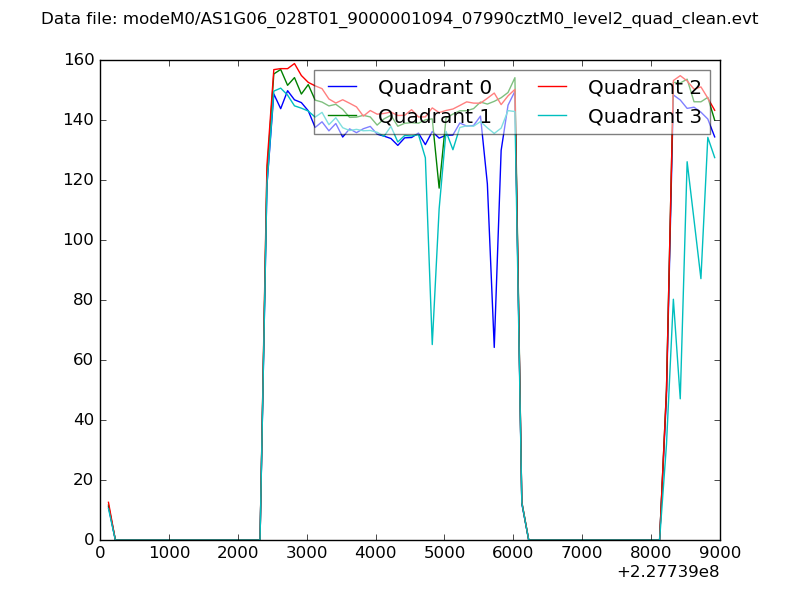
| Quadrant-wise count rates Data is divided into 100 sec bins |
 |
|
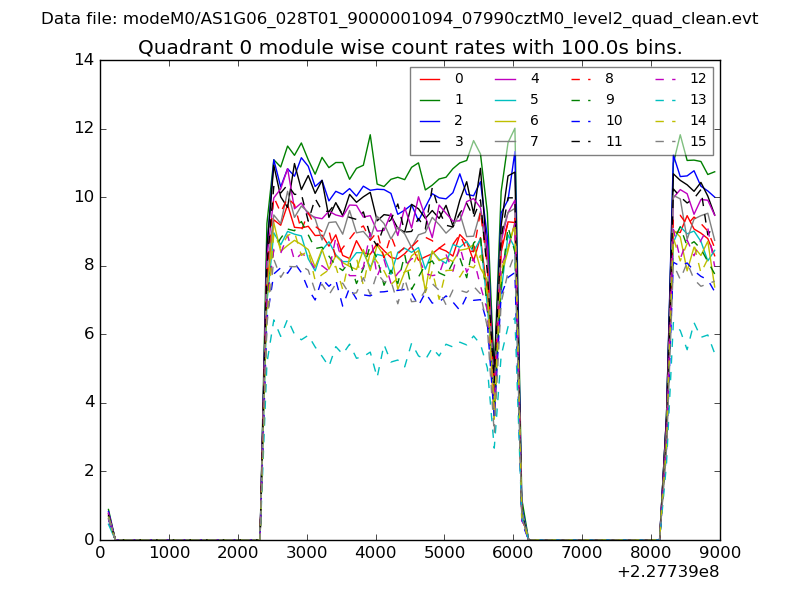
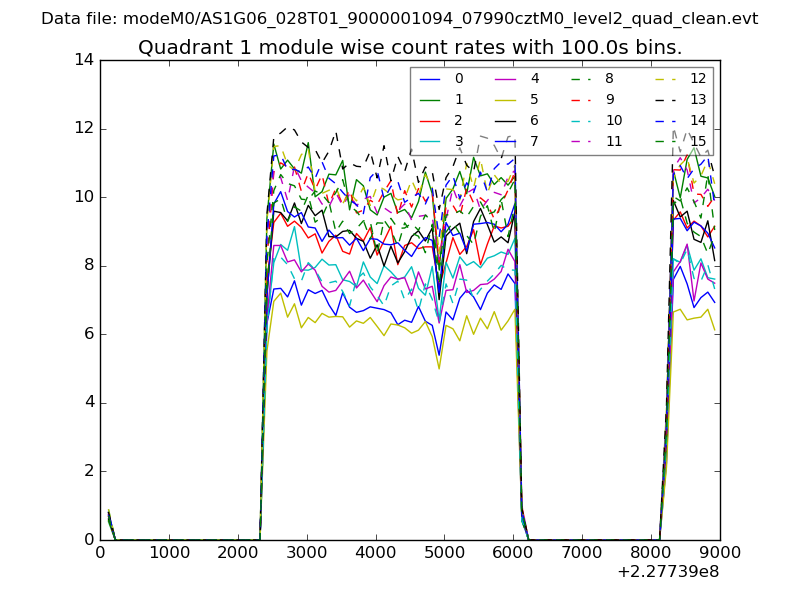
| Module-wise count rates for Quadrant A Data is divided into 100 sec bins |
 |
 |
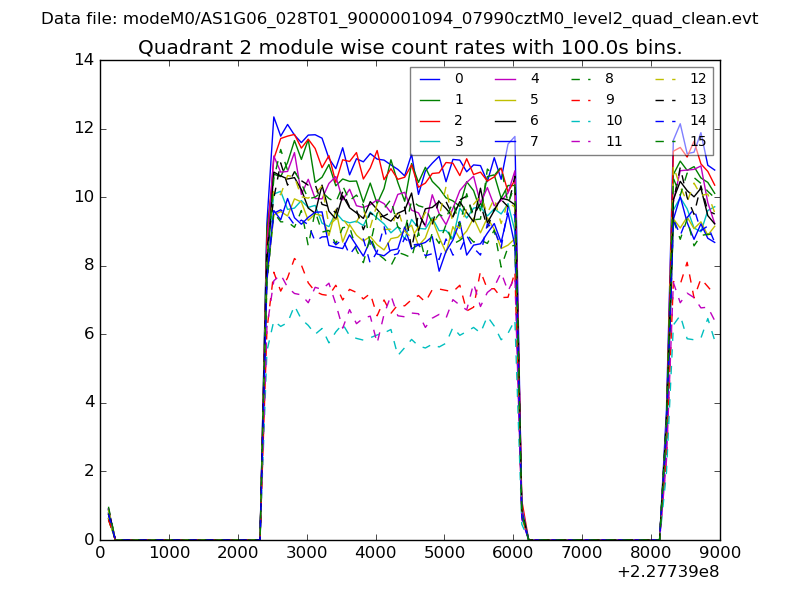
| Module-wise count rates for Quadrant B Data is divided into 100 sec bins |
 |
 |
| Module-wise count rates for Quadrant C Data is divided into 100 sec bins |
 |
 |
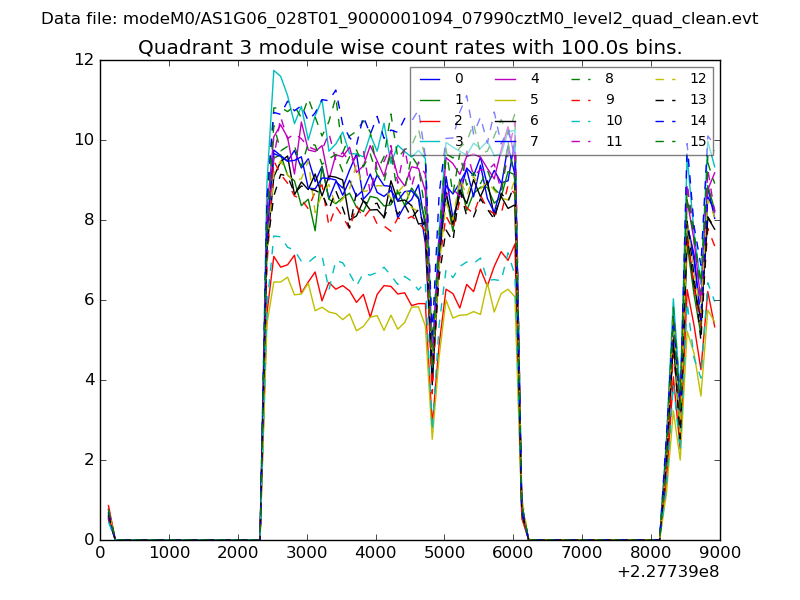
| Module-wise count rates for Quadrant D Data is divided into 100 sec bins |
 |
 |
| Parameter | Plot |
|---|---|
| CZT HV Monitor | 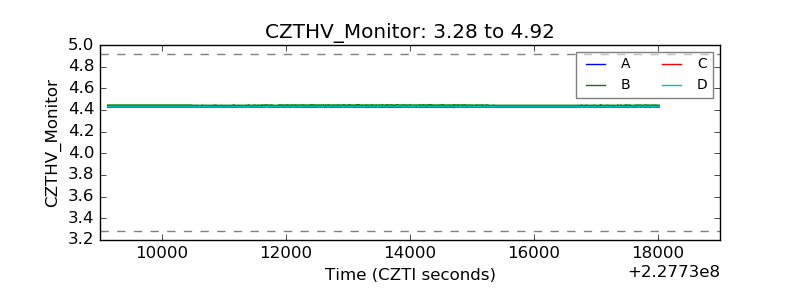 |
| D_VDD | 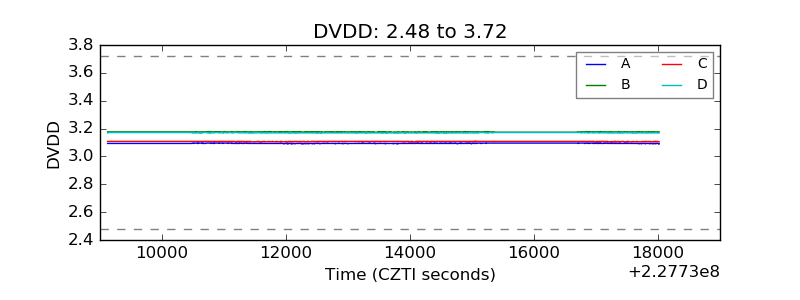 |
| Temperature 1 | 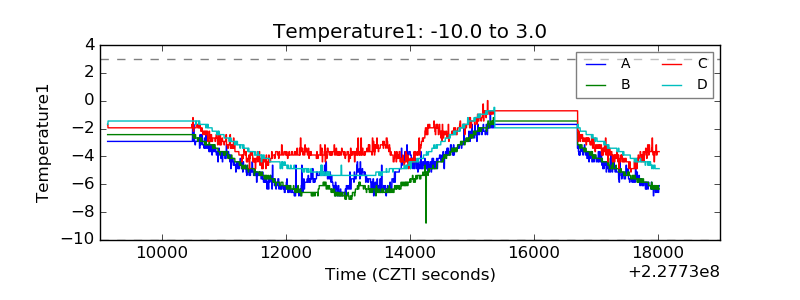 |
| Veto HV Monitor | 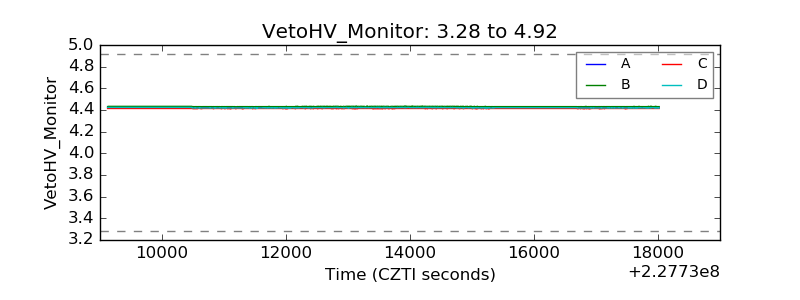 |
| Veto LLD | 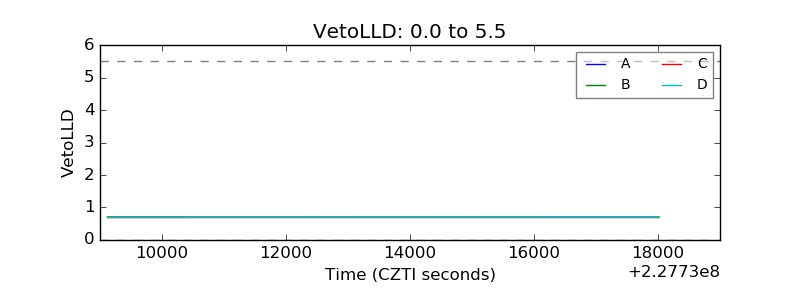 |
| Alpha Counter | 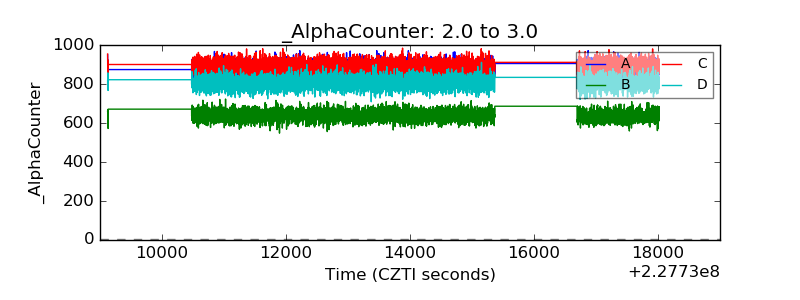 |
| _CPM_Rate | 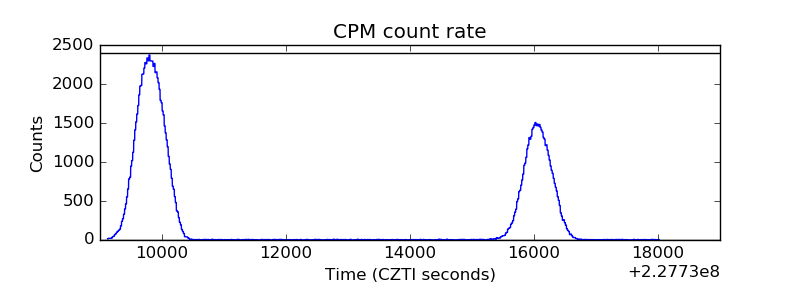 |
| CZT Counter | 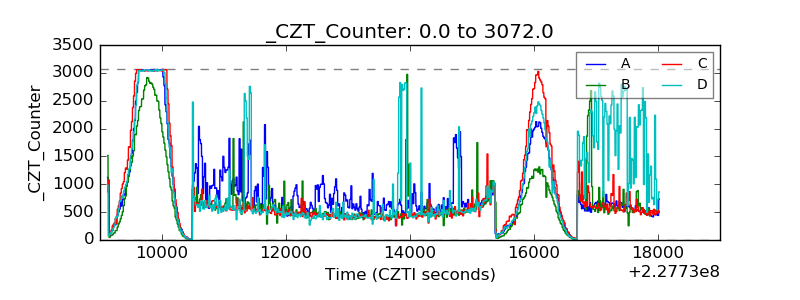 |
| +2.5 Volts monitor |  |
| +5 Volts monitor |  |
| _ROLL_ROT | 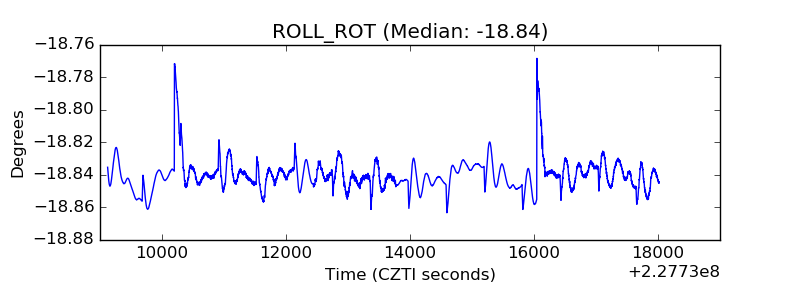 |
| _Roll_DEC | 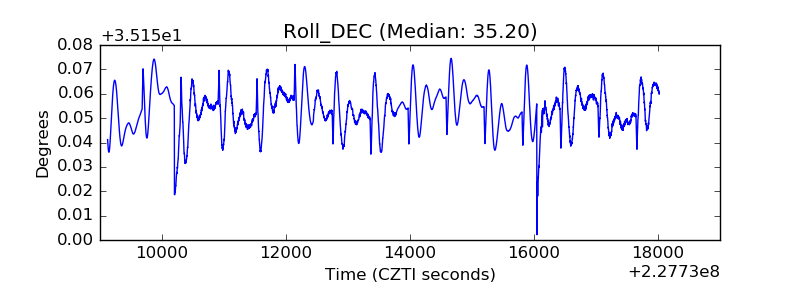 |
| _Roll_RA | 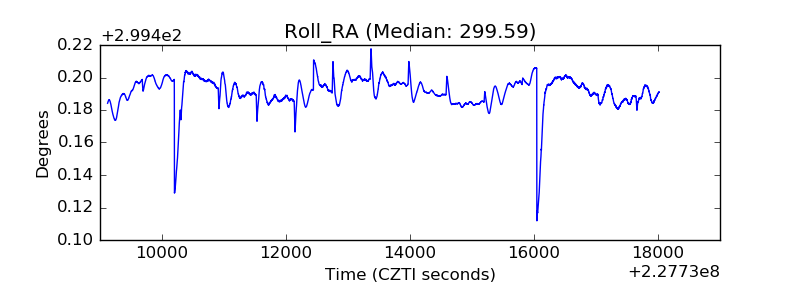 |
| Veto Counter | 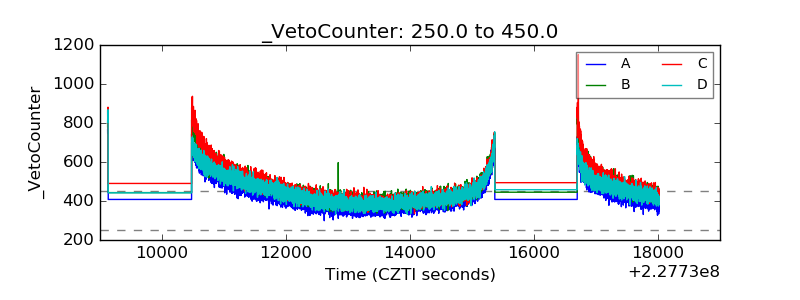 |