| Param | Original file | Final file |
|---|---|---|
| Filename | modeM0/AS1G06_028T01_9000001094_07991cztM0_level2.evt | modeM0/AS1G06_028T01_9000001094_07991cztM0_level2_quad_clean.evt |
| Size (bytes) | 542,430,720 | 99,656,640 |
| Size | 517.3 MB | 95.0 MB |
| Events in quadrant A | 3,319,486 | 651,035 |
| Events in quadrant B | 3,212,437 | 671,664 |
| Events in quadrant C | 3,117,517 | 681,585 |
| Events in quadrant D | 6,366,864 | 589,885 |
| Mode M0 | |||
|---|---|---|---|
| Quadrant | BADHDUFLAG | Total packets | Discarded packets |
| A | 0 | 13916 | 2 |
| B | 0 | 13535 | 1 |
| C | 0 | 13074 | 1 |
| D | 0 | 23103 | 1 |
| Mode M9 | |||
|---|---|---|---|
| Quadrant | BADHDUFLAG | Total packets | Discarded packets |
| A | 0 | 12 | 0 |
| B | 0 | 12 | 0 |
| C | 0 | 12 | 0 |
| D | 0 | 12 | 0 |
| Mode SS | |||
|---|---|---|---|
| Quadrant | BADHDUFLAG | Total packets | Discarded packets |
| A | 0 | 122 | 0 |
| B | 0 | 122 | 0 |
| C | 0 | 122 | 0 |
| D | 0 | 122 | 0 |
| Quadrant | Total seconds | Saturated seconds | Saturation percentage |
|---|---|---|---|
| A | 6072 | 59 | 0.971673% |
| B | 6072 | 84 | 1.383399% |
| C | 6072 | 23 | 0.378788% |
| D | 6072 | 947 | 15.596179% |
Noise dominated data is calculated using 1-second bins in cleaned event files. If a bin has >2000 counts, and if more than 50% of those come from <1% of pixels, then it is considered to be noise-dominated and hence unusable.
| Quadrant | # 1 sec bins | Bins with >0 counts | Bins with >2000 counts | High rate bins dominated by noise | Noise dominated (total time) | Noise dominated (detector-on time) | Marked lightcurve |
|---|---|---|---|---|---|---|---|
| A | 7257 | 6073 | 9 | 9 | 0.12% | 0.15% | 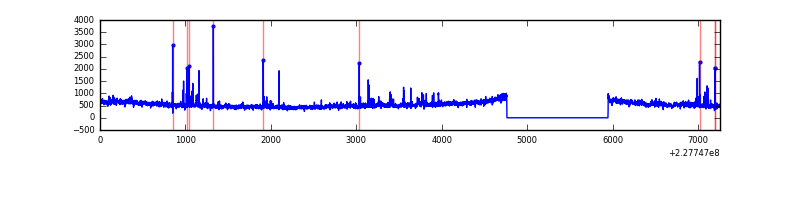 |
| B | 7257 | 6073 | 20 | 20 | 0.28% | 0.33% | 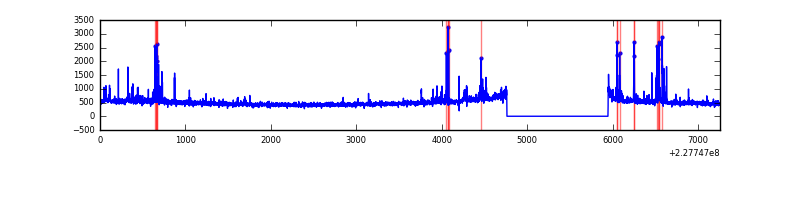 |
| C | 7257 | 6073 | 0 | 0 | 0.00% | 0.00% | 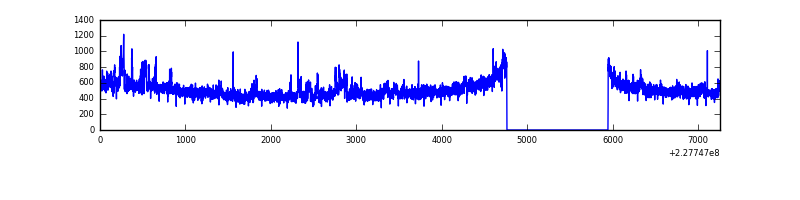 |
| D | 7257 | 6073 | 762 | 762 | 10.50% | 12.55% | 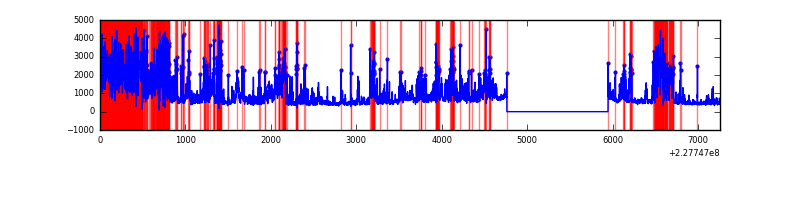 |
Top three noisy pixels from each quadrant. If the there are fewer than three noisy pixels in the level2.evt file, extra rows are filled as -1
| Pixel properties | Quadrant properties | ||||||
|---|---|---|---|---|---|---|---|
| Quadrant | DetID | PixID | Counts | Sigma | Mean | Median | Sigma |
| A | 15 | 239 | 327915 | 2154.55 | 745 | 730 | 151.9 |
| A | 4 | 2 | 94252 | 615.85 | 745 | 730 | 151.9 |
| A | 13 | 248 | 22074 | 140.55 | 745 | 730 | 151.9 |
| B | 4 | 239 | 195188 | 1367.43 | 755 | 740 | 142.2 |
| B | 0 | 214 | 24141 | 164.56 | 755 | 740 | 142.2 |
| B | 11 | 51 | 18396 | 124.16 | 755 | 740 | 142.2 |
| C | 1 | 16 | 225413 | 1311.91 | 740 | 748 | 171.2 |
| C | 13 | 61 | 5625 | 28.48 | 740 | 748 | 171.2 |
| C | 12 | 4 | 3622 | 16.78 | 740 | 748 | 171.2 |
| D | 1 | 83 | 3224202 | 19282.86 | 682 | 662 | 167.2 |
| D | 1 | 52 | 288581 | 1722.3 | 682 | 662 | 167.2 |
| D | 12 | 233 | 153220 | 912.59 | 682 | 662 | 167.2 |
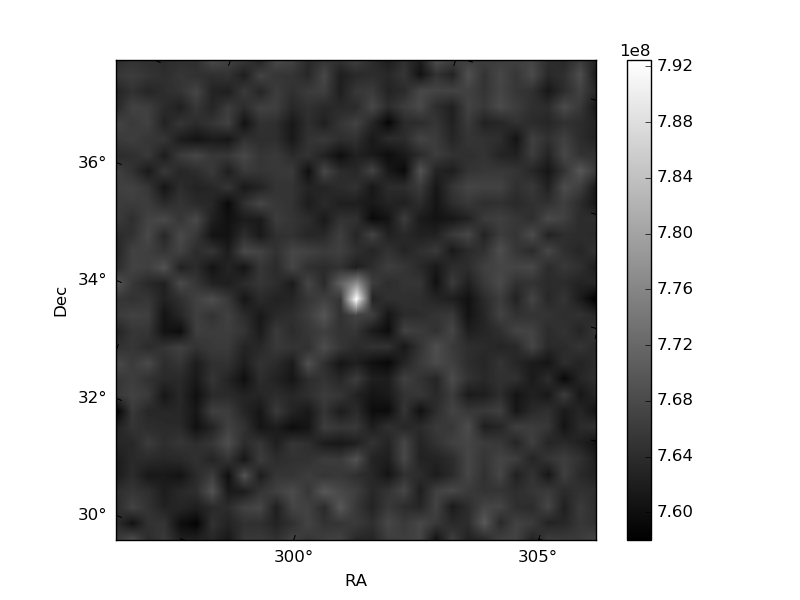
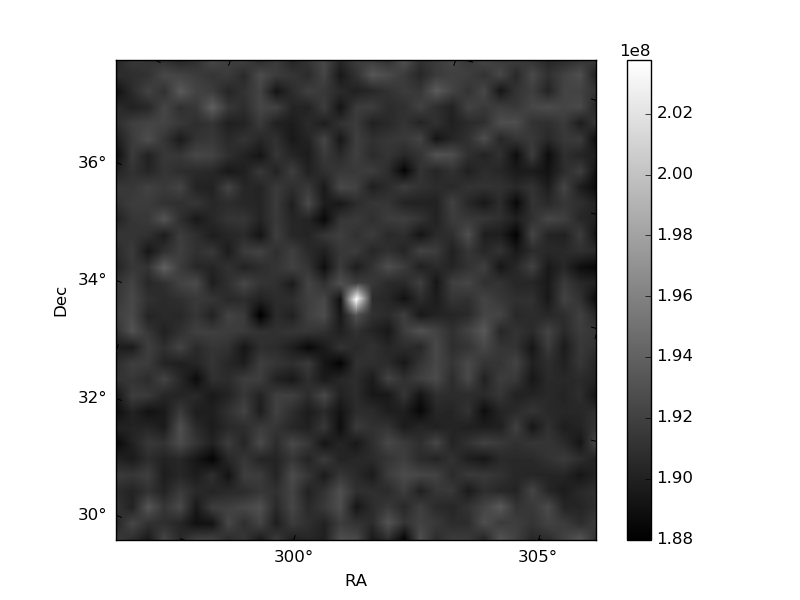
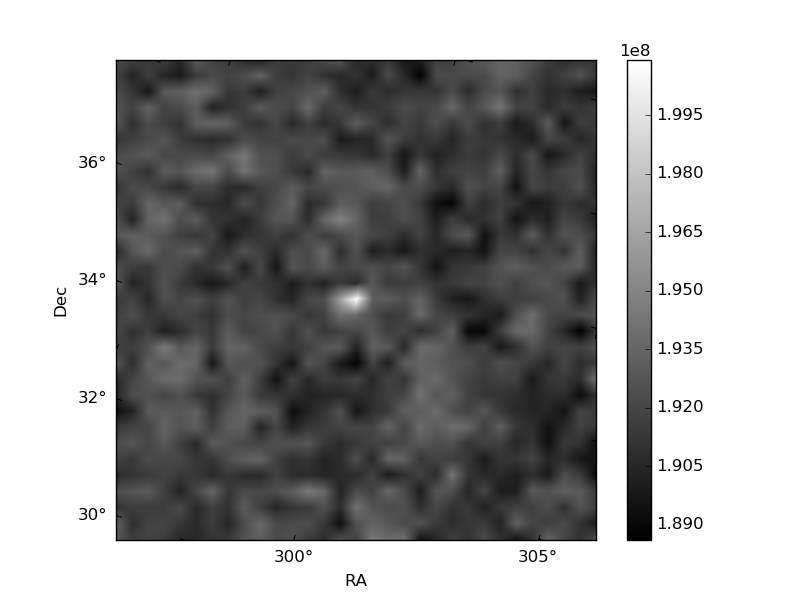
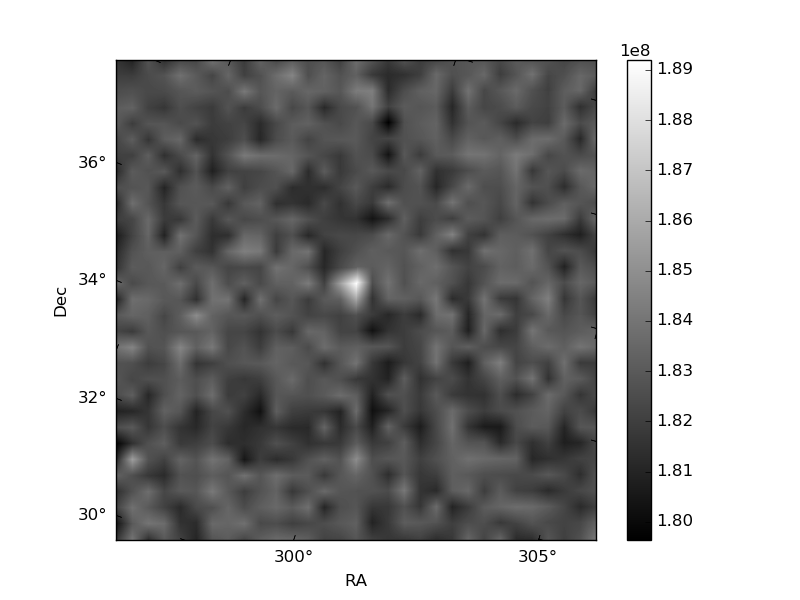
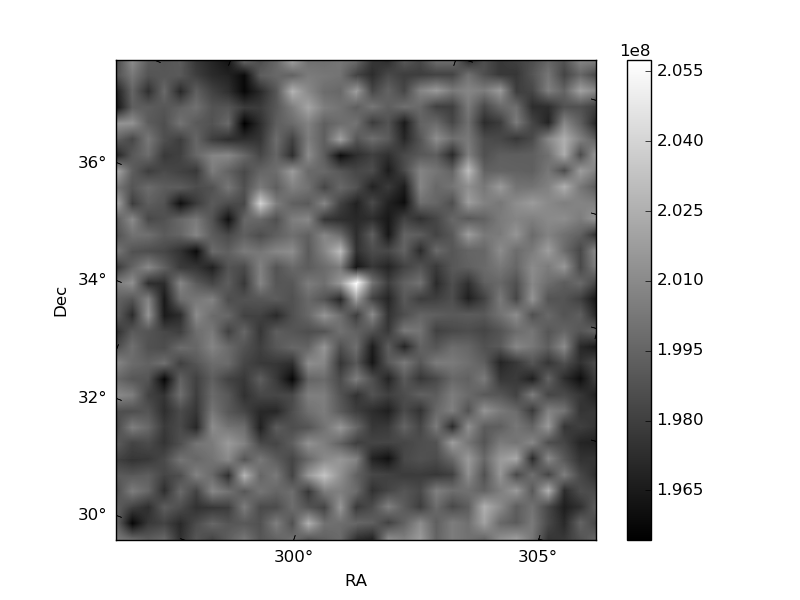
Histogram calculated using DETX and DETY for each event in the final _common_clean file
| Quadrant A | 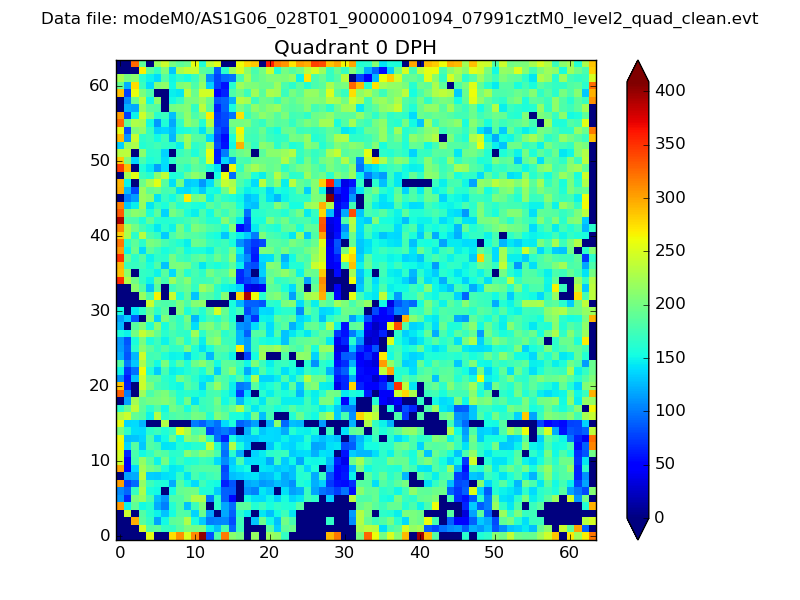 |
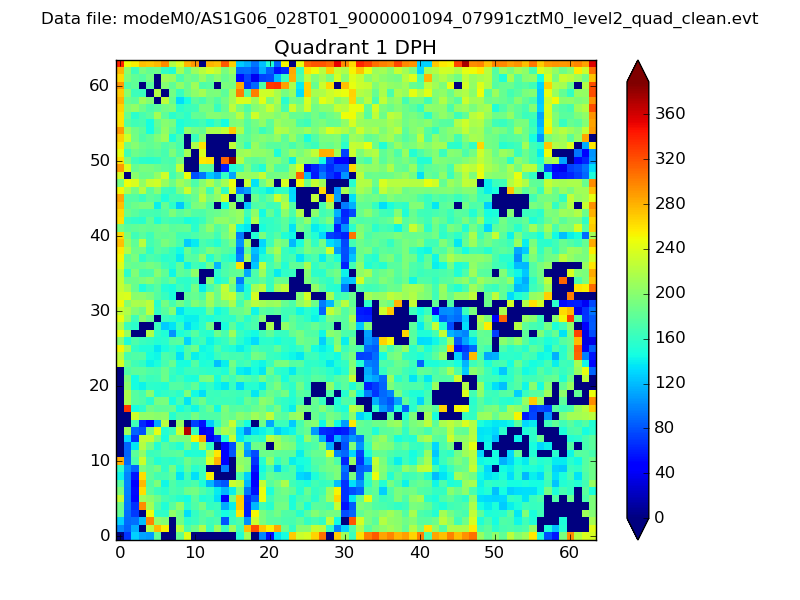 |
Quadrant B |
|---|---|---|---|
| Quadrant D | 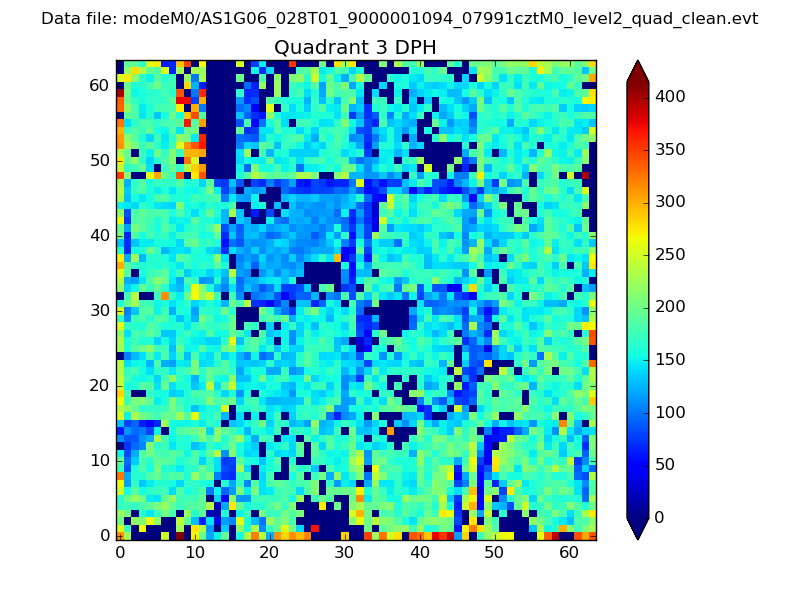 |
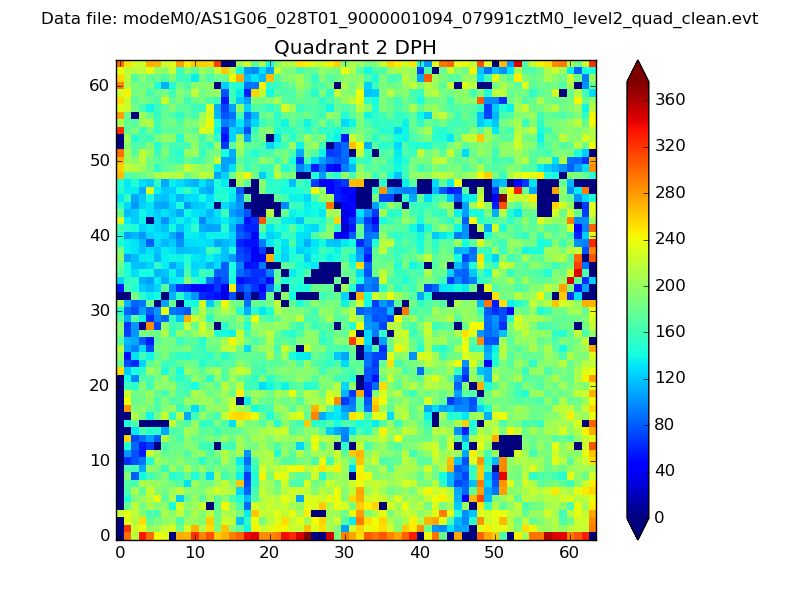 |
Quadrant C |
| Plot type | Count rate plots | Images |
|---|---|---|
| Comparison with Poisson distribution Blue bars denote a histogram of data divided into 1 sec bins. Red curve is a Poisson curve with rate = median count rate of data. |
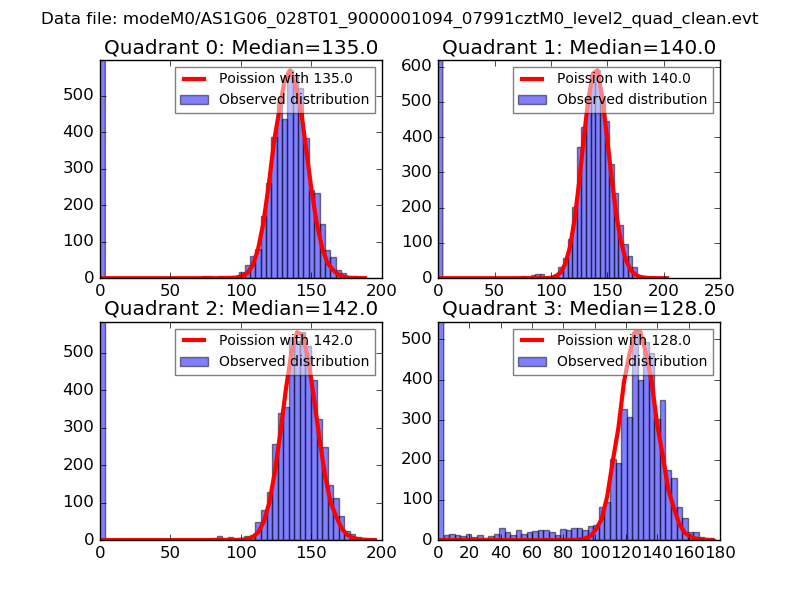 |
 |
| Quadrant-wise count rates Data is divided into 100 sec bins |
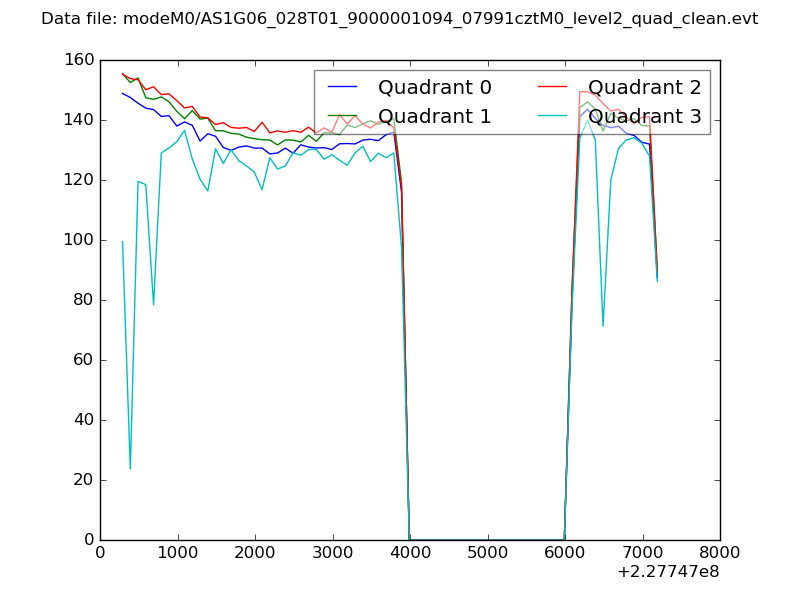 |
|
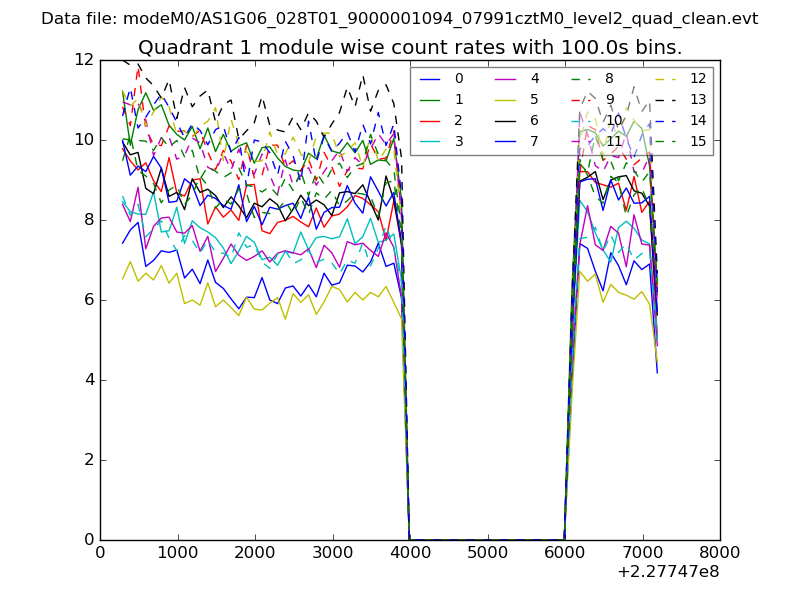
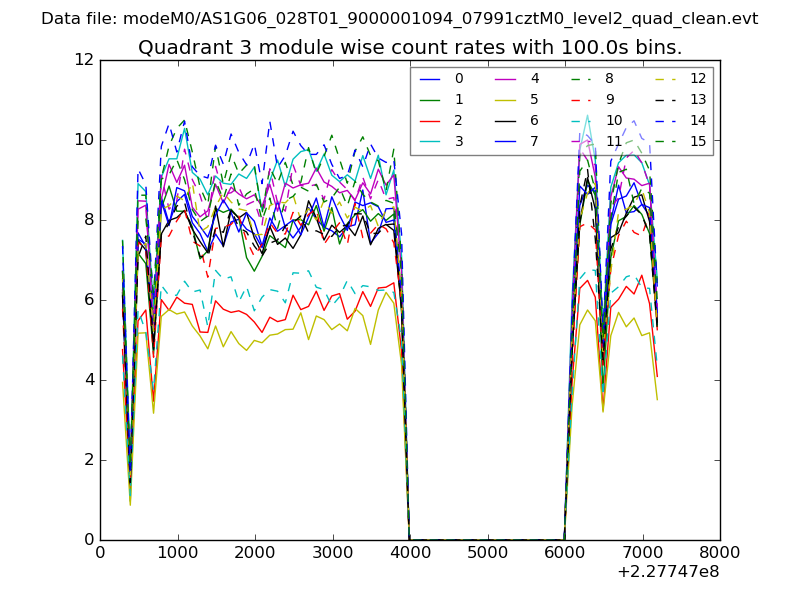
| Module-wise count rates for Quadrant A Data is divided into 100 sec bins |
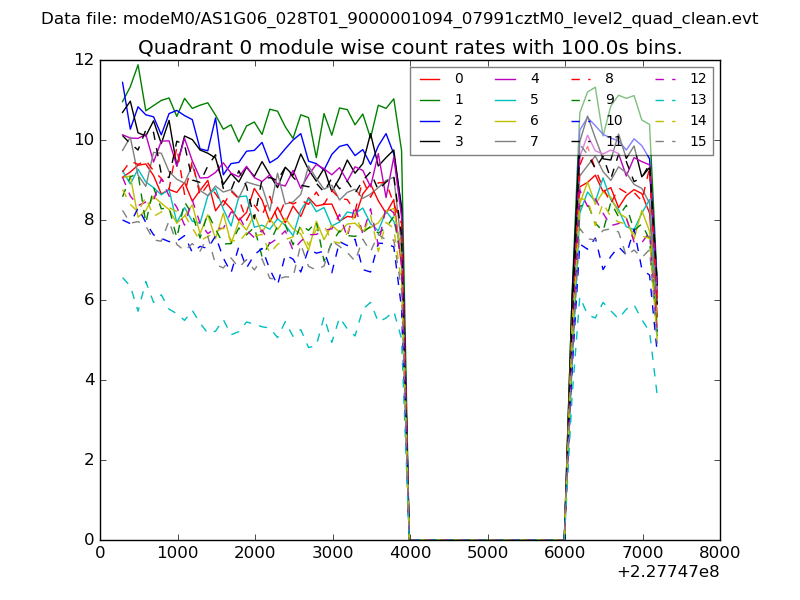 |
 |
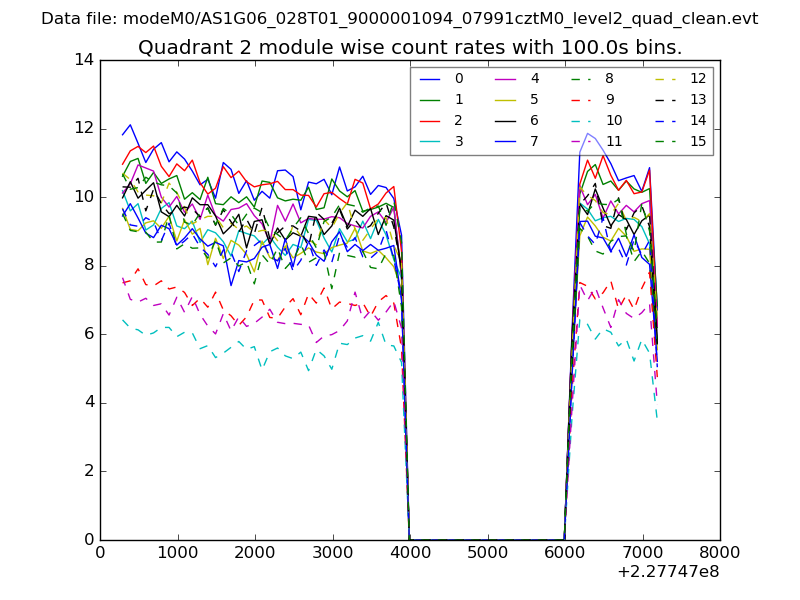
| Module-wise count rates for Quadrant B Data is divided into 100 sec bins |
 |
 |
| Module-wise count rates for Quadrant C Data is divided into 100 sec bins |
 |
 |
| Module-wise count rates for Quadrant D Data is divided into 100 sec bins |
 |
 |
| Parameter | Plot |
|---|---|
| CZT HV Monitor | 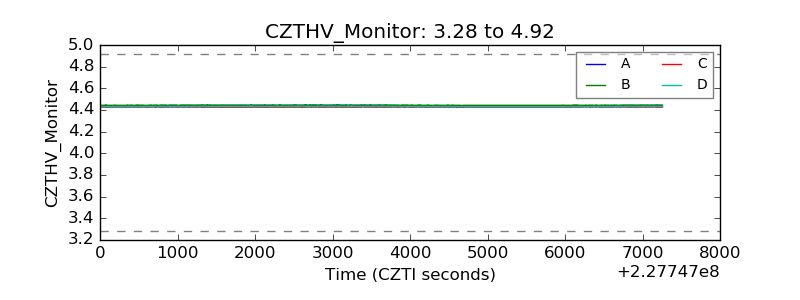 |
| D_VDD | 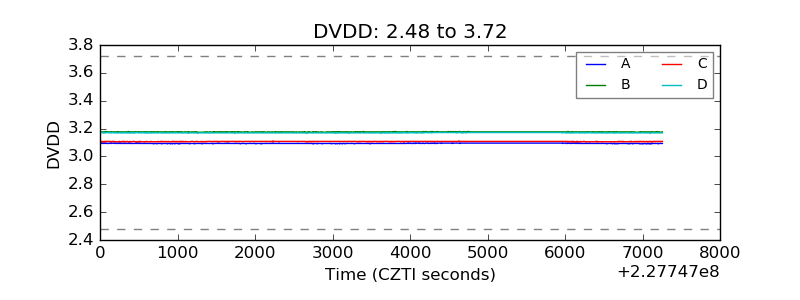 |
| Temperature 1 | 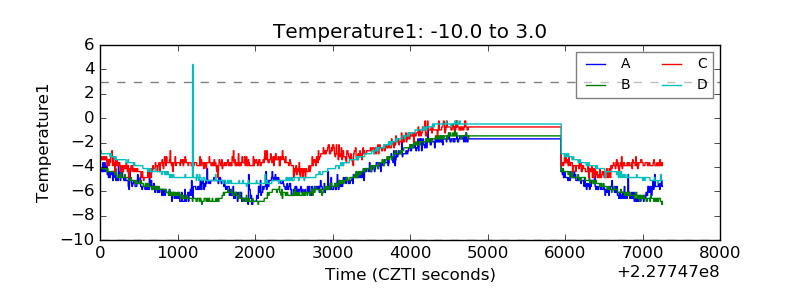 |
| Veto HV Monitor | 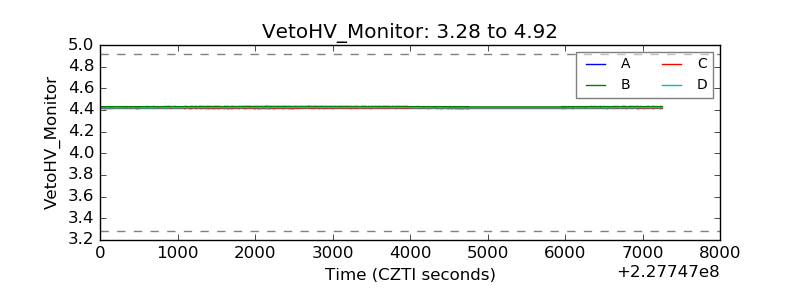 |
| Veto LLD | 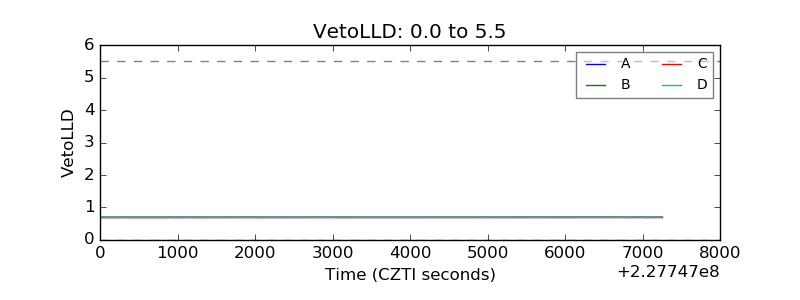 |
| Alpha Counter | 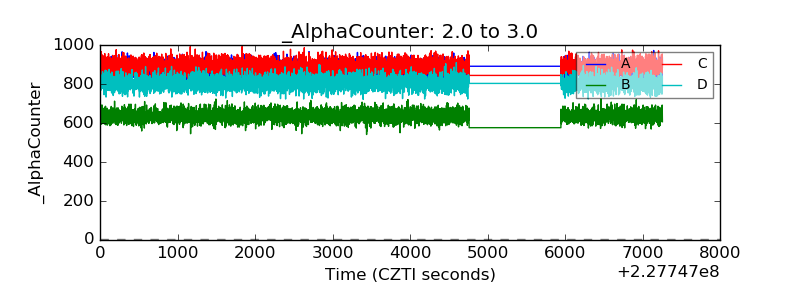 |
| _CPM_Rate | 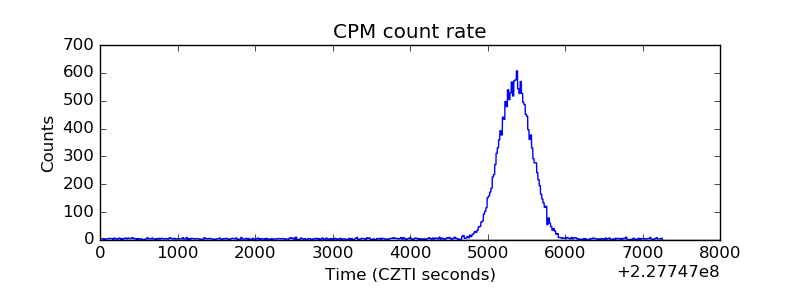 |
| CZT Counter | 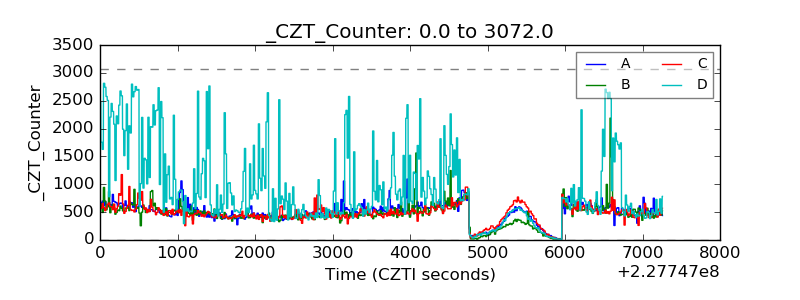 |
| +2.5 Volts monitor |  |
| +5 Volts monitor |  |
| _ROLL_ROT | 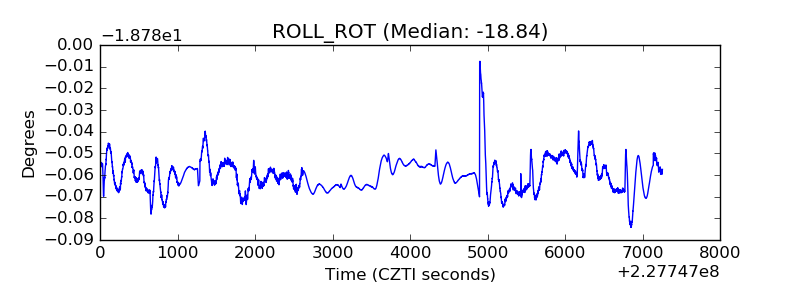 |
| _Roll_DEC | 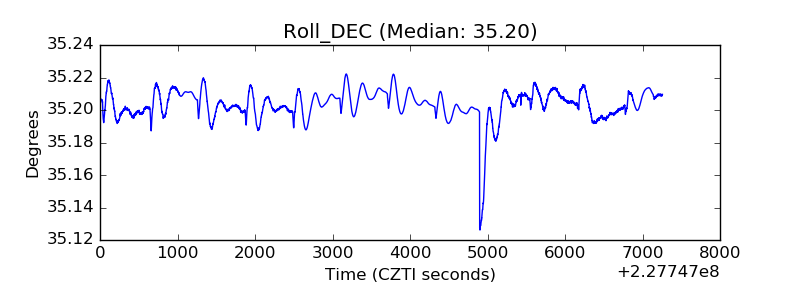 |
| _Roll_RA | 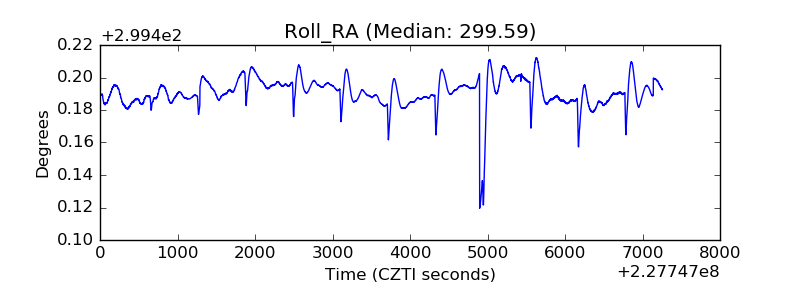 |
| Veto Counter | 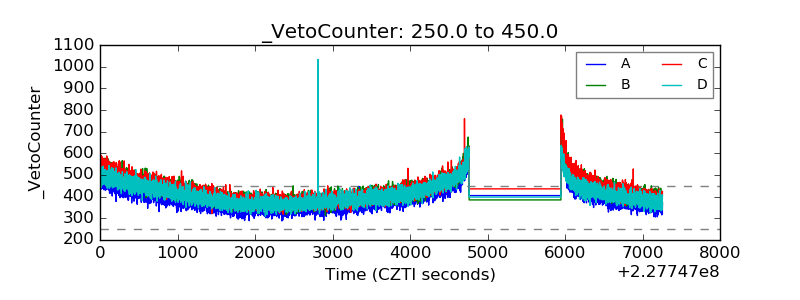 |