| Param | Original file | Final file |
|---|---|---|
| Filename | modeM0/AS1G06_028T01_9000001094_07993cztM0_level2.evt | modeM0/AS1G06_028T01_9000001094_07993cztM0_level2_quad_clean.evt |
| Size (bytes) | 297,878,400 | 71,265,600 |
| Size | 284.1 MB | 68.0 MB |
| Events in quadrant A | 1,984,047 | 466,223 |
| Events in quadrant B | 1,911,980 | 478,749 |
| Events in quadrant C | 1,802,850 | 485,609 |
| Events in quadrant D | 3,046,441 | 442,330 |
| Mode M0 | |||
|---|---|---|---|
| Quadrant | BADHDUFLAG | Total packets | Discarded packets |
| A | 0 | 8470 | 0 |
| B | 0 | 8484 | 0 |
| C | 0 | 8141 | 0 |
| D | 0 | 11812 | 0 |
| Mode SS | |||
|---|---|---|---|
| Quadrant | BADHDUFLAG | Total packets | Discarded packets |
| A | 0 | 82 | 0 |
| B | 0 | 82 | 0 |
| C | 0 | 82 | 0 |
| D | 0 | 82 | 0 |
| Quadrant | Total seconds | Saturated seconds | Saturation percentage |
|---|---|---|---|
| A | 4037 | 11 | 0.272480% |
| B | 4037 | 23 | 0.569730% |
| C | 4037 | 0 | 0.000000% |
| D | 4037 | 193 | 4.780778% |
Noise dominated data is calculated using 1-second bins in cleaned event files. If a bin has >2000 counts, and if more than 50% of those come from <1% of pixels, then it is considered to be noise-dominated and hence unusable.
| Quadrant | # 1 sec bins | Bins with >0 counts | Bins with >2000 counts | High rate bins dominated by noise | Noise dominated (total time) | Noise dominated (detector-on time) | Marked lightcurve |
|---|---|---|---|---|---|---|---|
| A | 4037 | 4037 | 10 | 10 | 0.25% | 0.25% | 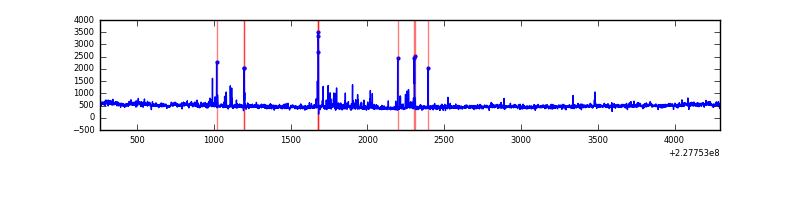 |
| B | 4037 | 4037 | 5 | 5 | 0.12% | 0.12% | 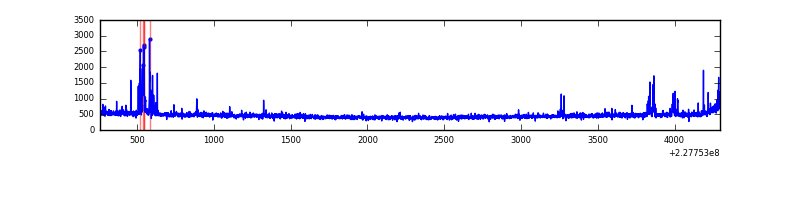 |
| C | 4037 | 4037 | 0 | 0 | 0.00% | 0.00% | 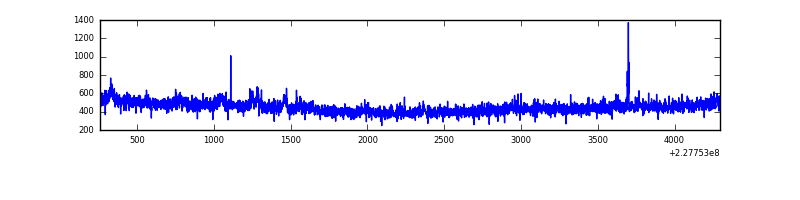 |
| D | 4037 | 4037 | 173 | 173 | 4.29% | 4.29% | 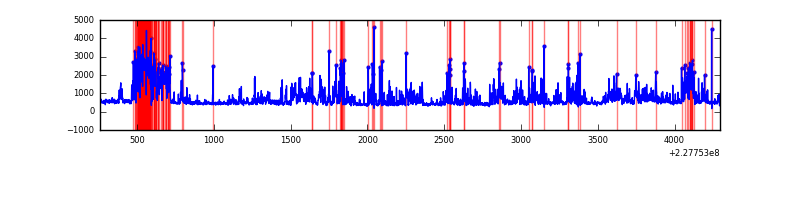 |
Top three noisy pixels from each quadrant. If the there are fewer than three noisy pixels in the level2.evt file, extra rows are filled as -1
| Pixel properties | Quadrant properties | ||||||
|---|---|---|---|---|---|---|---|
| Quadrant | DetID | PixID | Counts | Sigma | Mean | Median | Sigma |
| A | 15 | 239 | 139517 | 1473.07 | 455 | 448 | 94.4 |
| A | 4 | 2 | 83799 | 882.88 | 455 | 448 | 94.4 |
| A | 13 | 251 | 4385 | 41.7 | 455 | 448 | 94.4 |
| B | 4 | 239 | 89226 | 1000.21 | 461 | 451 | 88.8 |
| B | 11 | 51 | 12974 | 141.09 | 461 | 451 | 88.8 |
| B | 10 | 16 | 10490 | 113.11 | 461 | 451 | 88.8 |
| C | 1 | 16 | 41290 | 389.24 | 449 | 453 | 104.9 |
| C | 12 | 4 | 6364 | 56.34 | 449 | 453 | 104.9 |
| C | 13 | 61 | 3275 | 26.9 | 449 | 453 | 104.9 |
| D | 1 | 83 | 1249293 | 11696.2 | 434 | 422 | 106.8 |
| D | 1 | 52 | 62064 | 577.3 | 434 | 422 | 106.8 |
| D | 2 | 14 | 55220 | 513.21 | 434 | 422 | 106.8 |
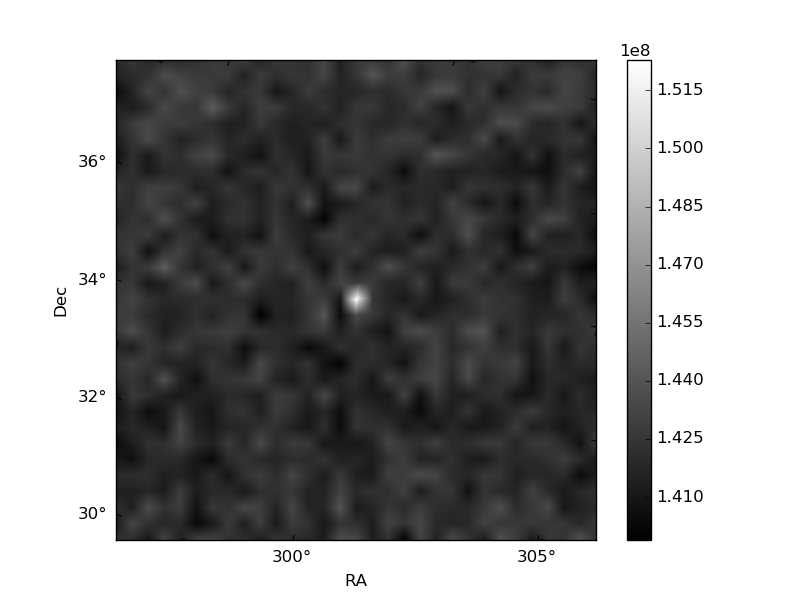
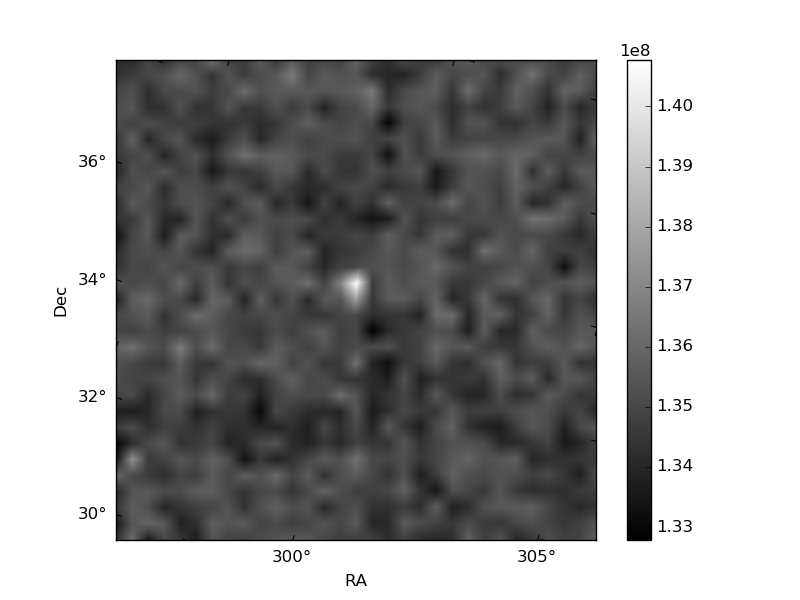
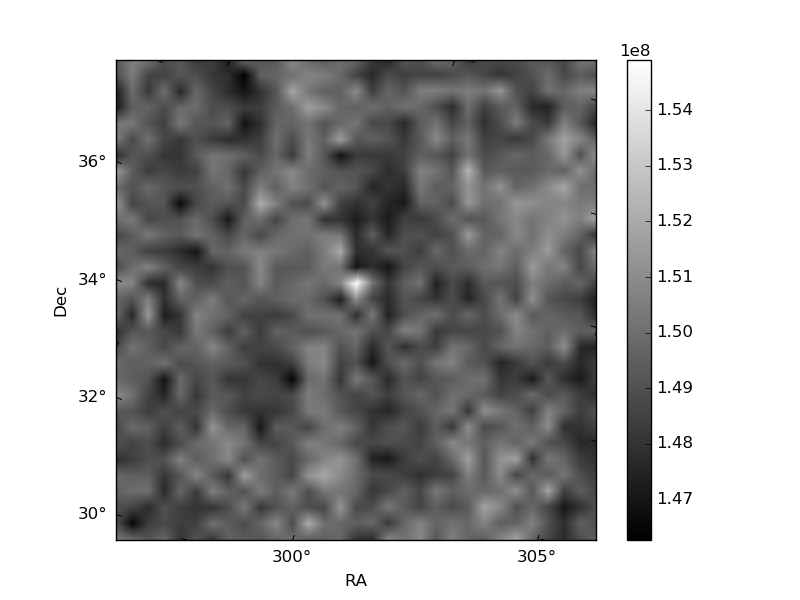
Histogram calculated using DETX and DETY for each event in the final _common_clean file
| Quadrant A | 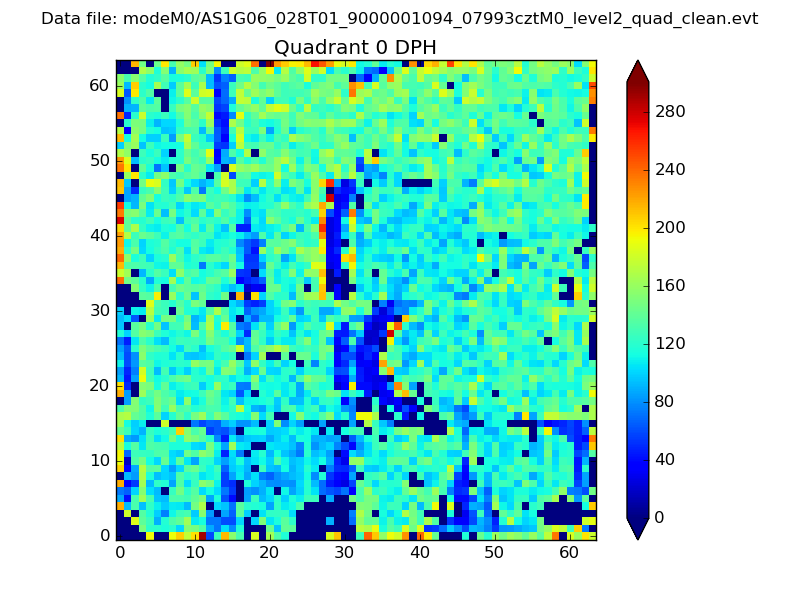 |
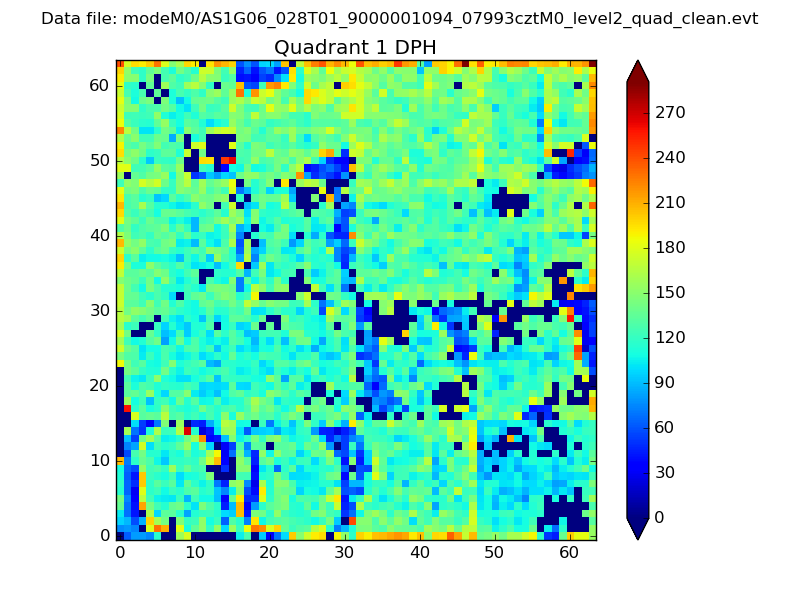 |
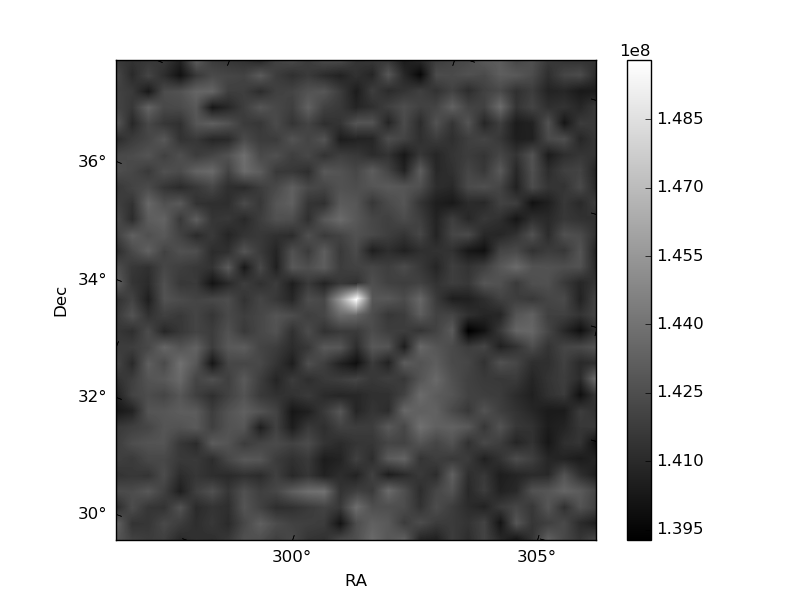
Quadrant B |
|---|---|---|---|
| Quadrant D | 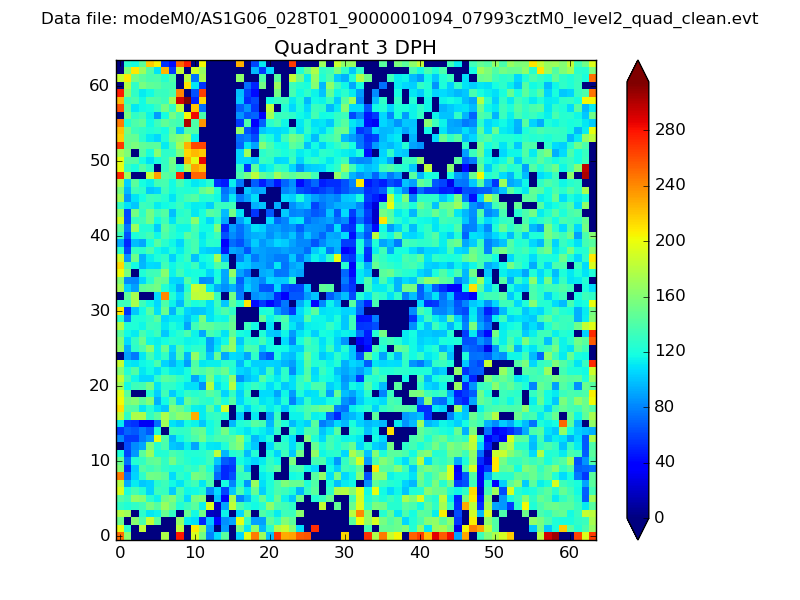 |
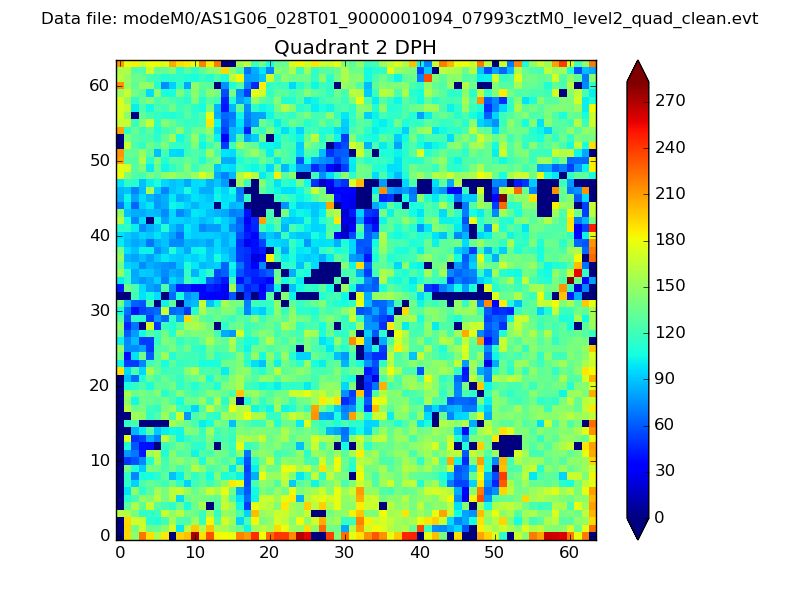 |
Quadrant C |
| Plot type | Count rate plots | Images |
|---|---|---|
| Comparison with Poisson distribution Blue bars denote a histogram of data divided into 1 sec bins. Red curve is a Poisson curve with rate = median count rate of data. |
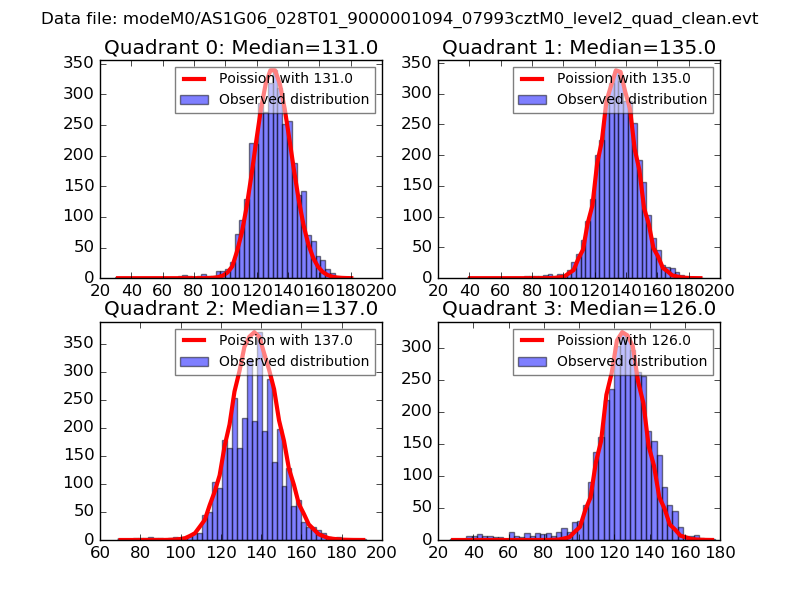 |
 |
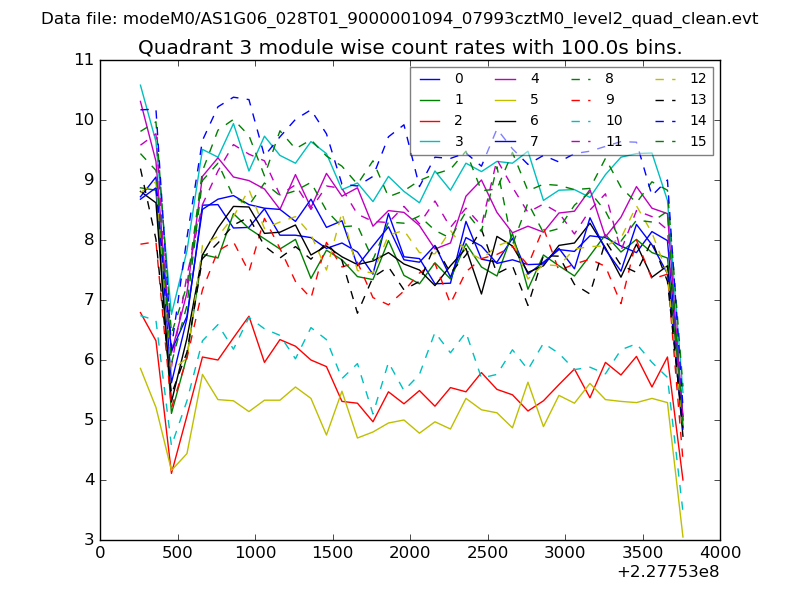
| Quadrant-wise count rates Data is divided into 100 sec bins |
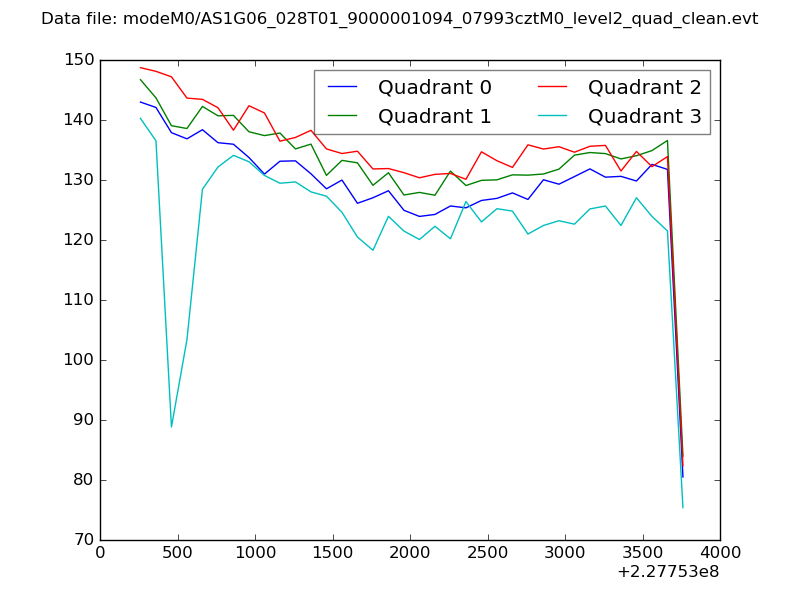 |
|
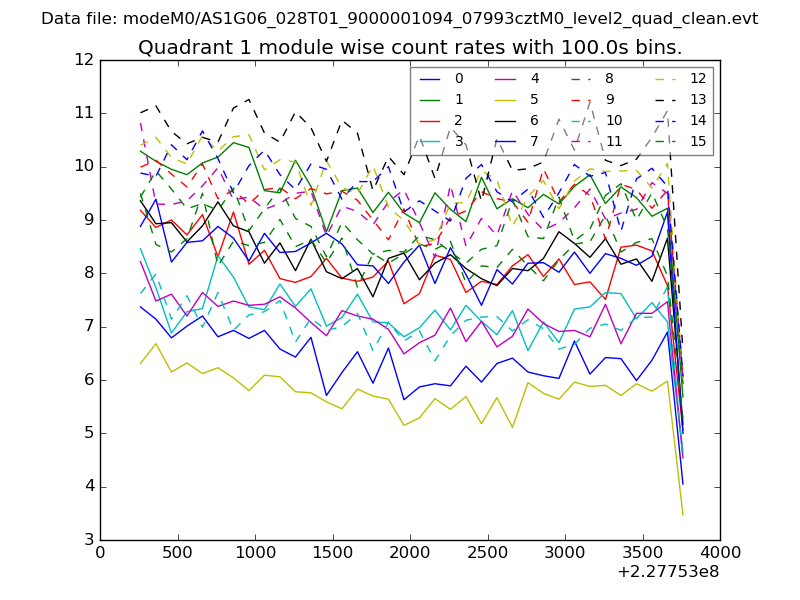
| Module-wise count rates for Quadrant A Data is divided into 100 sec bins |
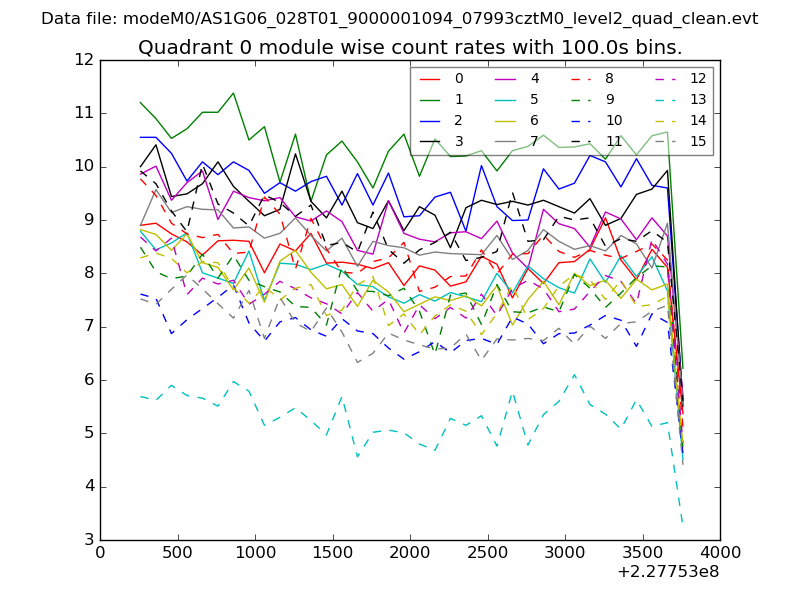 |
 |
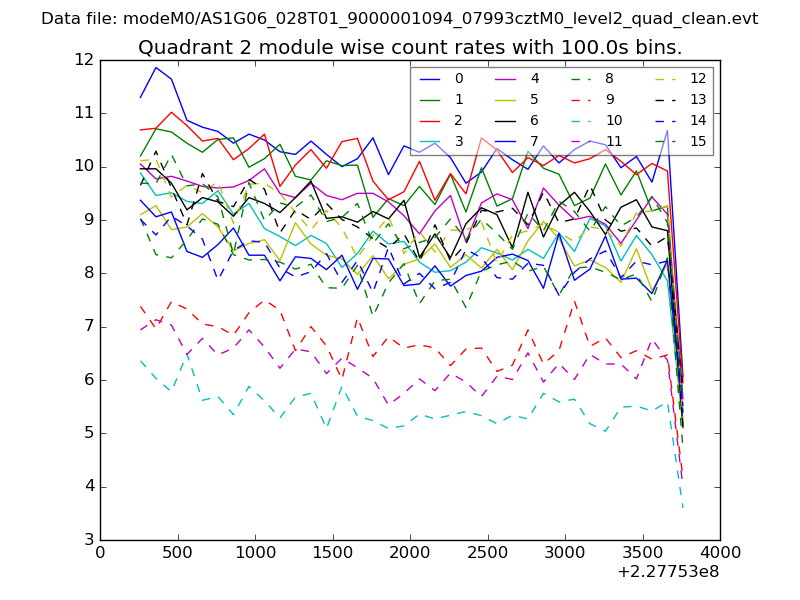
| Module-wise count rates for Quadrant B Data is divided into 100 sec bins |
 |
 |
| Module-wise count rates for Quadrant C Data is divided into 100 sec bins |
 |
 |
| Module-wise count rates for Quadrant D Data is divided into 100 sec bins |
 |
 |
| Parameter | Plot |
|---|---|
| CZT HV Monitor | 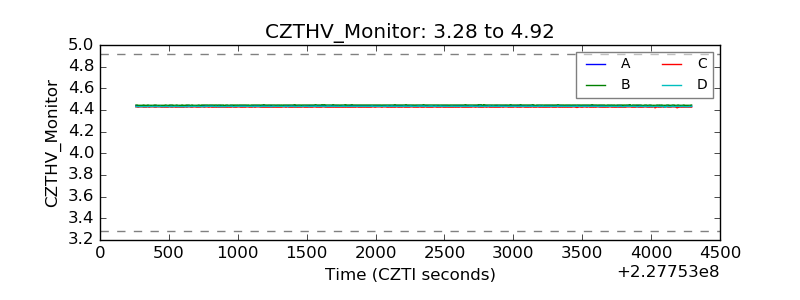 |
| D_VDD | 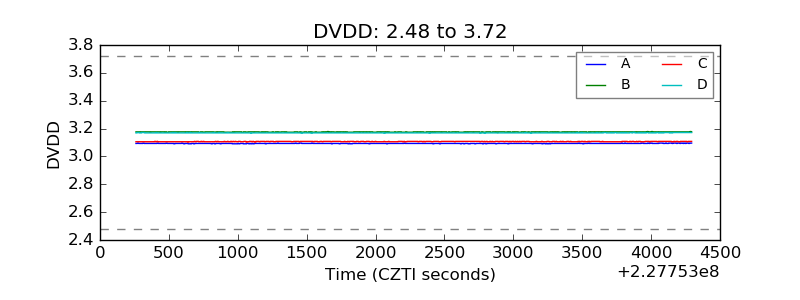 |
| Temperature 1 | 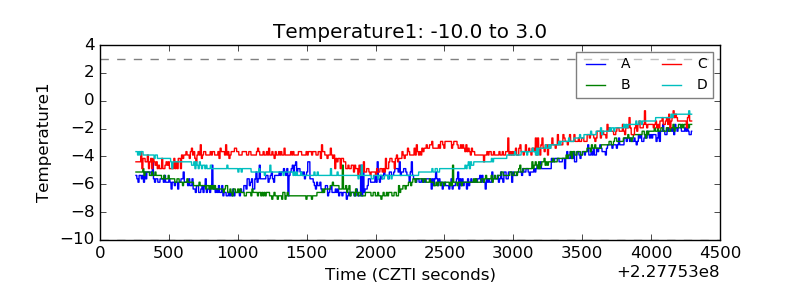 |
| Veto HV Monitor | 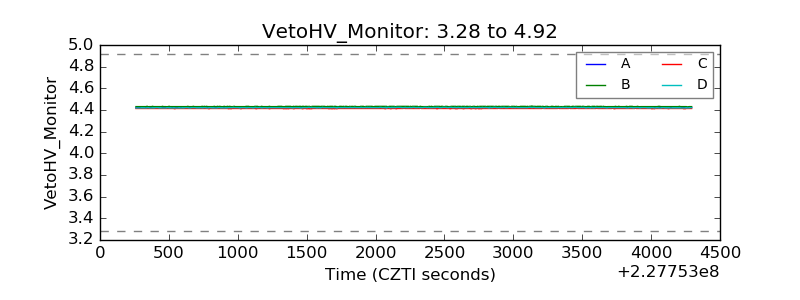 |
| Veto LLD | 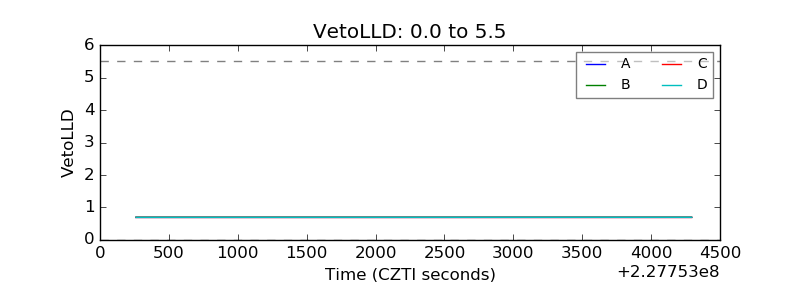 |
| Alpha Counter | 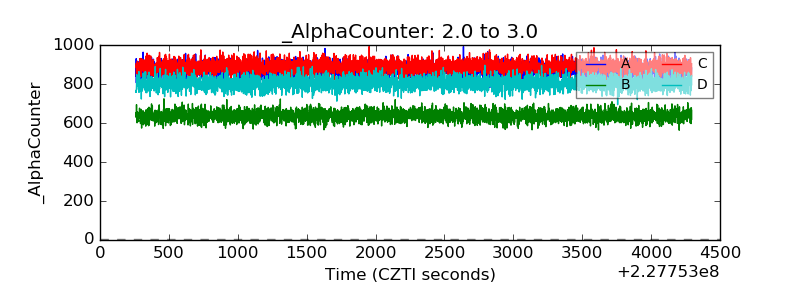 |
| _CPM_Rate | 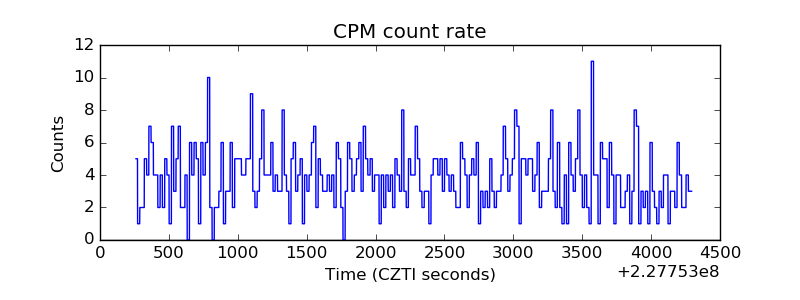 |
| CZT Counter | 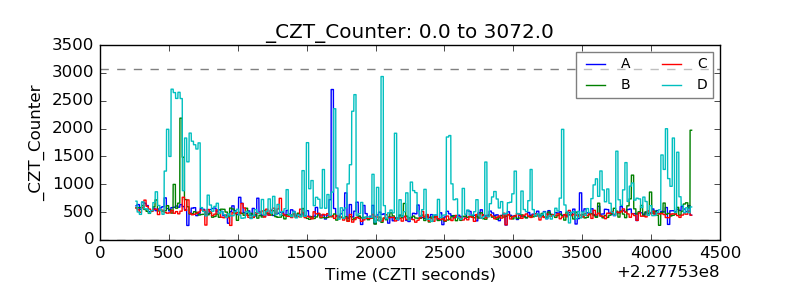 |
| +2.5 Volts monitor |  |
| +5 Volts monitor |  |
| _ROLL_ROT | 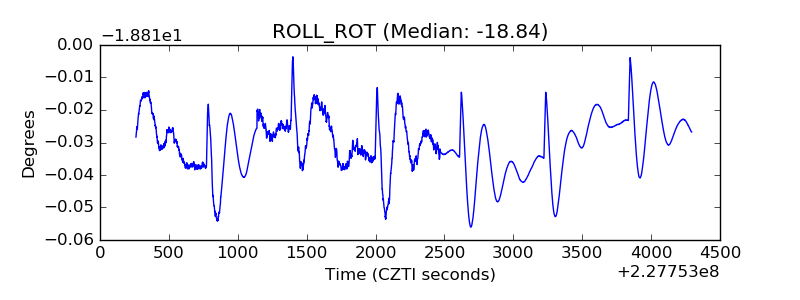 |
| _Roll_DEC | 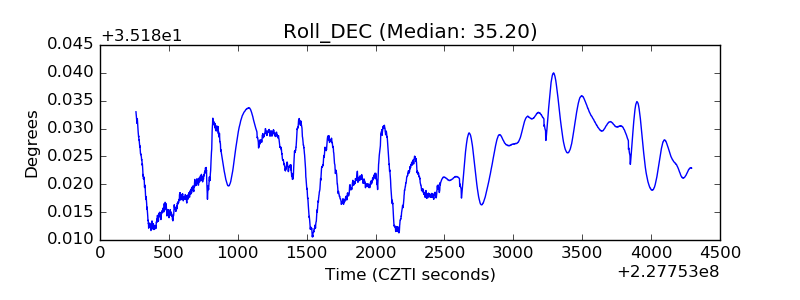 |
| _Roll_RA | 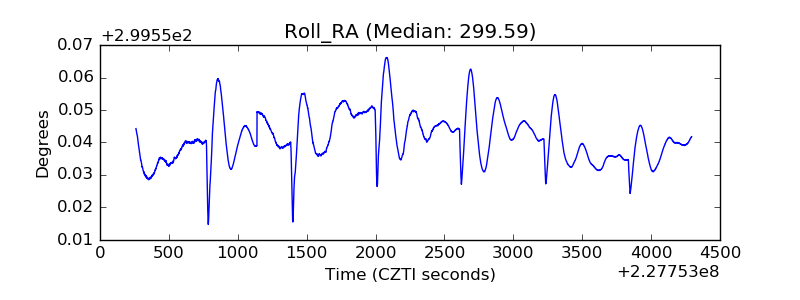 |
| Veto Counter | 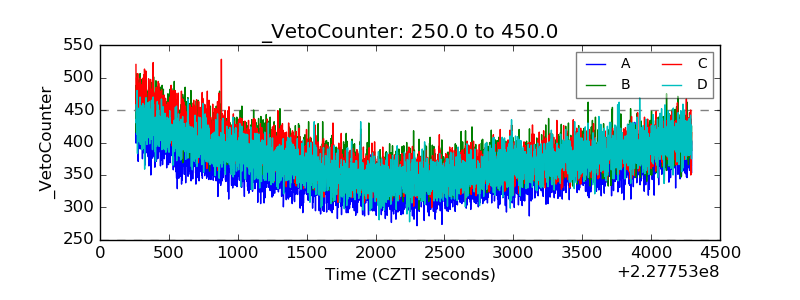 |