| Param | Original file | Final file |
|---|---|---|
| Filename | modeM0/AS1G06_168T20_9000001092cztM0_level2.fits | modeM0/AS1G06_168T20_9000001092cztM0_level2_quad_clean.evt |
| Size (bytes) | 57,507,840 | 44,853,120 |
| Size | 54.8 MB | 42.8 MB |
| Events in quadrant A | 344,790 | 242,338 |
| Events in quadrant B | 337,248 | 248,607 |
| Events in quadrant C | 353,032 | 244,685 |
| Events in quadrant D | 304,186 | 219,333 |
| Mode M0 | |||
|---|---|---|---|
| Quadrant | BADHDUFLAG | Total packets | Discarded packets |
| A | 0 | 15130 | 0 |
| B | 0 | 15267 | 0 |
| C | 0 | 14387 | 0 |
| D | 0 | 15890 | 0 |
| Mode M9 | |||
|---|---|---|---|
| Quadrant | BADHDUFLAG | Total packets | Discarded packets |
| A | 0 | 23 | 0 |
| B | 0 | 23 | 0 |
| C | 0 | 23 | 0 |
| D | 0 | 23 | 0 |
| Mode SS | |||
|---|---|---|---|
| Quadrant | BADHDUFLAG | Total packets | Discarded packets |
| A | 0 | 120 | 0 |
| B | 0 | 120 | 0 |
| C | 0 | 120 | 0 |
| D | 0 | 120 | 0 |
| Quadrant | Total seconds | Saturated seconds | Saturation percentage |
|---|---|---|---|
| A | 5752 | 71 | 1.234353% |
| B | 5752 | 365 | 6.345619% |
| C | 5752 | 99 | 1.721140% |
| D | 5752 | 235 | 4.085535% |
Noise dominated data is calculated using 1-second bins in cleaned event files. If a bin has >2000 counts, and if more than 50% of those come from <1% of pixels, then it is considered to be noise-dominated and hence unusable.
| Quadrant | # 1 sec bins | Bins with >0 counts | Bins with >2000 counts | High rate bins dominated by noise | Noise dominated (total time) | Noise dominated (detector-on time) | Marked lightcurve |
|---|---|---|---|---|---|---|---|
| A | 8093 | 5752 | 0 | 0 | 0.00% | 0.00% | 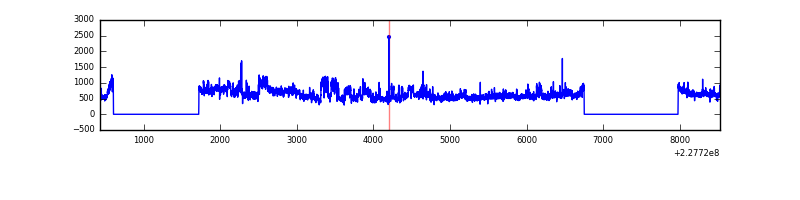 |
| B | 8093 | 5752 | 0 | 0 | 0.00% | 0.00% |  |
| C | 8093 | 5752 | 0 | 0 | 0.00% | 0.00% | 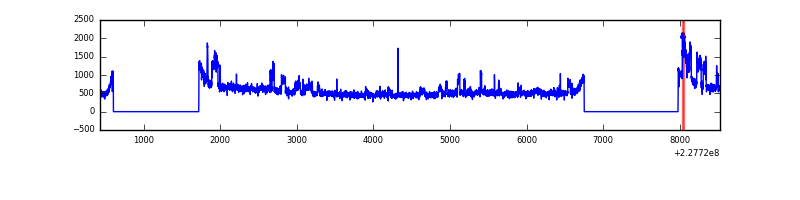 |
| D | 8093 | 5751 | 0 | 0 | 0.00% | 0.00% | 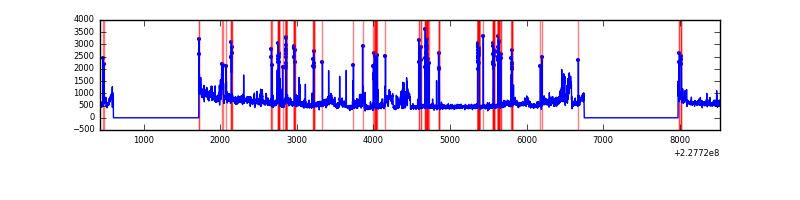 |
Top three noisy pixels from each quadrant. If the there are fewer than three noisy pixels in the level2.evt file, extra rows are filled as -1
| Pixel properties | Quadrant properties | ||||||
|---|---|---|---|---|---|---|---|
| Quadrant | DetID | PixID | Counts | Sigma | Mean | Median | Sigma |
| A | 14 | 188 | 349 | 10.79 | 89 | 84 | 24.6 |
| A | 14 | 204 | 317 | 9.48 | 89 | 84 | 24.6 |
| A | 0 | 29 | 299 | 8.75 | 89 | 84 | 24.6 |
| B | 2 | 9 | 288 | 9.87 | 89 | 85 | 20.6 |
| B | 5 | 225 | 242 | 7.63 | 89 | 85 | 20.6 |
| B | 5 | 232 | 242 | 7.63 | 89 | 85 | 20.6 |
| C | 1 | 80 | 275 | 7.25 | 93 | 87 | 25.9 |
| C | 1 | 81 | 273 | 7.17 | 93 | 87 | 25.9 |
| C | 1 | 65 | 254 | 6.44 | 93 | 87 | 25.9 |
| D | 6 | 231 | 244 | 6.64 | 86 | 79 | 24.8 |
| D | 10 | 189 | 220 | 5.68 | 86 | 79 | 24.8 |
| D | 3 | 159 | 220 | 5.68 | 86 | 79 | 24.8 |
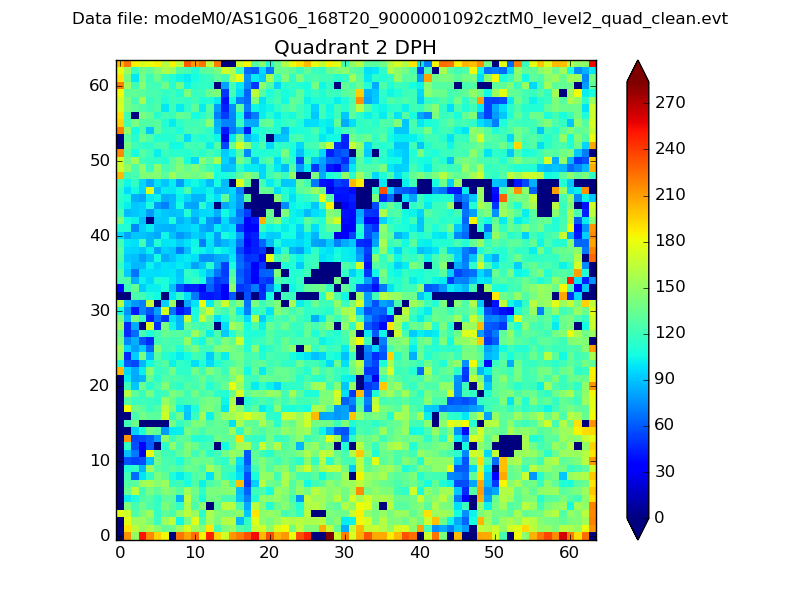
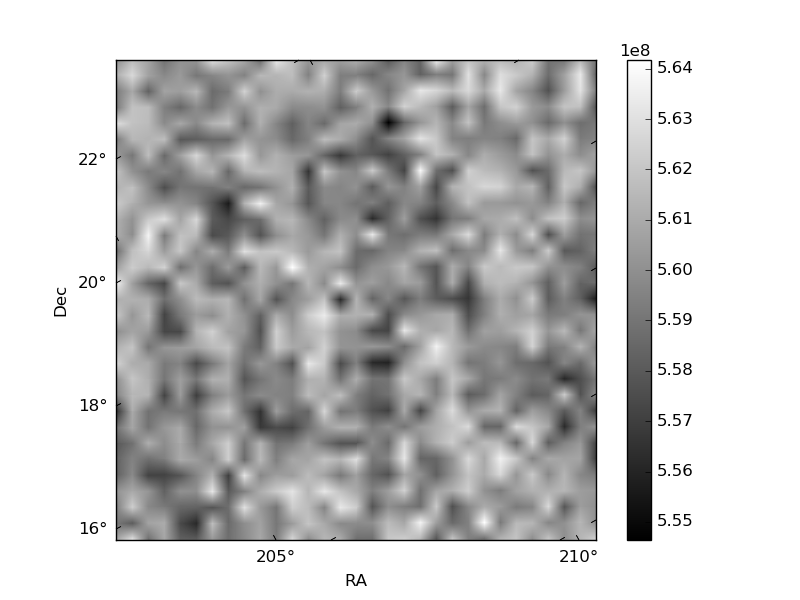
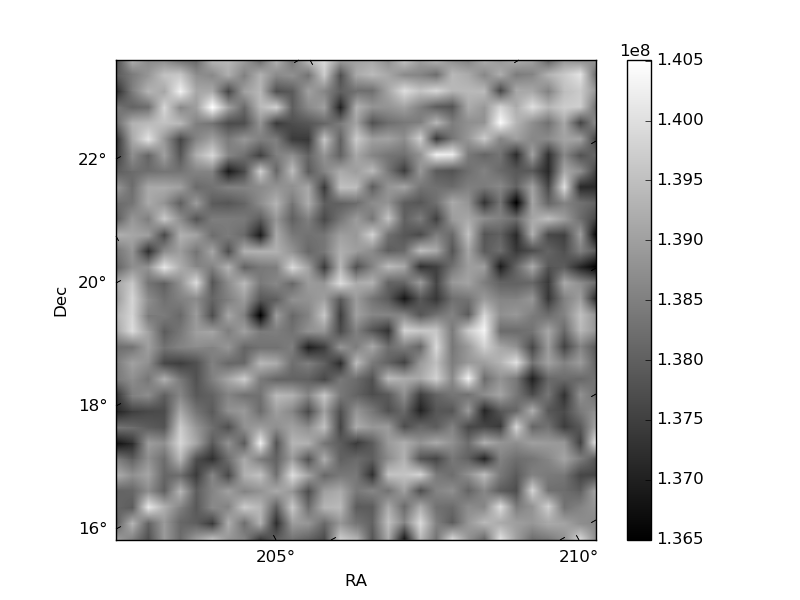
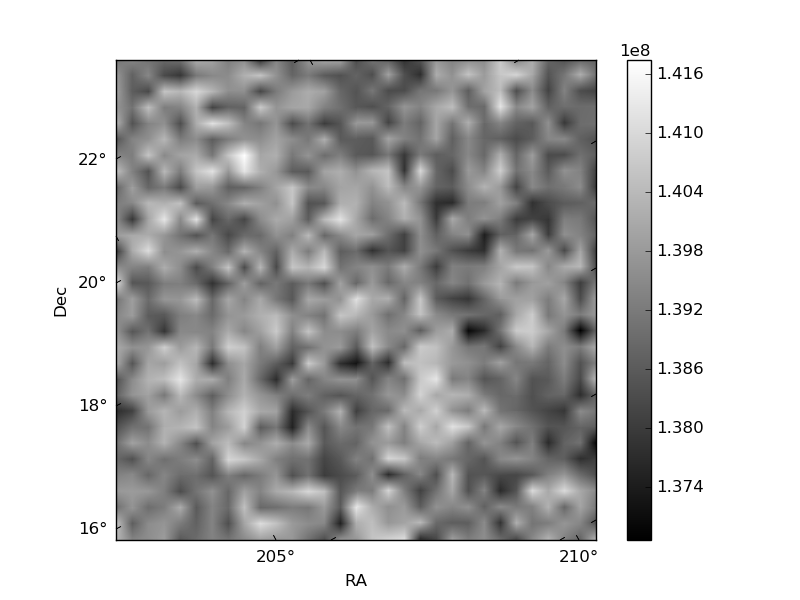
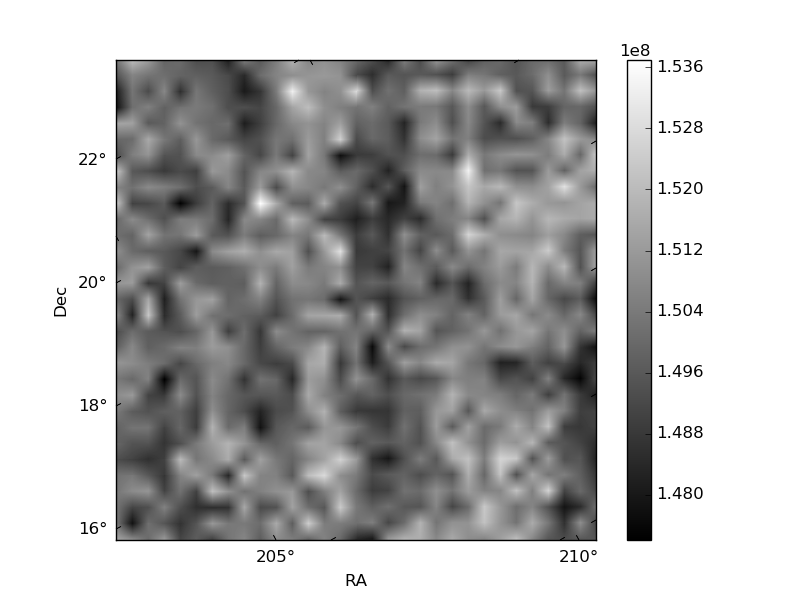
Histogram calculated using DETX and DETY for each event in the final _common_clean file
| Quadrant A | 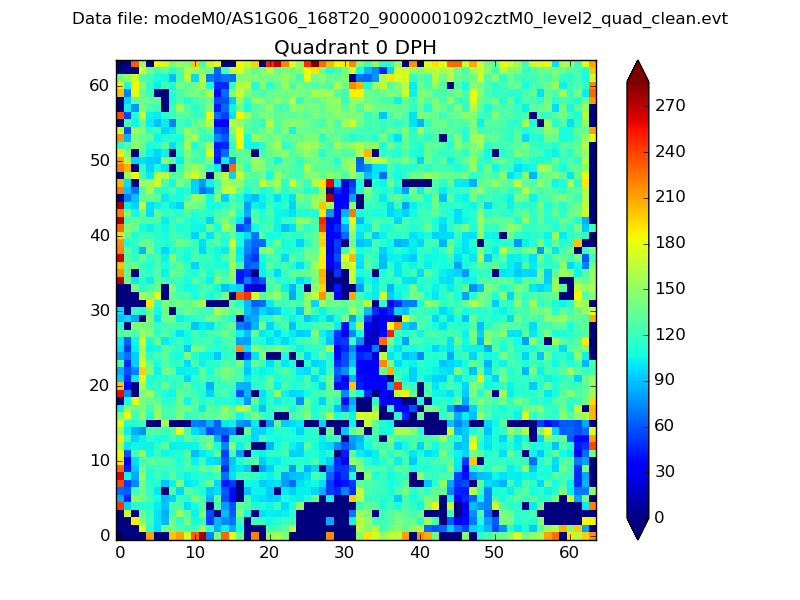 |
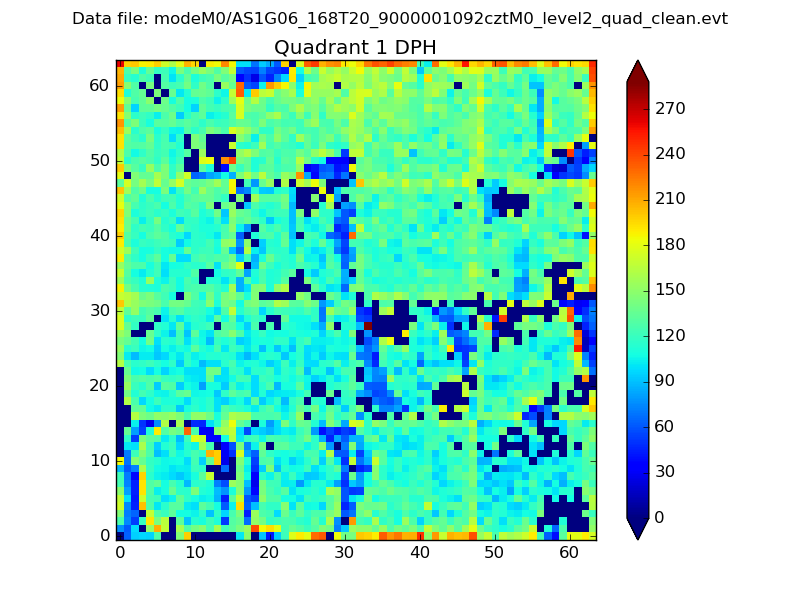 |
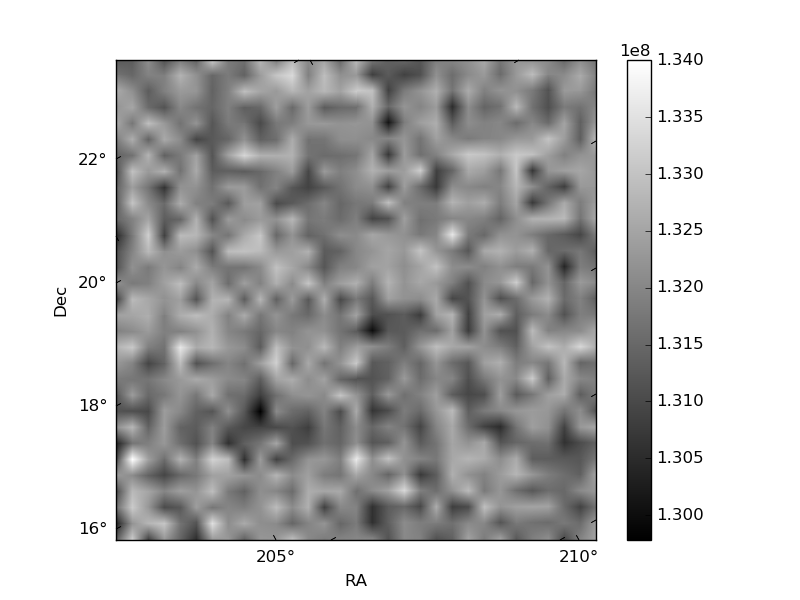
Quadrant B |
|---|---|---|---|
| Quadrant D | 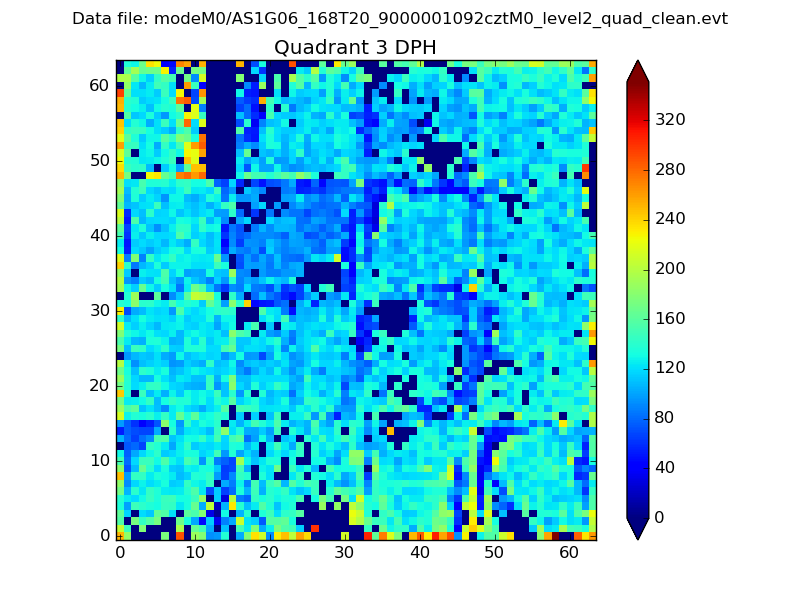 |
 |
Quadrant C |
| Plot type | Count rate plots | Images |
|---|---|---|
| Comparison with Poisson distribution Blue bars denote a histogram of data divided into 1 sec bins. Red curve is a Poisson curve with rate = median count rate of data. |
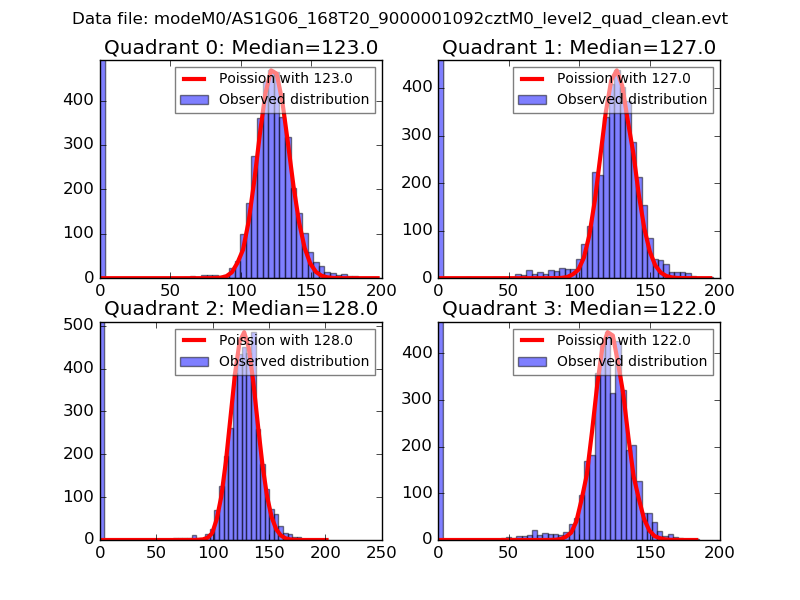 |
 |
| Quadrant-wise count rates Data is divided into 100 sec bins |
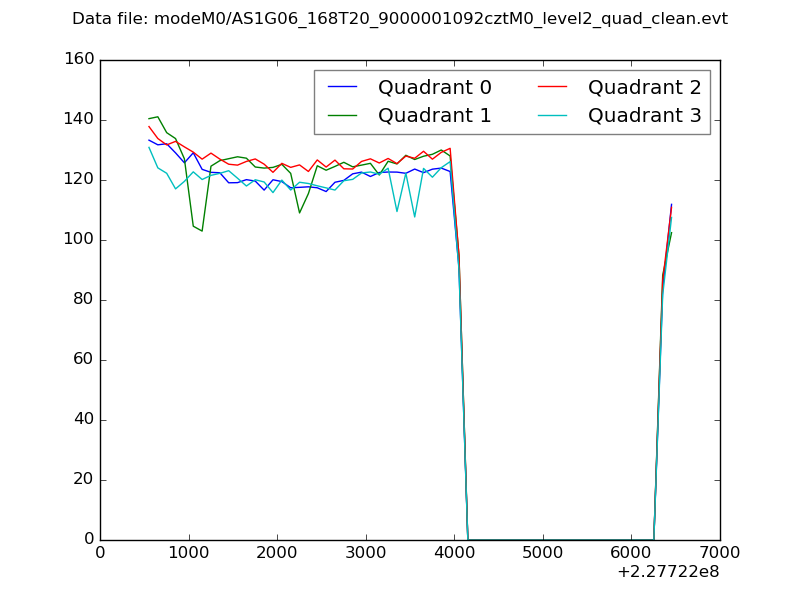 |
|
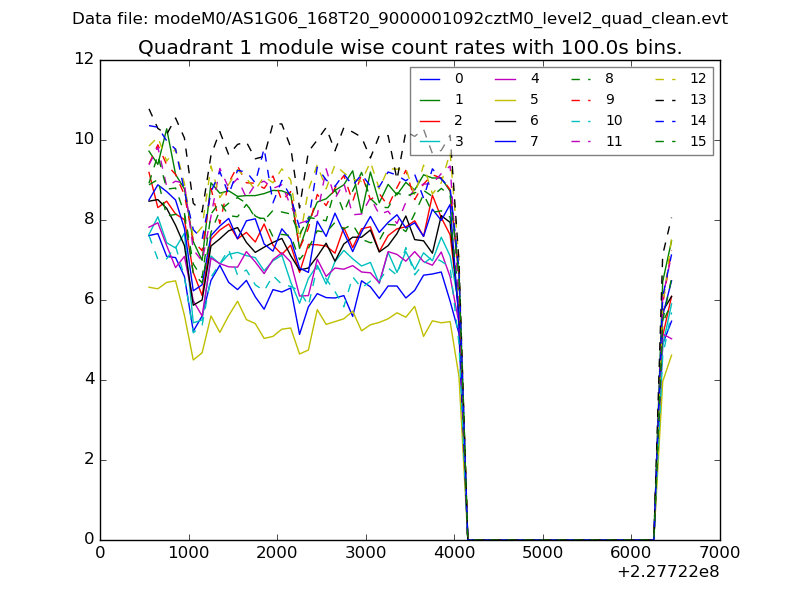
| Module-wise count rates for Quadrant A Data is divided into 100 sec bins |
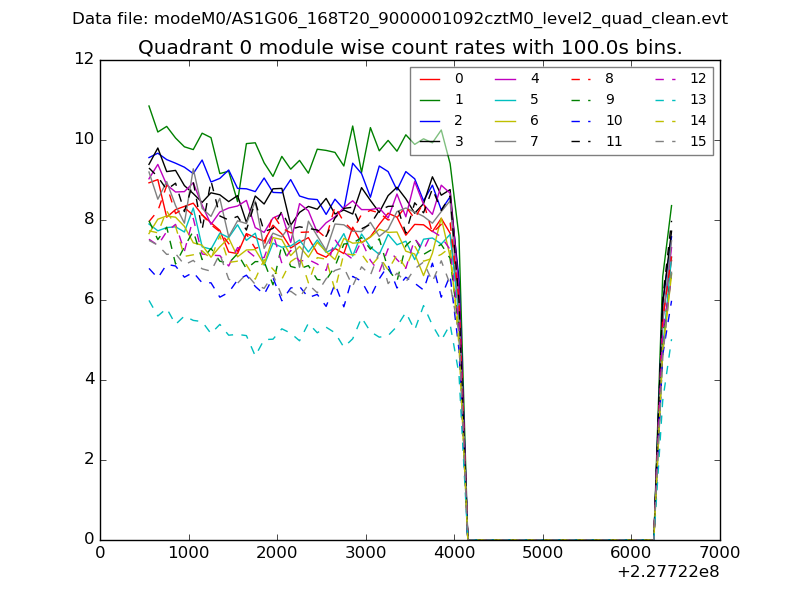 |
 |
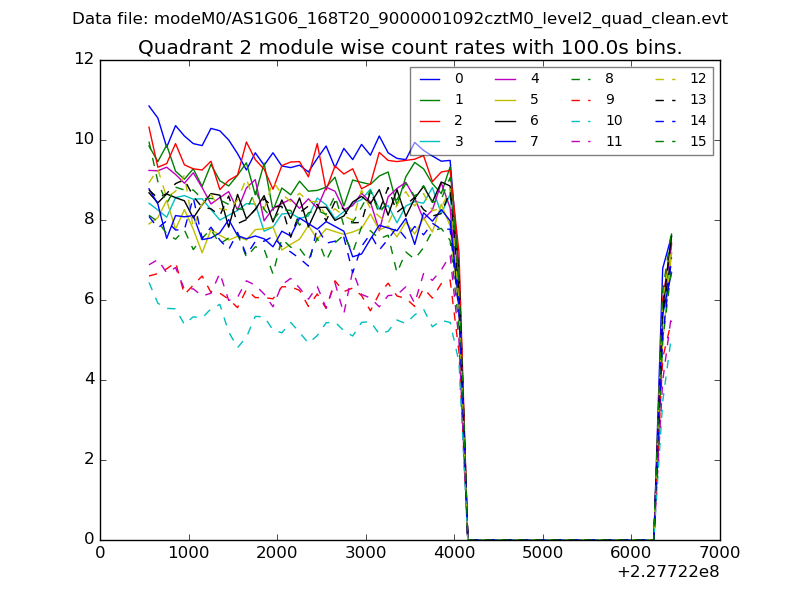
| Module-wise count rates for Quadrant B Data is divided into 100 sec bins |
 |
 |
| Module-wise count rates for Quadrant C Data is divided into 100 sec bins |
 |
 |
| Module-wise count rates for Quadrant D Data is divided into 100 sec bins |
 |
 |
| Parameter | Plot |
|---|---|
| CZT HV Monitor | 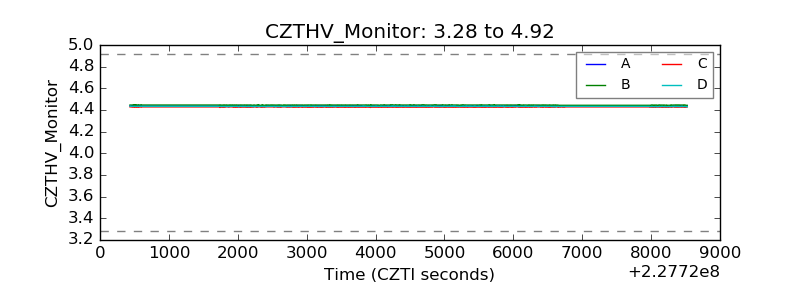 |
| D_VDD | 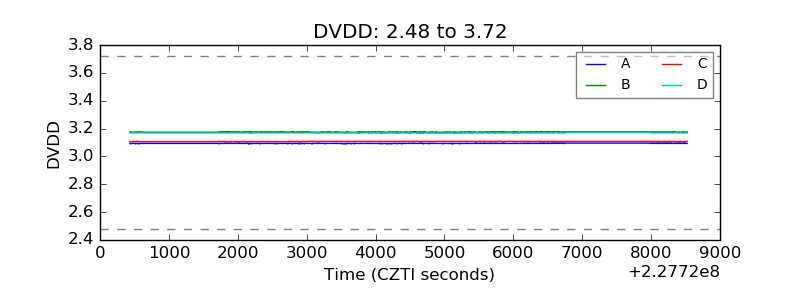 |
| Temperature 1 | 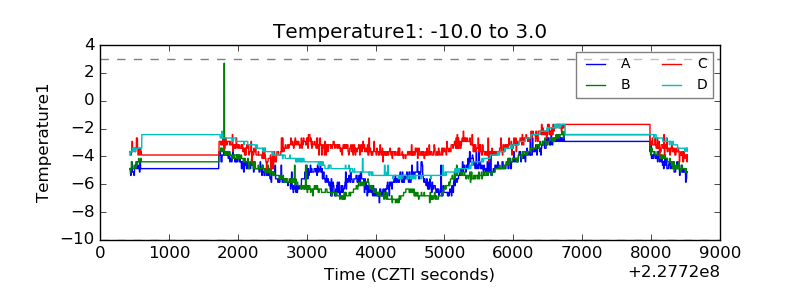 |
| Veto HV Monitor | 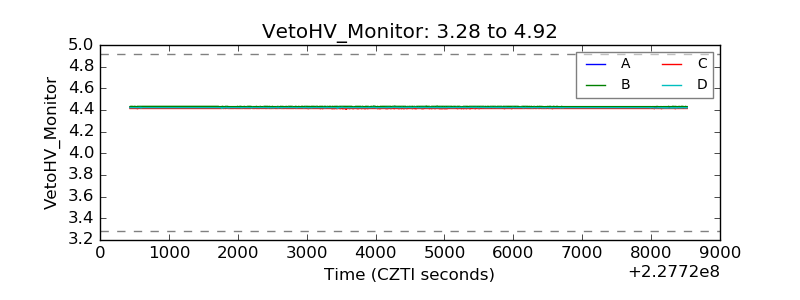 |
| Veto LLD | 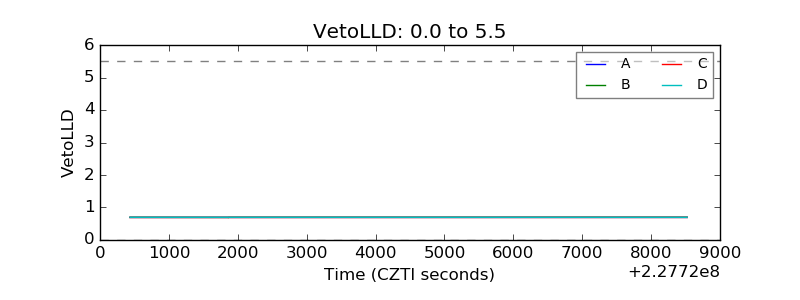 |
| Alpha Counter | 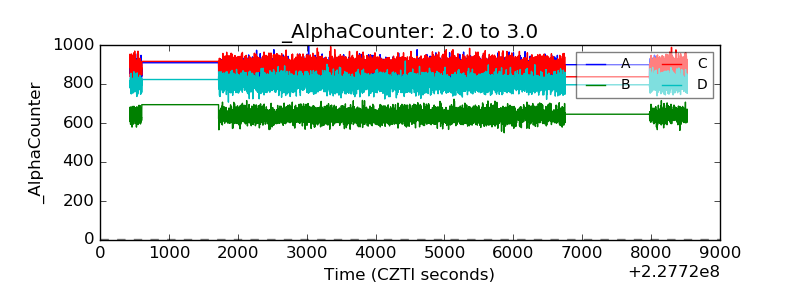 |
| _CPM_Rate | 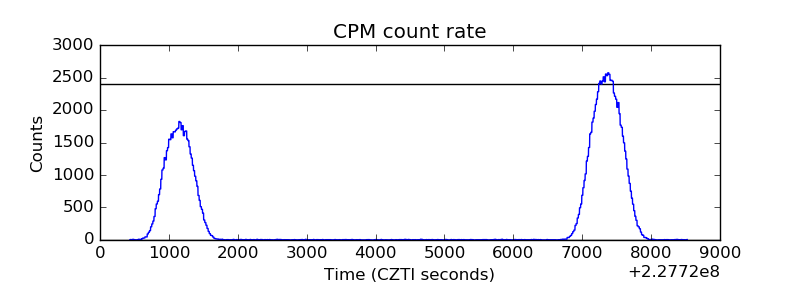 |
| CZT Counter |  |
| +2.5 Volts monitor |  |
| +5 Volts monitor |  |
| _ROLL_ROT | 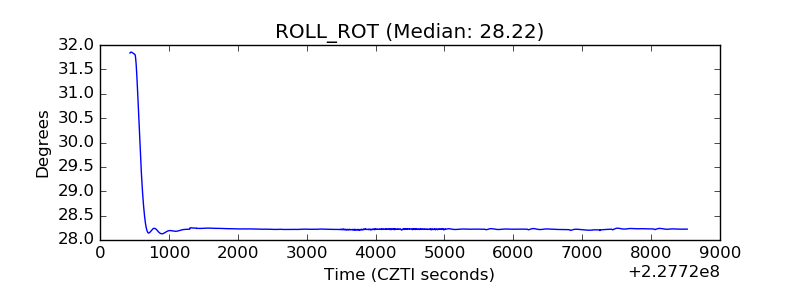 |
| _Roll_DEC | 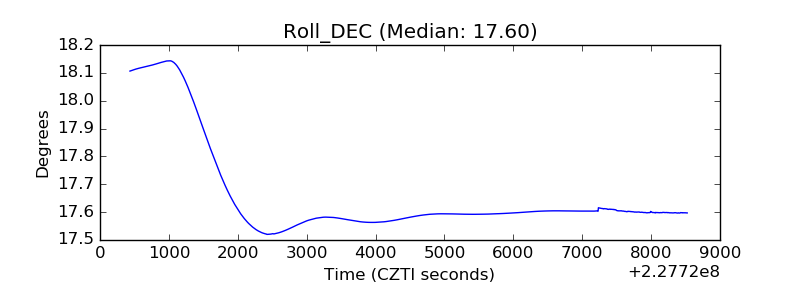 |
| _Roll_RA | 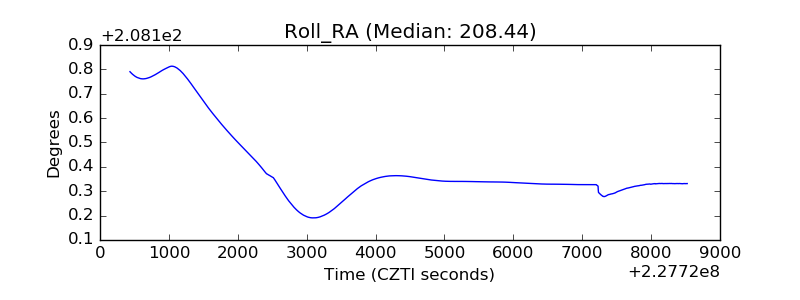 |
| Veto Counter |  |