| Param | Original file | Final file |
|---|---|---|
| Filename | modeM0/AS1G06_168T20_9000001092_07985cztM0_level2.evt | modeM0/AS1G06_168T20_9000001092_07985cztM0_level2_quad_clean.evt |
| Size (bytes) | 144,054,720 | 11,407,680 |
| Size | 137.4 MB | 10.9 MB |
| Events in quadrant A | 1,101,152 | 58,959 |
| Events in quadrant B | 891,871 | 61,712 |
| Events in quadrant C | 1,055,115 | 60,261 |
| Events in quadrant D | 1,213,239 | 55,382 |
| Mode M0 | |||
|---|---|---|---|
| Quadrant | BADHDUFLAG | Total packets | Discarded packets |
| A | 0 | 4341 | 2 |
| B | 0 | 3580 | 1 |
| C | 0 | 4230 | 1 |
| D | 0 | 4661 | 1 |
| Mode M9 | |||
|---|---|---|---|
| Quadrant | BADHDUFLAG | Total packets | Discarded packets |
| A | 0 | 11 | 0 |
| B | 0 | 11 | 0 |
| C | 0 | 11 | 0 |
| D | 0 | 11 | 0 |
| Mode SS | |||
|---|---|---|---|
| Quadrant | BADHDUFLAG | Total packets | Discarded packets |
| A | 0 | 32 | 0 |
| B | 0 | 32 | 0 |
| C | 0 | 32 | 0 |
| D | 0 | 32 | 0 |
| Quadrant | Total seconds | Saturated seconds | Saturation percentage |
|---|---|---|---|
| A | 1456 | 41 | 2.815934% |
| B | 1456 | 66 | 4.532967% |
| C | 1456 | 47 | 3.228022% |
| D | 1456 | 103 | 7.074176% |
Noise dominated data is calculated using 1-second bins in cleaned event files. If a bin has >2000 counts, and if more than 50% of those come from <1% of pixels, then it is considered to be noise-dominated and hence unusable.
| Quadrant | # 1 sec bins | Bins with >0 counts | Bins with >2000 counts | High rate bins dominated by noise | Noise dominated (total time) | Noise dominated (detector-on time) | Marked lightcurve |
|---|---|---|---|---|---|---|---|
| A | 2571 | 1457 | 0 | 0 | 0.00% | 0.00% | 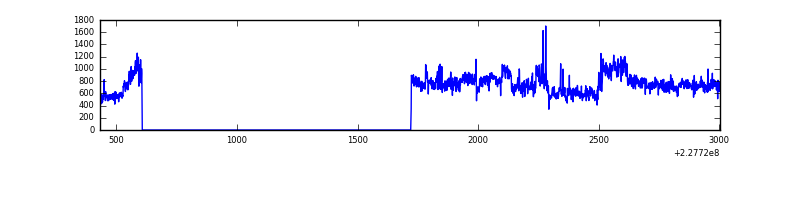 |
| B | 2571 | 1457 | 18 | 18 | 0.70% | 1.24% | 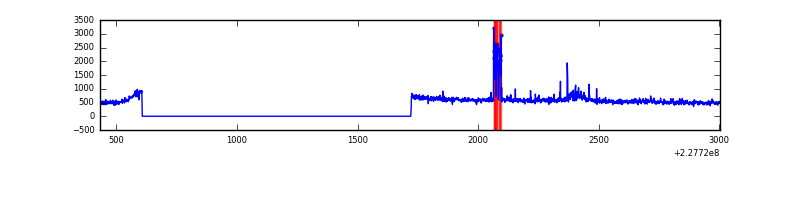 |
| C | 2571 | 1457 | 0 | 0 | 0.00% | 0.00% | 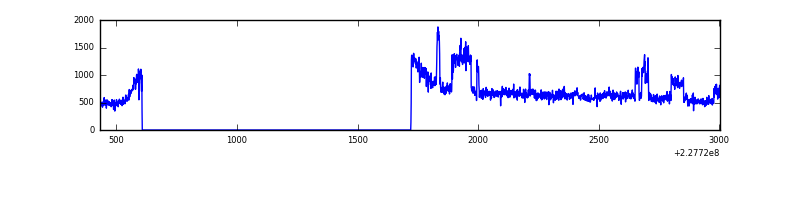 |
| D | 2571 | 1457 | 42 | 42 | 1.63% | 2.88% | 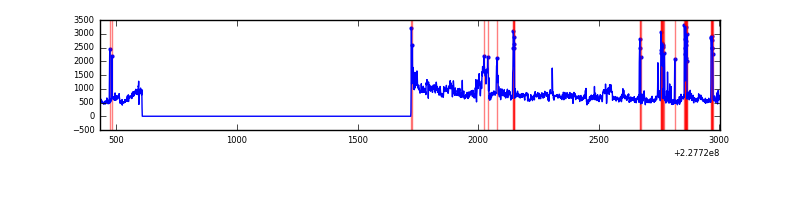 |
Top three noisy pixels from each quadrant. If the there are fewer than three noisy pixels in the level2.evt file, extra rows are filled as -1
| Pixel properties | Quadrant properties | ||||||
|---|---|---|---|---|---|---|---|
| Quadrant | DetID | PixID | Counts | Sigma | Mean | Median | Sigma |
| A | 0 | 128 | 305852 | 6976.44 | 204 | 199 | 43.8 |
| A | 15 | 239 | 6376 | 140.99 | 204 | 199 | 43.8 |
| A | 0 | 226 | 1889 | 38.57 | 204 | 199 | 43.8 |
| B | 5 | 250 | 50945 | 1214.5 | 206 | 201 | 41.8 |
| B | 11 | 51 | 23189 | 550.19 | 206 | 201 | 41.8 |
| B | 4 | 239 | 14756 | 348.36 | 206 | 201 | 41.8 |
| C | 1 | 16 | 258576 | 5313.12 | 204 | 204 | 48.6 |
| C | 13 | 61 | 1429 | 25.19 | 204 | 204 | 48.6 |
| C | 7 | 159 | 560 | 7.32 | 204 | 204 | 48.6 |
| D | 1 | 52 | 427408 | 8452.61 | 201 | 195 | 50.5 |
| D | 13 | 169 | 22221 | 435.79 | 201 | 195 | 50.5 |
| D | 2 | 136 | 5058 | 96.21 | 201 | 195 | 50.5 |
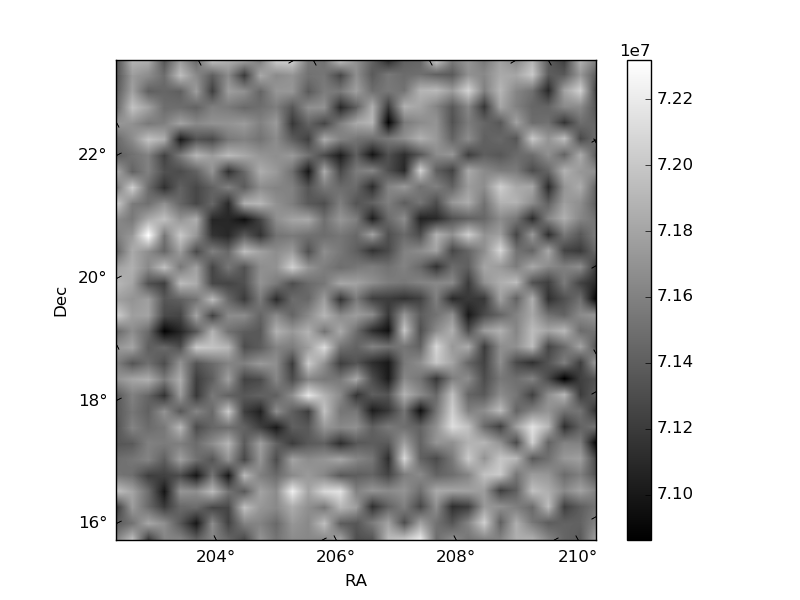
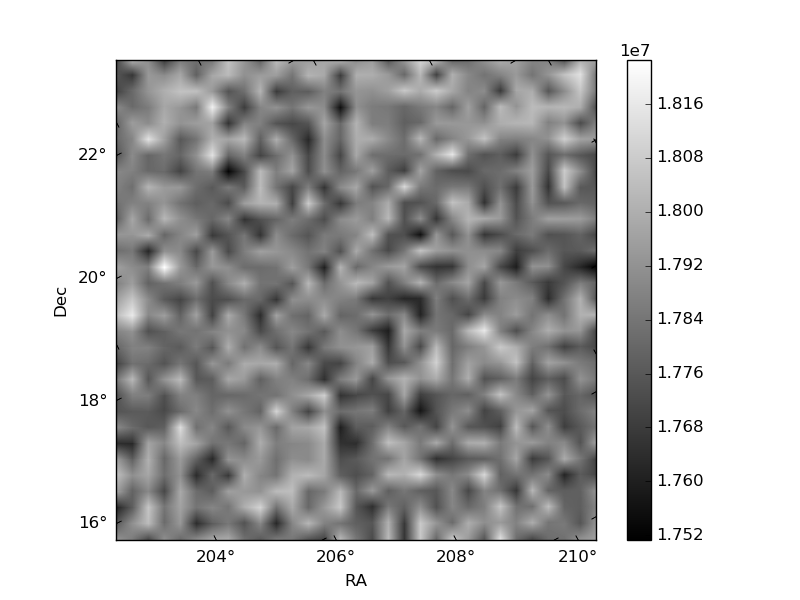
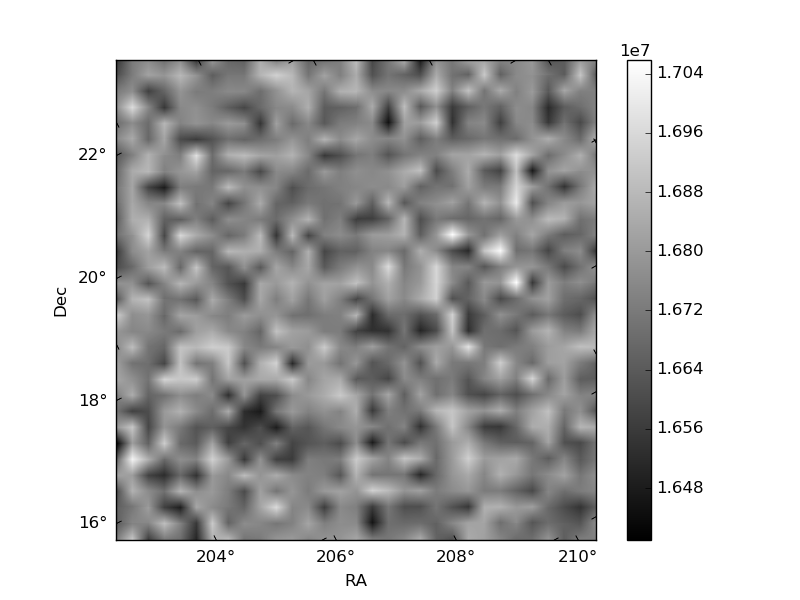
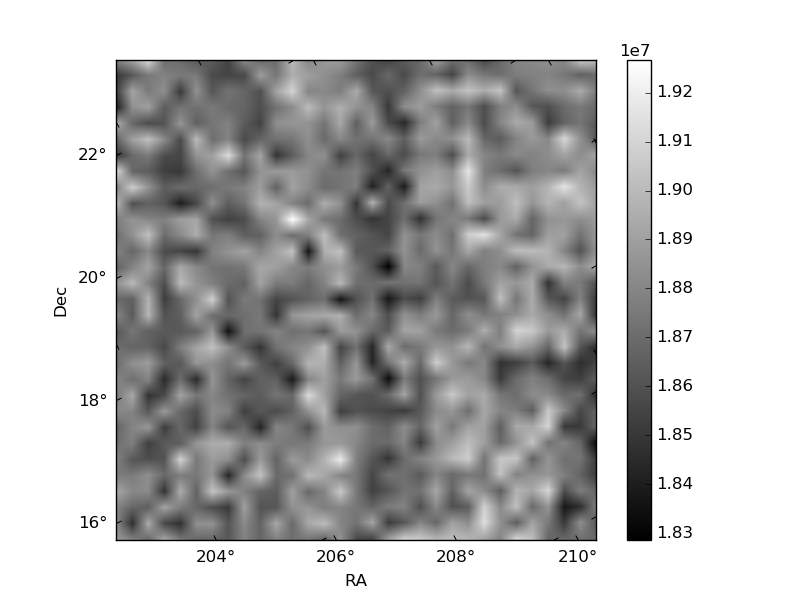
Histogram calculated using DETX and DETY for each event in the final _common_clean file
| Quadrant A | 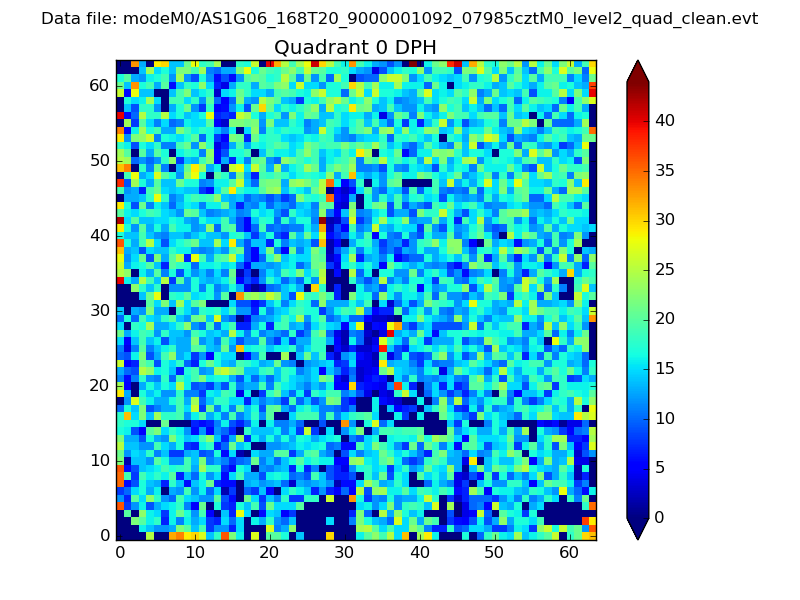 |
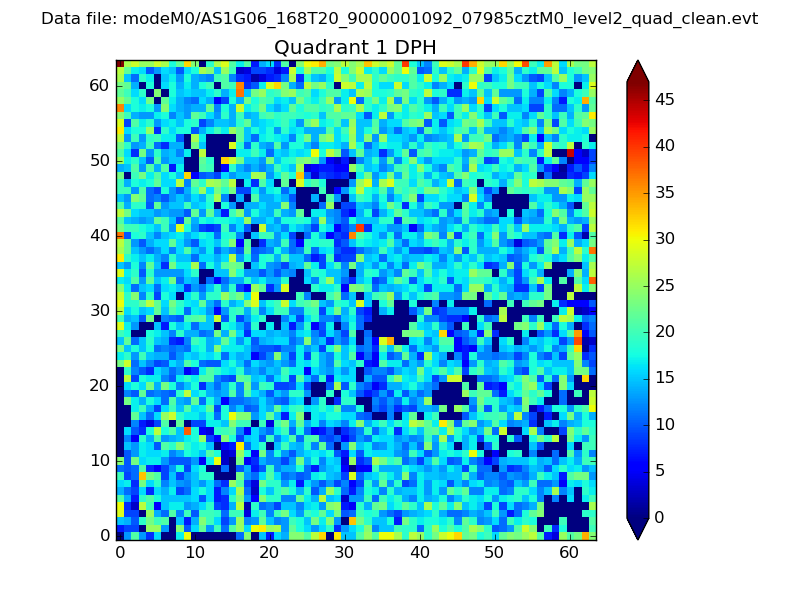 |
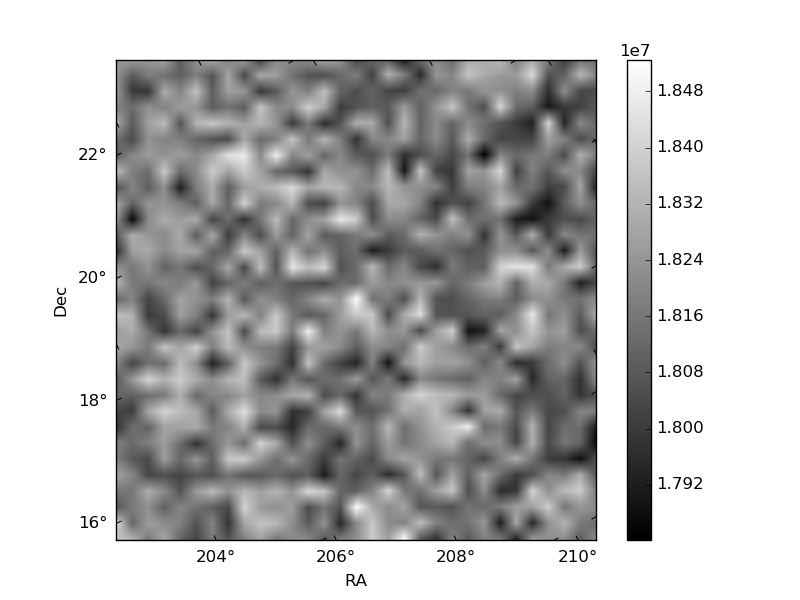
Quadrant B |
|---|---|---|---|
| Quadrant D | 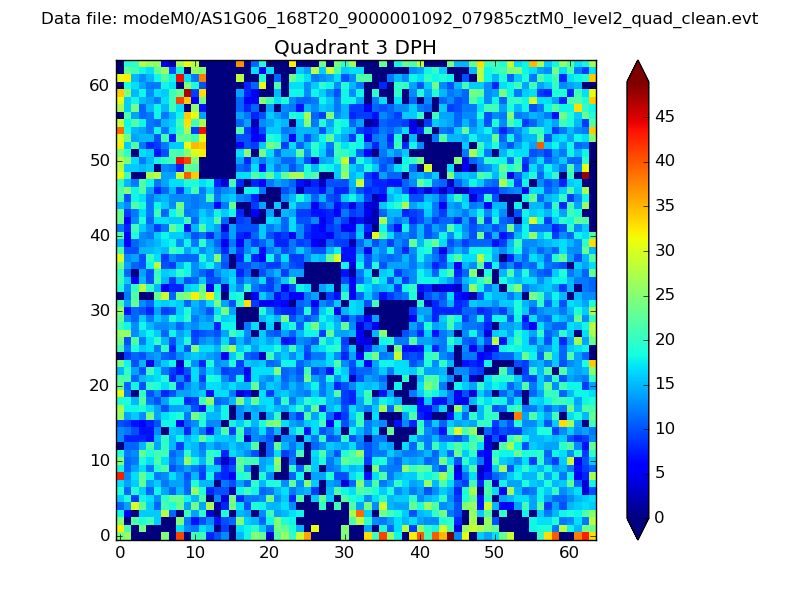 |
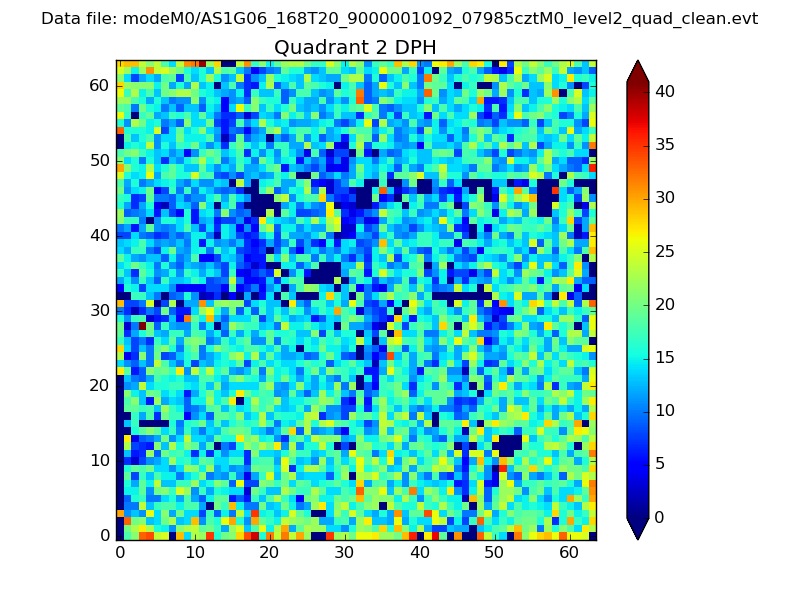 |
Quadrant C |
| Plot type | Count rate plots | Images |
|---|---|---|
| Comparison with Poisson distribution Blue bars denote a histogram of data divided into 1 sec bins. Red curve is a Poisson curve with rate = median count rate of data. |
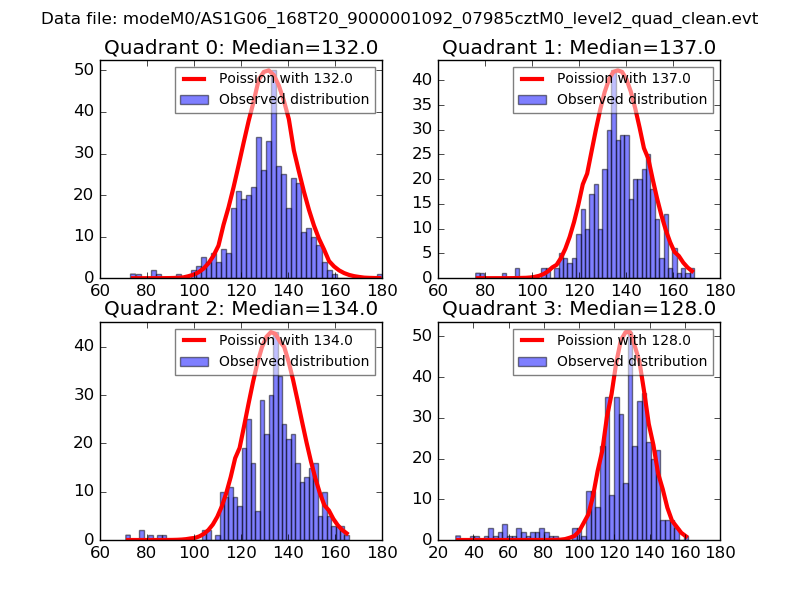 |
 |
| Quadrant-wise count rates Data is divided into 100 sec bins |
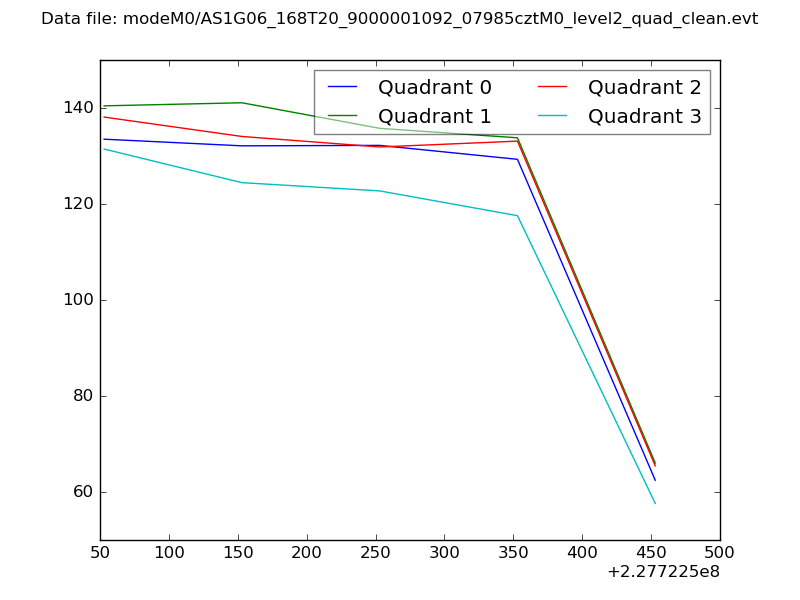 |
|
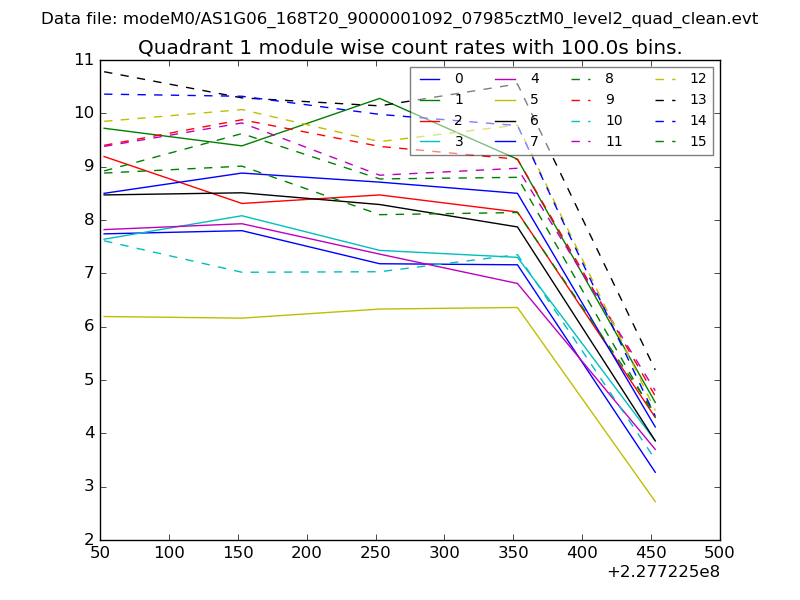
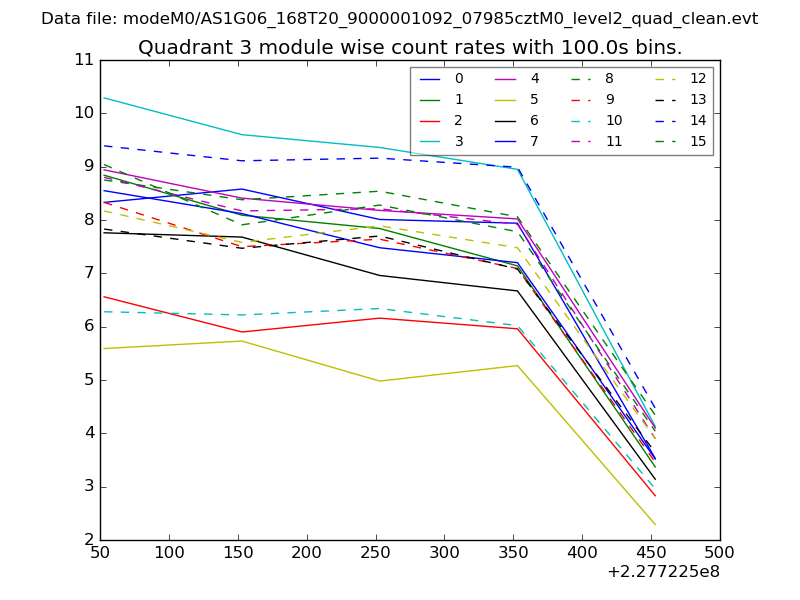
| Module-wise count rates for Quadrant A Data is divided into 100 sec bins |
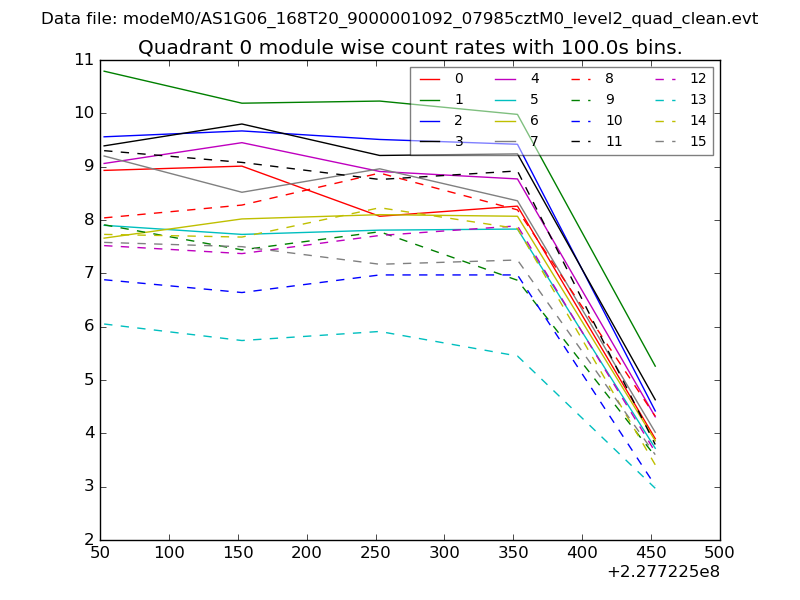 |
 |
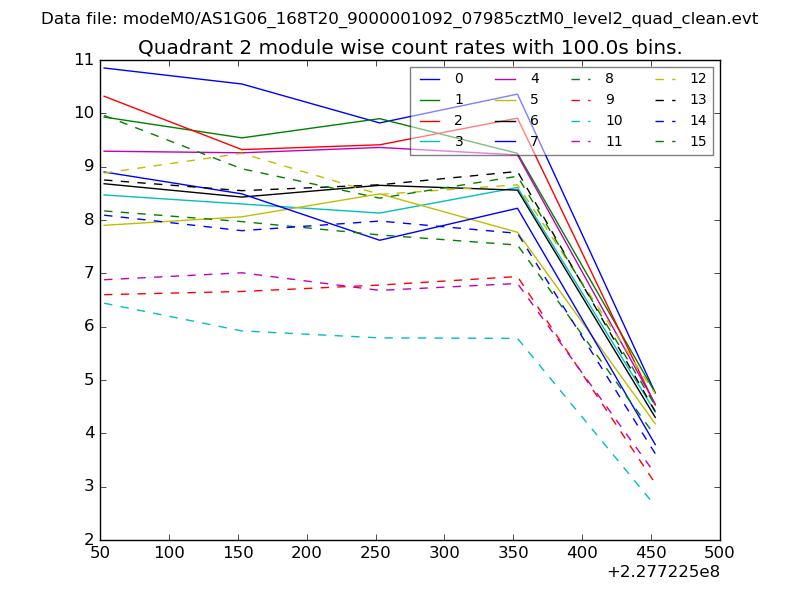
| Module-wise count rates for Quadrant B Data is divided into 100 sec bins |
 |
 |
| Module-wise count rates for Quadrant C Data is divided into 100 sec bins |
 |
 |
| Module-wise count rates for Quadrant D Data is divided into 100 sec bins |
 |
 |
| Parameter | Plot |
|---|---|
| CZT HV Monitor | 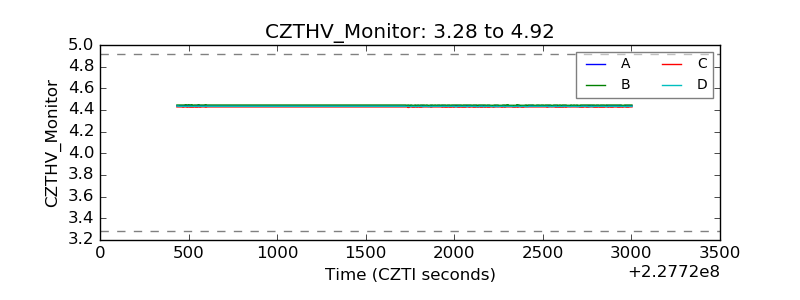 |
| D_VDD | 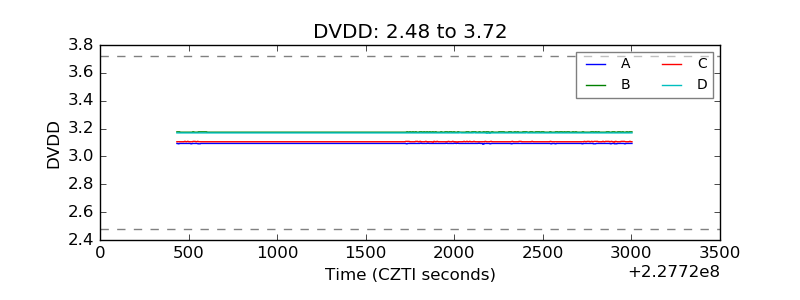 |
| Temperature 1 | 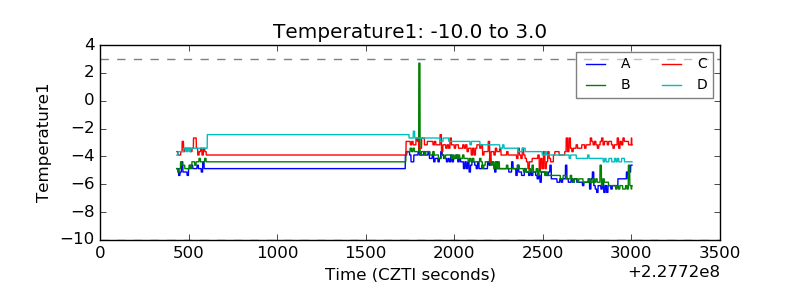 |
| Veto HV Monitor | 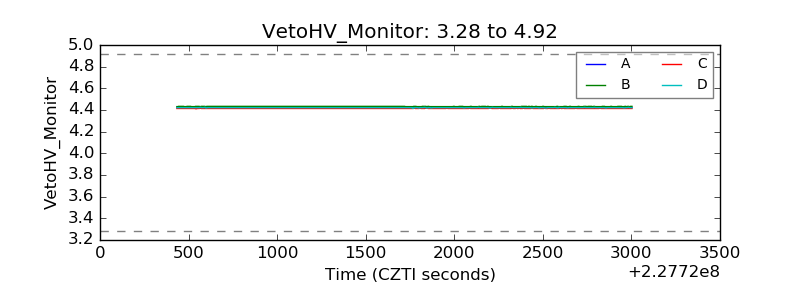 |
| Veto LLD | 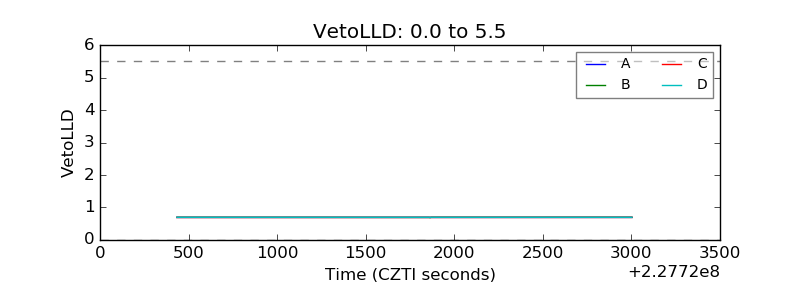 |
| Alpha Counter | 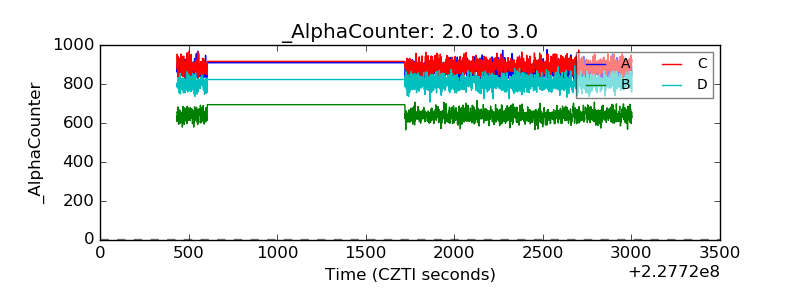 |
| _CPM_Rate | 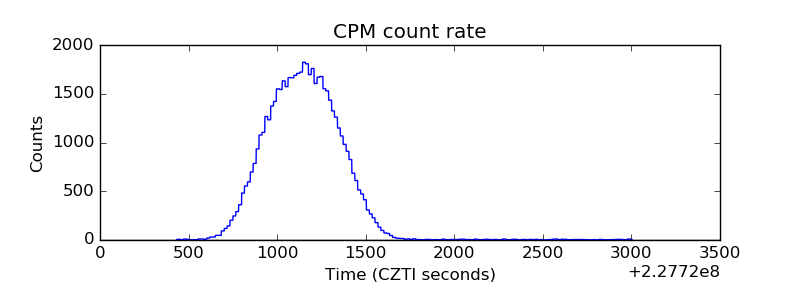 |
| CZT Counter | 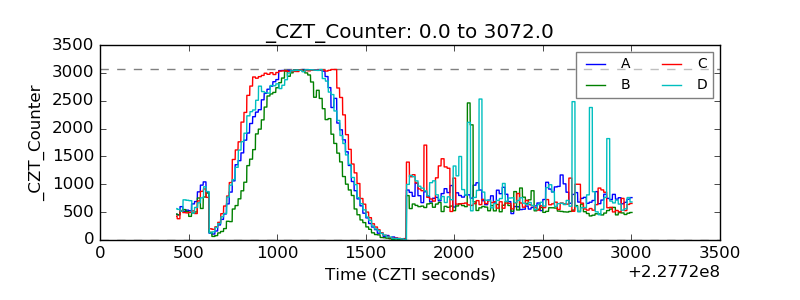 |
| +2.5 Volts monitor |  |
| +5 Volts monitor |  |
| _ROLL_ROT | 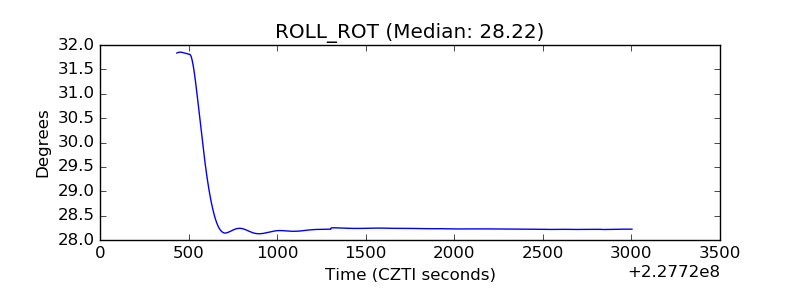 |
| _Roll_DEC | 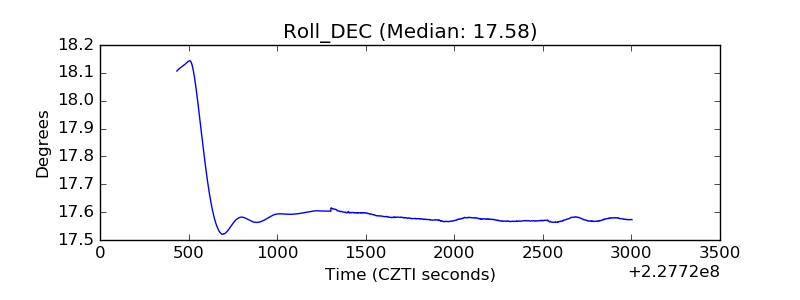 |
| _Roll_RA | 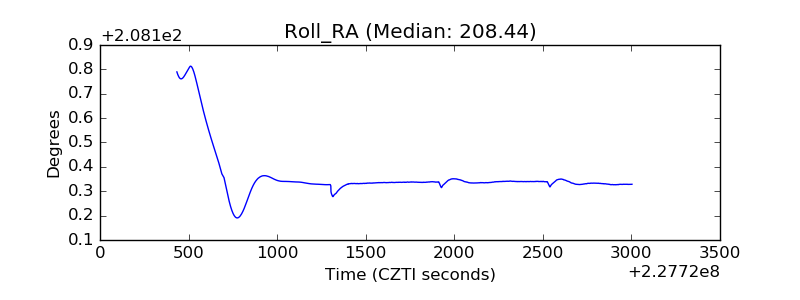 |
| Veto Counter | 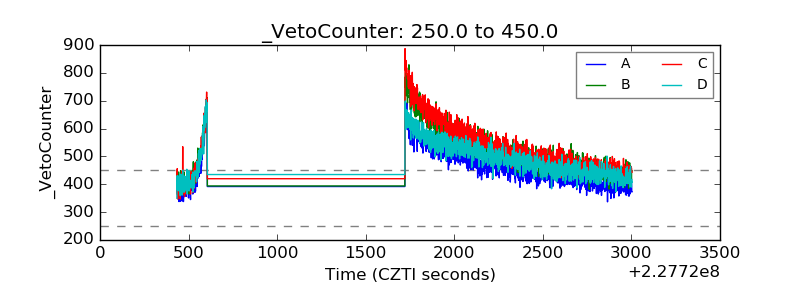 |