| Param | Original file | Final file |
|---|---|---|
| Filename | modeM0/AS1G06_168T20_9000001092_07987cztM0_level2.evt | modeM0/AS1G06_168T20_9000001092_07987cztM0_level2_quad_clean.evt |
| Size (bytes) | 484,320,960 | 73,644,480 |
| Size | 461.9 MB | 70.2 MB |
| Events in quadrant A | 3,551,977 | 456,605 |
| Events in quadrant B | 3,629,839 | 466,340 |
| Events in quadrant C | 3,338,007 | 474,421 |
| Events in quadrant D | 3,776,455 | 449,074 |
| Mode M0 | |||
|---|---|---|---|
| Quadrant | BADHDUFLAG | Total packets | Discarded packets |
| A | 0 | 14356 | 1 |
| B | 0 | 14562 | 1 |
| C | 0 | 13582 | 1 |
| D | 0 | 15018 | 1 |
| Mode M9 | |||
|---|---|---|---|
| Quadrant | BADHDUFLAG | Total packets | Discarded packets |
| A | 0 | 12 | 0 |
| B | 0 | 12 | 0 |
| C | 0 | 12 | 0 |
| D | 0 | 12 | 0 |
| Mode SS | |||
|---|---|---|---|
| Quadrant | BADHDUFLAG | Total packets | Discarded packets |
| A | 0 | 112 | 0 |
| B | 0 | 112 | 0 |
| C | 0 | 112 | 0 |
| D | 0 | 112 | 0 |
| Quadrant | Total seconds | Saturated seconds | Saturation percentage |
|---|---|---|---|
| A | 5477 | 37 | 0.675552% |
| B | 5477 | 329 | 6.006938% |
| C | 5477 | 65 | 1.186781% |
| D | 5477 | 195 | 3.560343% |
Noise dominated data is calculated using 1-second bins in cleaned event files. If a bin has >2000 counts, and if more than 50% of those come from <1% of pixels, then it is considered to be noise-dominated and hence unusable.
| Quadrant | # 1 sec bins | Bins with >0 counts | Bins with >2000 counts | High rate bins dominated by noise | Noise dominated (total time) | Noise dominated (detector-on time) | Marked lightcurve |
|---|---|---|---|---|---|---|---|
| A | 6703 | 5478 | 1 | 1 | 0.01% | 0.02% | 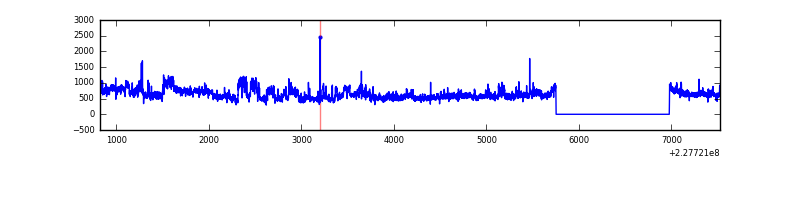 |
| B | 6703 | 5478 | 202 | 202 | 3.01% | 3.69% | 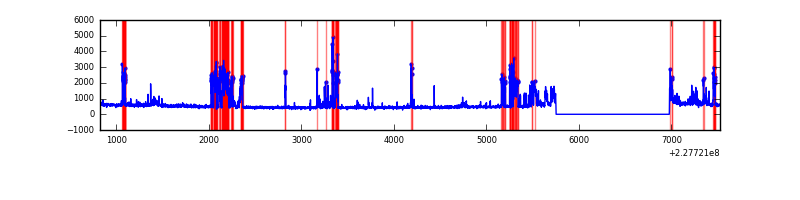 |
| C | 6703 | 5478 | 4 | 4 | 0.06% | 0.07% | 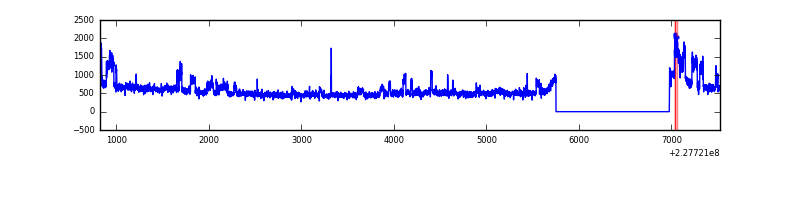 |
| D | 6703 | 5478 | 147 | 147 | 2.19% | 2.68% | 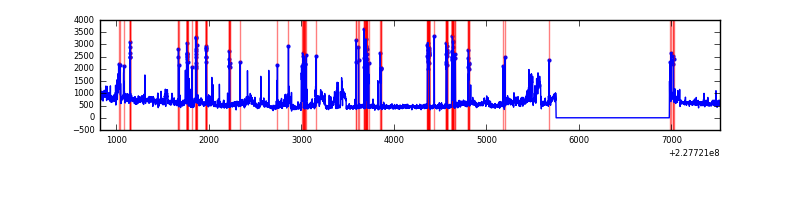 |
Top three noisy pixels from each quadrant. If the there are fewer than three noisy pixels in the level2.evt file, extra rows are filled as -1
| Pixel properties | Quadrant properties | ||||||
|---|---|---|---|---|---|---|---|
| Quadrant | DetID | PixID | Counts | Sigma | Mean | Median | Sigma |
| A | 0 | 128 | 933101 | 6768.7 | 675 | 660 | 137.8 |
| A | 4 | 2 | 7768 | 51.6 | 675 | 660 | 137.8 |
| A | 0 | 226 | 6346 | 41.28 | 675 | 660 | 137.8 |
| B | 5 | 250 | 825655 | 6358.53 | 676 | 661 | 129.7 |
| B | 4 | 239 | 83011 | 634.7 | 676 | 661 | 129.7 |
| B | 0 | 231 | 47440 | 360.54 | 676 | 661 | 129.7 |
| C | 1 | 16 | 697497 | 4475.95 | 673 | 676 | 155.7 |
| C | 10 | 22 | 10771 | 64.84 | 673 | 676 | 155.7 |
| C | 13 | 61 | 5089 | 28.35 | 673 | 676 | 155.7 |
| D | 1 | 52 | 1238289 | 7665.96 | 662 | 644 | 161.4 |
| D | 13 | 169 | 31010 | 188.09 | 662 | 644 | 161.4 |
| D | 2 | 234 | 16322 | 97.11 | 662 | 644 | 161.4 |
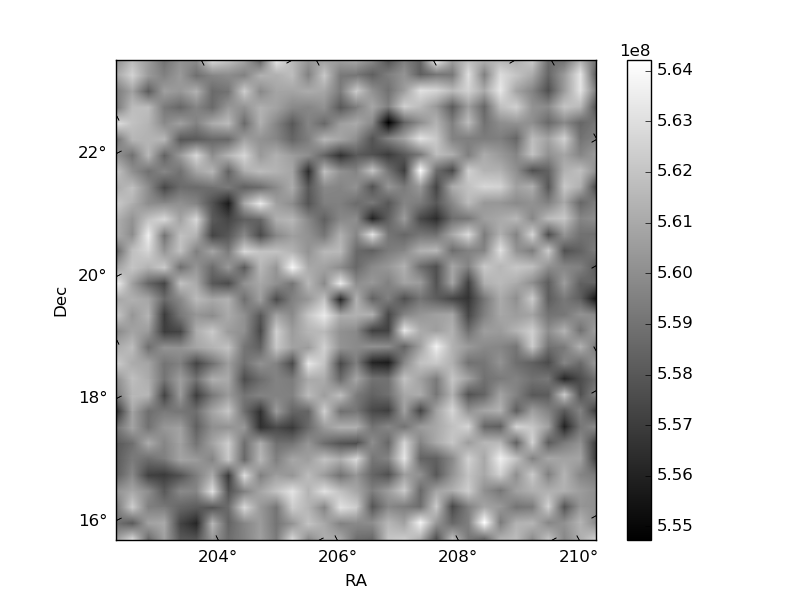
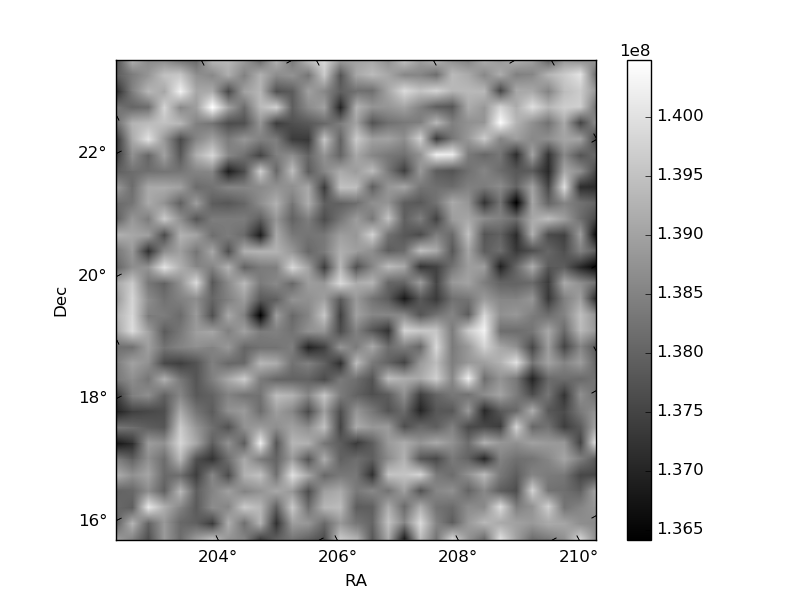
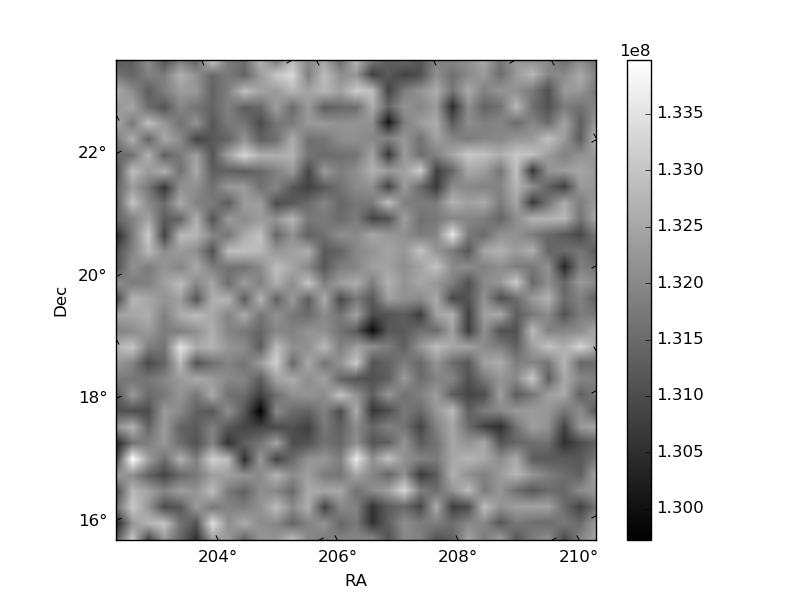
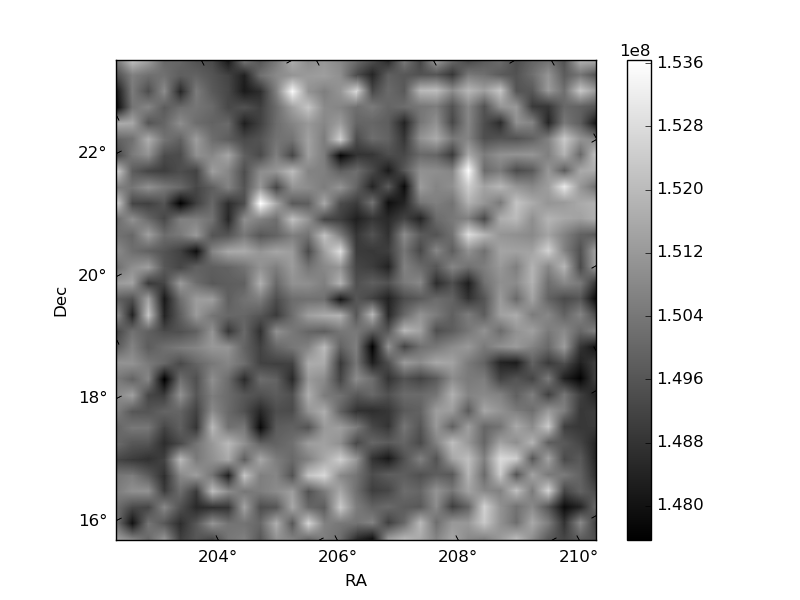
Histogram calculated using DETX and DETY for each event in the final _common_clean file
| Quadrant A | 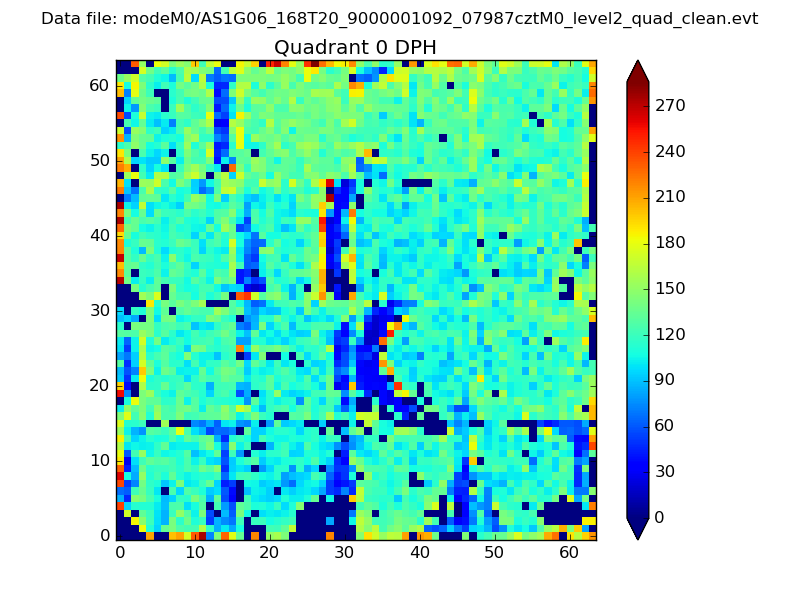 |
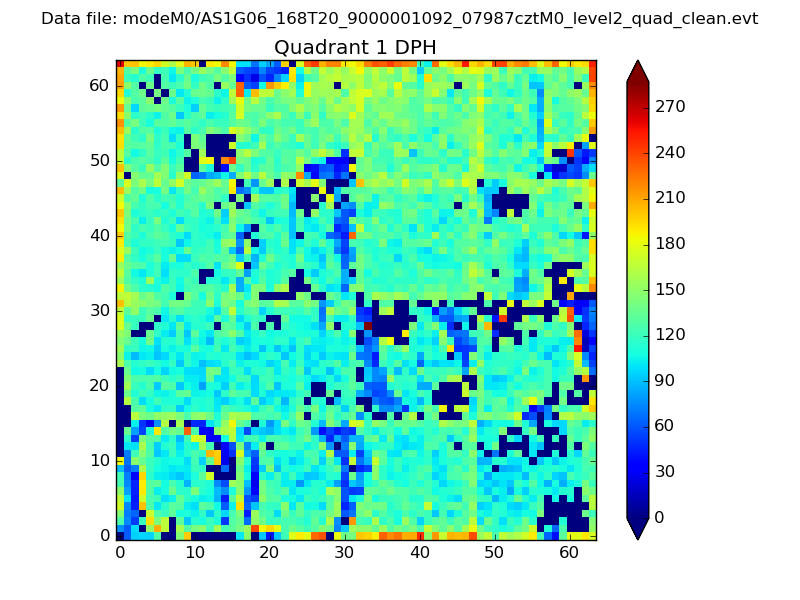 |
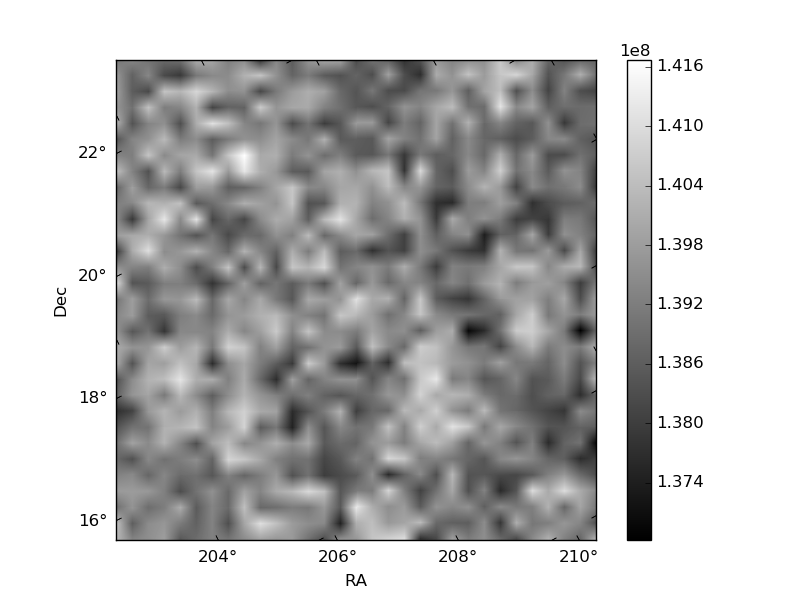
Quadrant B |
|---|---|---|---|
| Quadrant D | 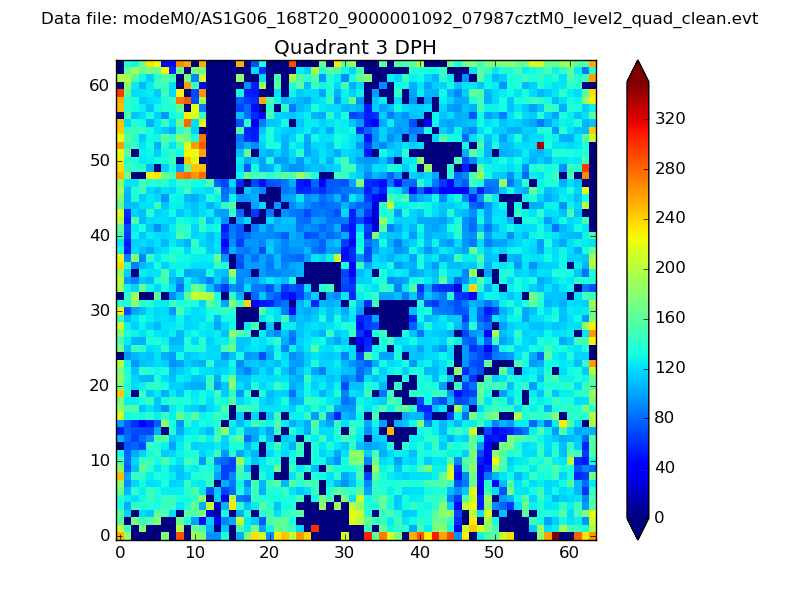 |
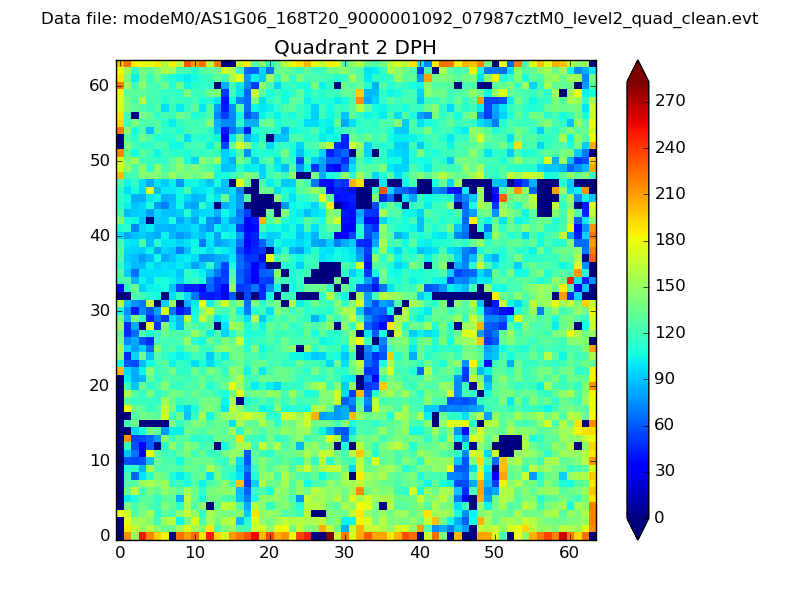 |
Quadrant C |
| Plot type | Count rate plots | Images |
|---|---|---|
| Comparison with Poisson distribution Blue bars denote a histogram of data divided into 1 sec bins. Red curve is a Poisson curve with rate = median count rate of data. |
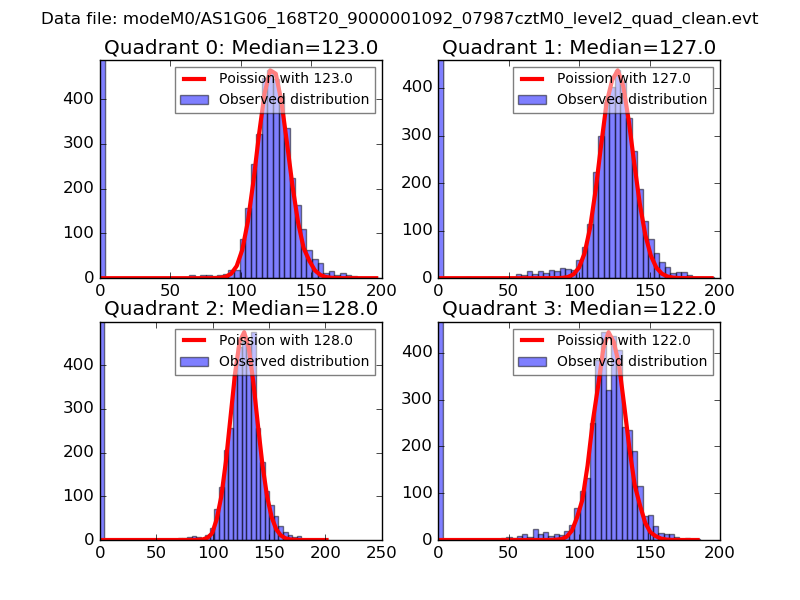 |
 |
| Quadrant-wise count rates Data is divided into 100 sec bins |
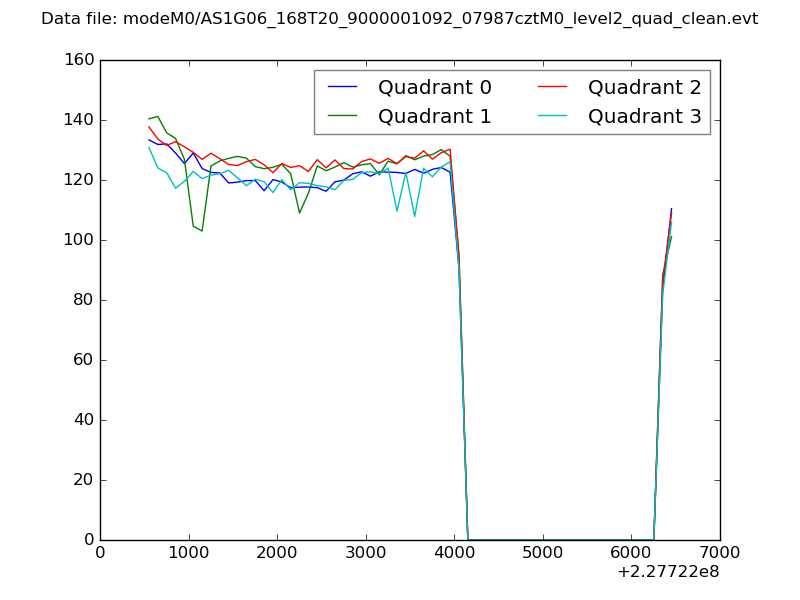 |
|
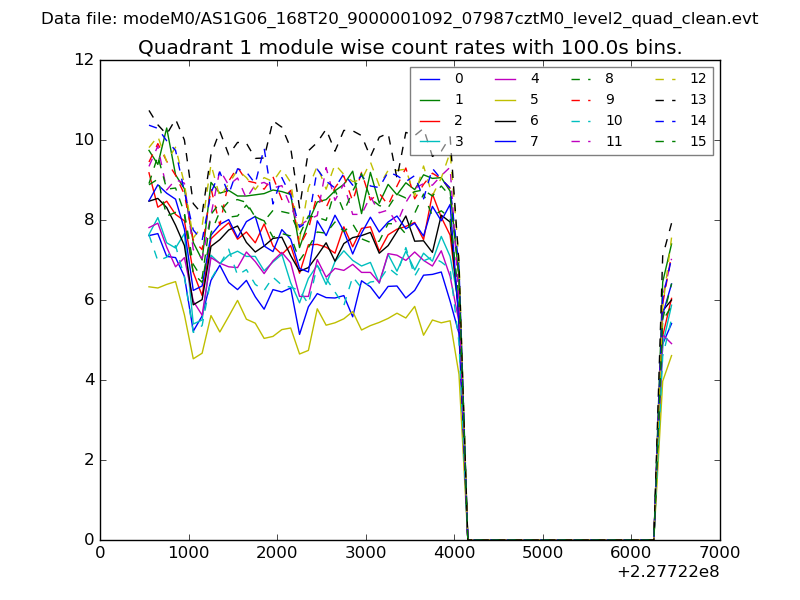
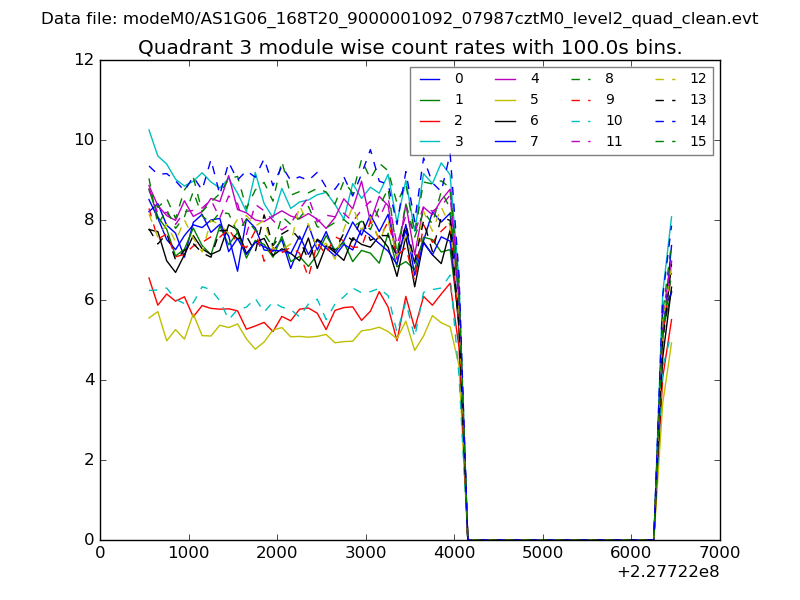
| Module-wise count rates for Quadrant A Data is divided into 100 sec bins |
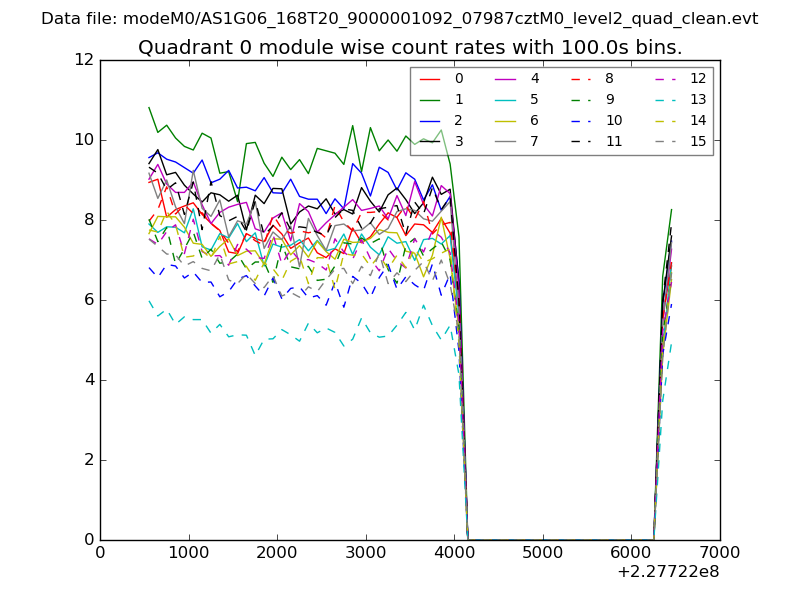 |
 |
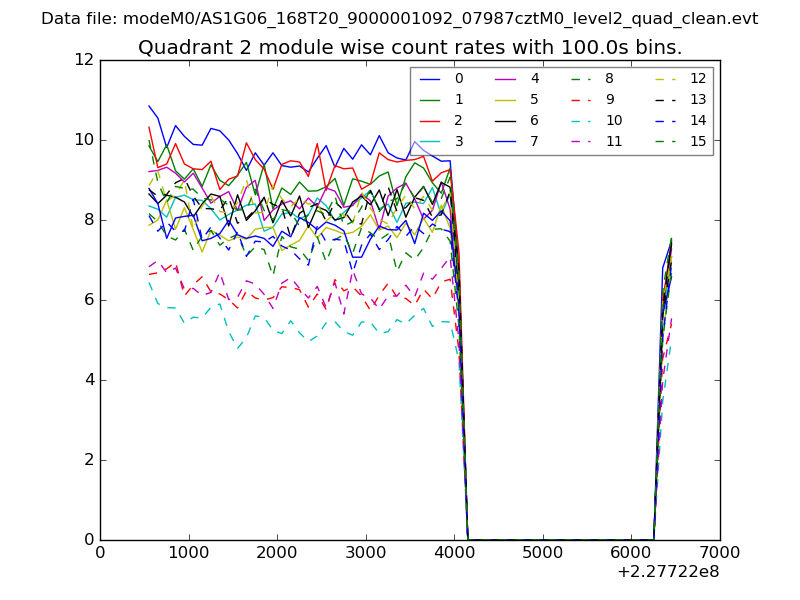
| Module-wise count rates for Quadrant B Data is divided into 100 sec bins |
 |
 |
| Module-wise count rates for Quadrant C Data is divided into 100 sec bins |
 |
 |
| Module-wise count rates for Quadrant D Data is divided into 100 sec bins |
 |
 |
| Parameter | Plot |
|---|---|
| CZT HV Monitor | 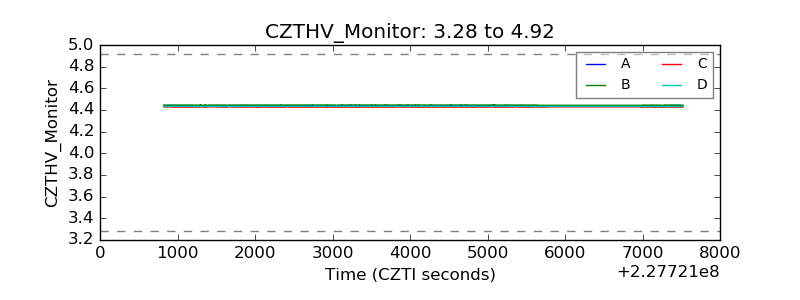 |
| D_VDD | 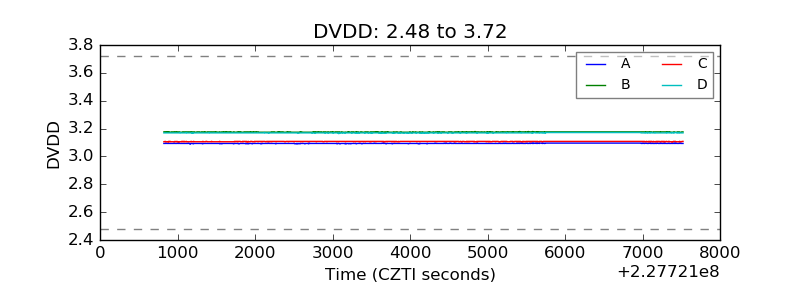 |
| Temperature 1 | 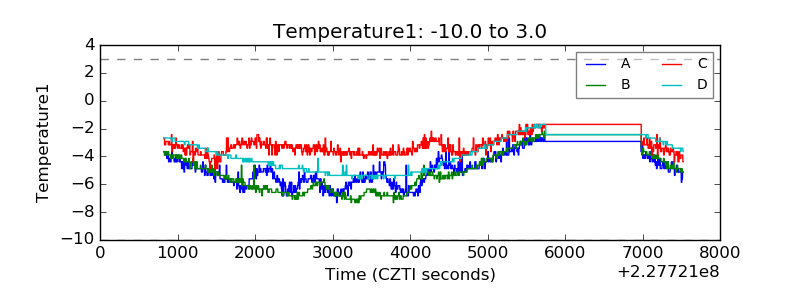 |
| Veto HV Monitor | 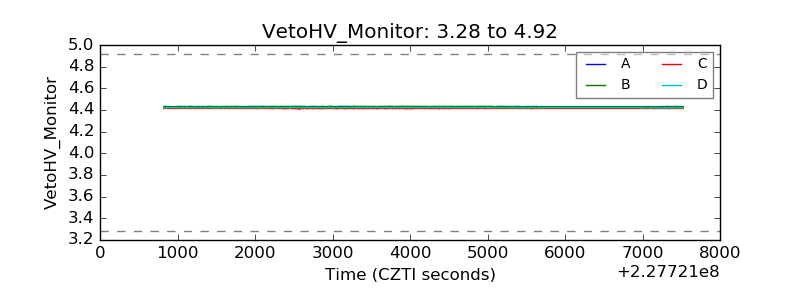 |
| Veto LLD | 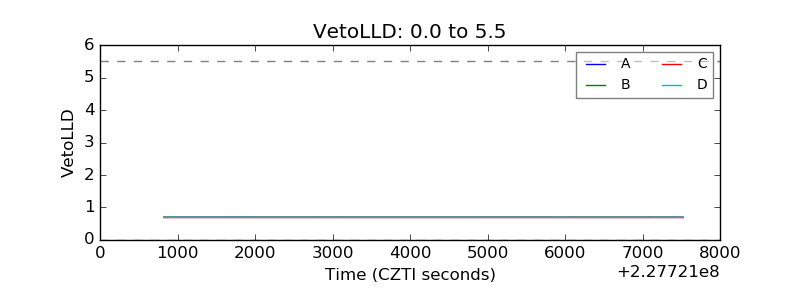 |
| Alpha Counter | 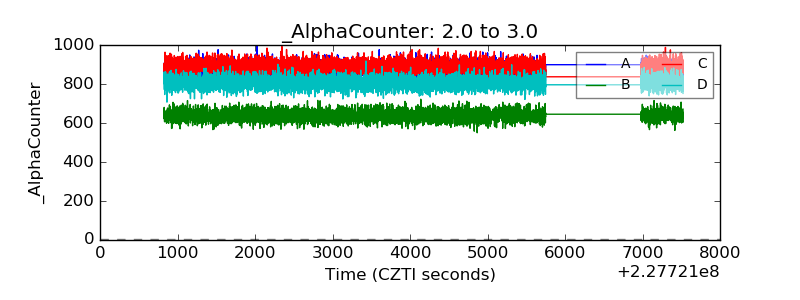 |
| _CPM_Rate | 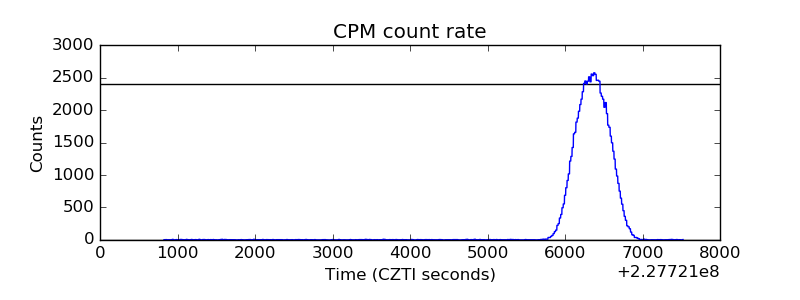 |
| CZT Counter | 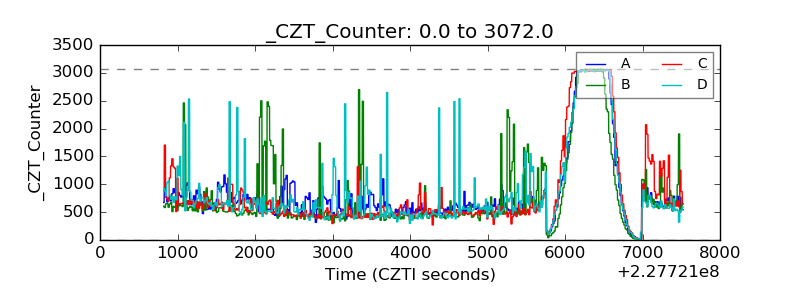 |
| +2.5 Volts monitor | 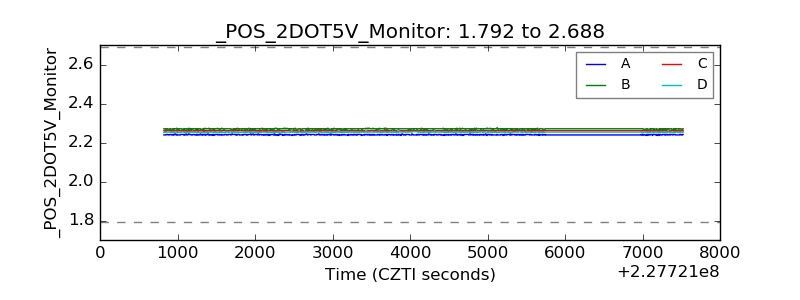 |
| +5 Volts monitor | 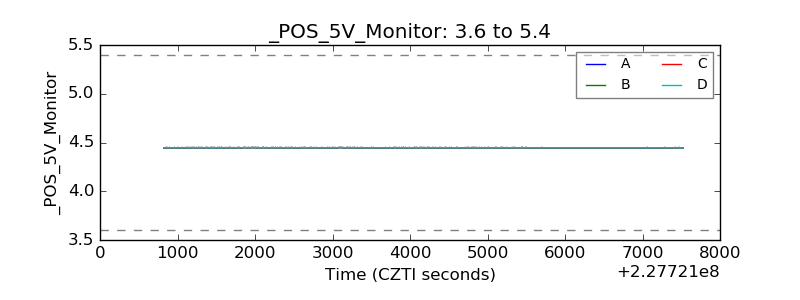 |
| _ROLL_ROT | 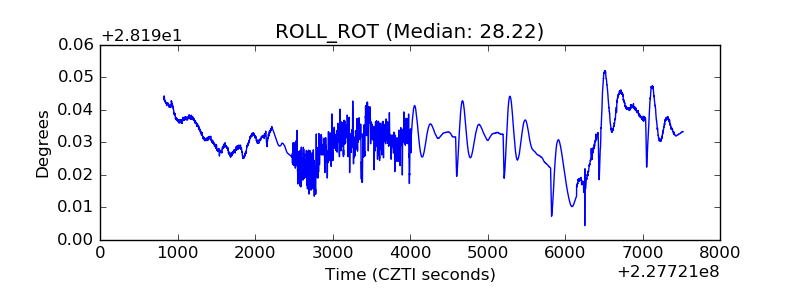 |
| _Roll_DEC | 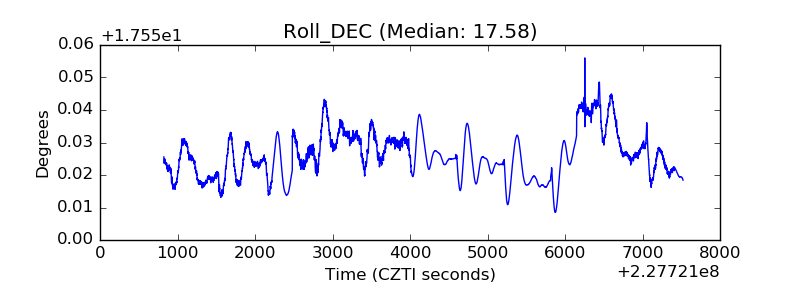 |
| _Roll_RA | 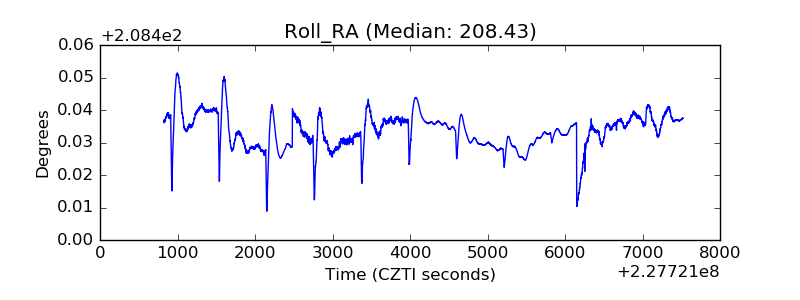 |
| Veto Counter | 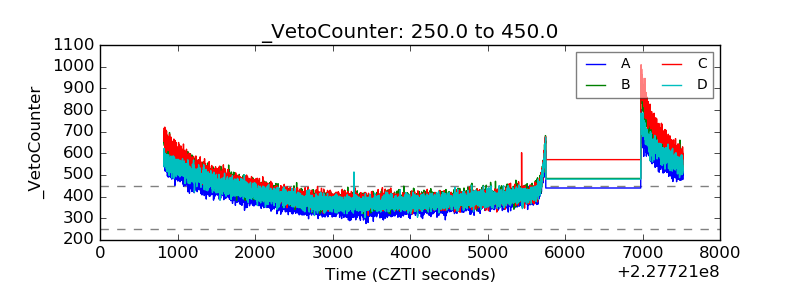 |