| Param | Original file | Final file |
|---|---|---|
| Filename | modeM0/AS1A02_165T03_9000001098cztM0_level2.fits | modeM0/AS1A02_165T03_9000001098cztM0_level2_quad_clean.evt |
| Size (bytes) | 84,487,680 | 46,264,320 |
| Size | 80.6 MB | 44.1 MB |
| Events in quadrant A | 510,912 | 205,708 |
| Events in quadrant B | 501,252 | 210,166 |
| Events in quadrant C | 518,226 | 209,824 |
| Events in quadrant D | 444,502 | 189,986 |
| Mode SS | |||
|---|---|---|---|
| Quadrant | BADHDUFLAG | Total packets | Discarded packets |
| A | 0 | 172 | 0 |
| B | 0 | 172 | 0 |
| C | 0 | 172 | 0 |
| D | 0 | 172 | 0 |
| Mode M0 | |||
|---|---|---|---|
| Quadrant | BADHDUFLAG | Total packets | Discarded packets |
| A | 0 | 17458 | 0 |
| B | 0 | 17927 | 0 |
| C | 0 | 17529 | 0 |
| D | 0 | 20785 | 0 |
| Mode M9 | |||
|---|---|---|---|
| Quadrant | BADHDUFLAG | Total packets | Discarded packets |
| A | 0 | 27 | 0 |
| B | 0 | 27 | 0 |
| C | 0 | 27 | 0 |
| D | 0 | 27 | 0 |
| Quadrant | Total seconds | Saturated seconds | Saturation percentage |
|---|---|---|---|
| A | 8409 | 59 | 0.701629% |
| B | 8409 | 101 | 1.201094% |
| C | 8409 | 64 | 0.761089% |
| D | 8409 | 162 | 1.926507% |
Noise dominated data is calculated using 1-second bins in cleaned event files. If a bin has >2000 counts, and if more than 50% of those come from <1% of pixels, then it is considered to be noise-dominated and hence unusable.
| Quadrant | # 1 sec bins | Bins with >0 counts | Bins with >2000 counts | High rate bins dominated by noise | Noise dominated (total time) | Noise dominated (detector-on time) | Marked lightcurve |
|---|---|---|---|---|---|---|---|
| A | 11105 | 8409 | 0 | 0 | 0.00% | 0.00% | 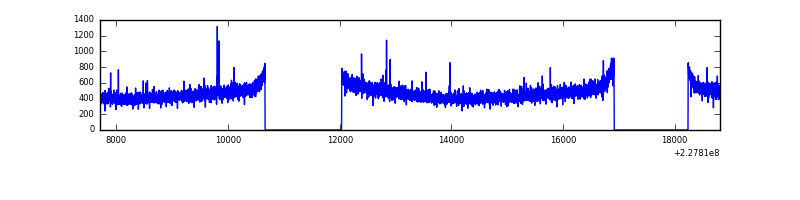 |
| B | 11105 | 8409 | 0 | 0 | 0.00% | 0.00% |  |
| C | 11105 | 8409 | 0 | 0 | 0.00% | 0.00% |  |
| D | 11105 | 8402 | 0 | 0 | 0.00% | 0.00% |  |
Top three noisy pixels from each quadrant. If the there are fewer than three noisy pixels in the level2.evt file, extra rows are filled as -1
| Pixel properties | Quadrant properties | ||||||
|---|---|---|---|---|---|---|---|
| Quadrant | DetID | PixID | Counts | Sigma | Mean | Median | Sigma |
| A | 0 | 29 | 499 | 10.6 | 133 | 125 | 35.3 |
| A | 7 | 110 | 461 | 9.53 | 133 | 125 | 35.3 |
| A | 0 | 28 | 383 | 7.32 | 133 | 125 | 35.3 |
| B | 2 | 9 | 420 | 10.56 | 132 | 126 | 27.8 |
| B | 12 | 226 | 367 | 8.65 | 132 | 126 | 27.8 |
| B | 3 | 17 | 343 | 7.79 | 132 | 126 | 27.8 |
| C | 1 | 81 | 402 | 7.24 | 137 | 129 | 37.7 |
| C | 1 | 80 | 381 | 6.68 | 137 | 129 | 37.7 |
| C | 9 | 242 | 368 | 6.34 | 137 | 129 | 37.7 |
| D | 6 | 231 | 356 | 6.96 | 126 | 116 | 34.5 |
| D | 3 | 14 | 333 | 6.29 | 126 | 116 | 34.5 |
| D | 6 | 67 | 330 | 6.2 | 126 | 116 | 34.5 |
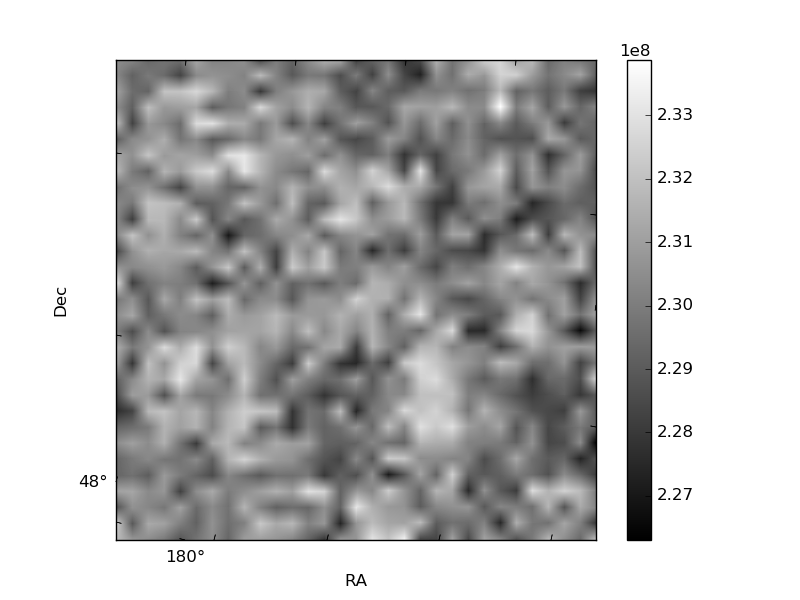
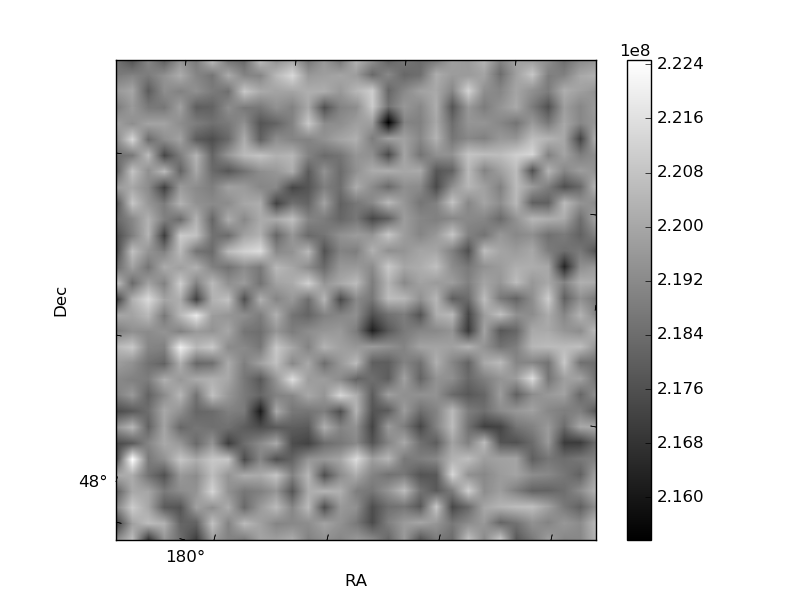
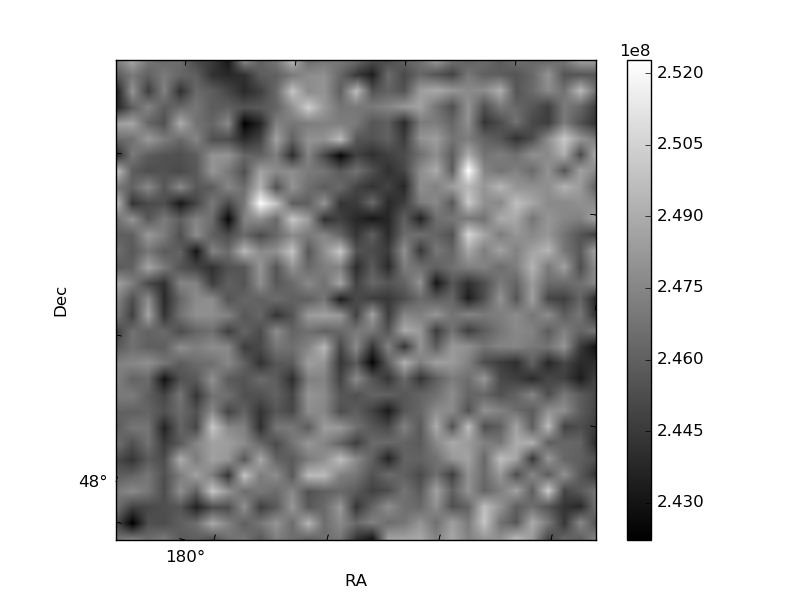
Histogram calculated using DETX and DETY for each event in the final _common_clean file
| Quadrant A | 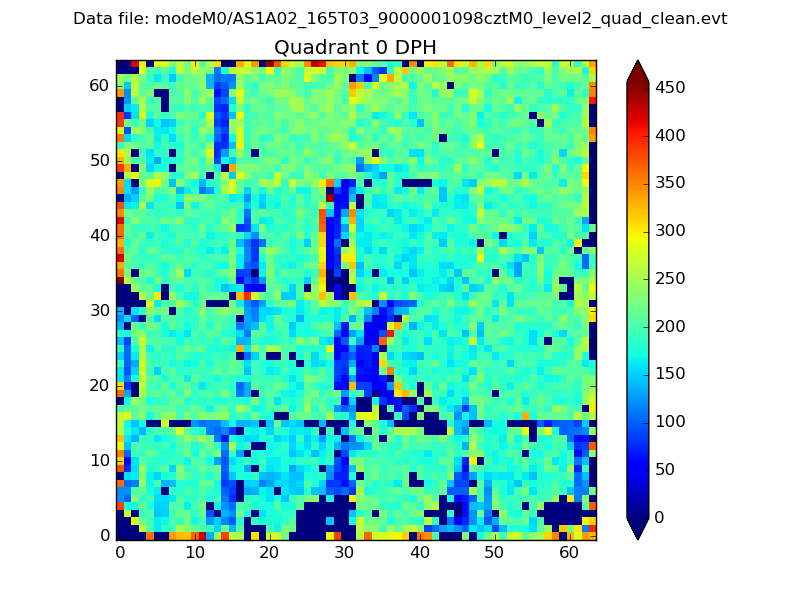 |
 |
Quadrant B |
|---|---|---|---|
| Quadrant D | 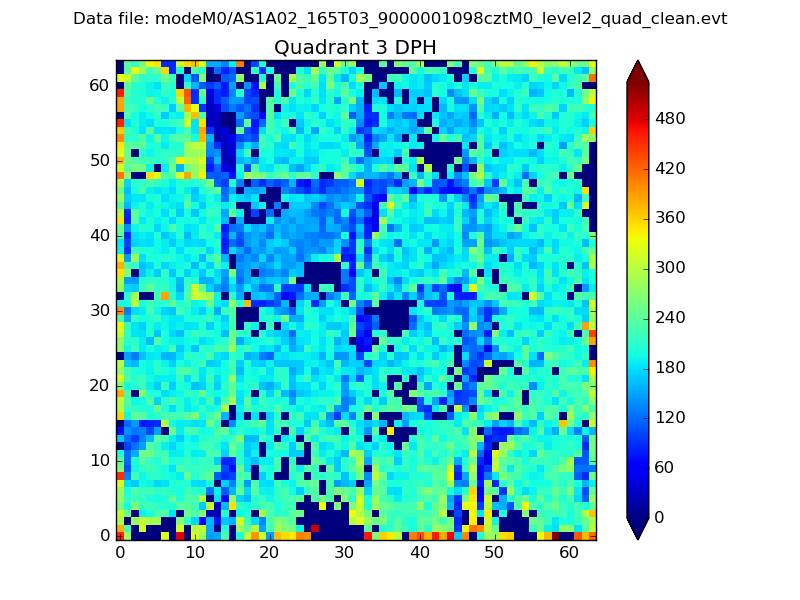 |
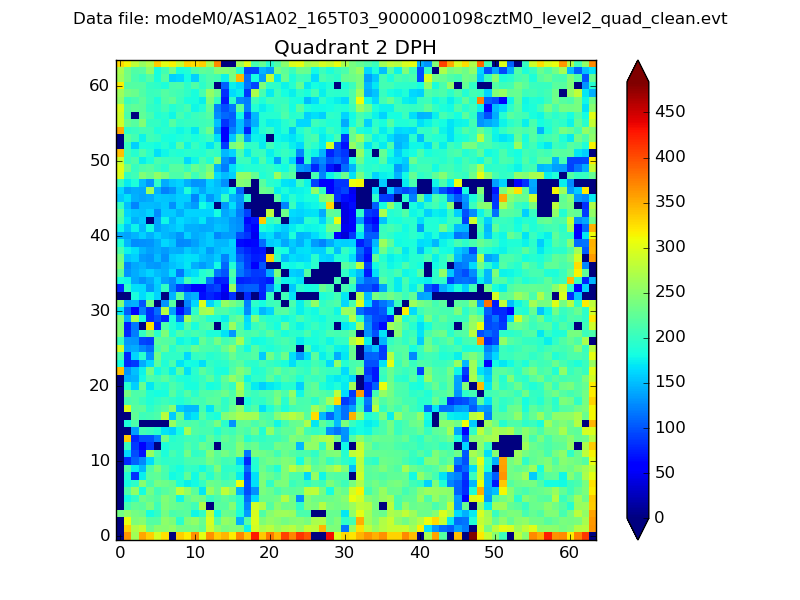 |
Quadrant C |
| Plot type | Count rate plots | Images |
|---|---|---|
| Comparison with Poisson distribution Blue bars denote a histogram of data divided into 1 sec bins. Red curve is a Poisson curve with rate = median count rate of data. |
 |
 |
| Quadrant-wise count rates Data is divided into 100 sec bins |
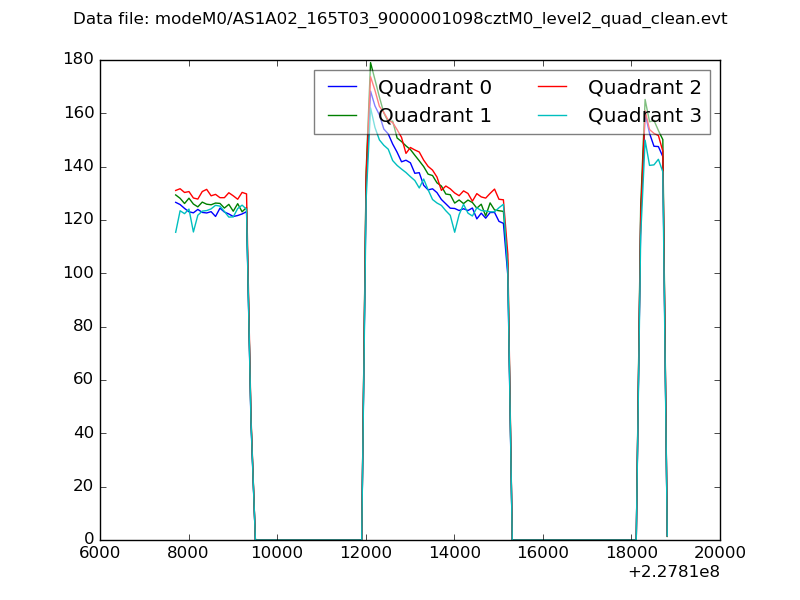 |
|
| Module-wise count rates for Quadrant A Data is divided into 100 sec bins |
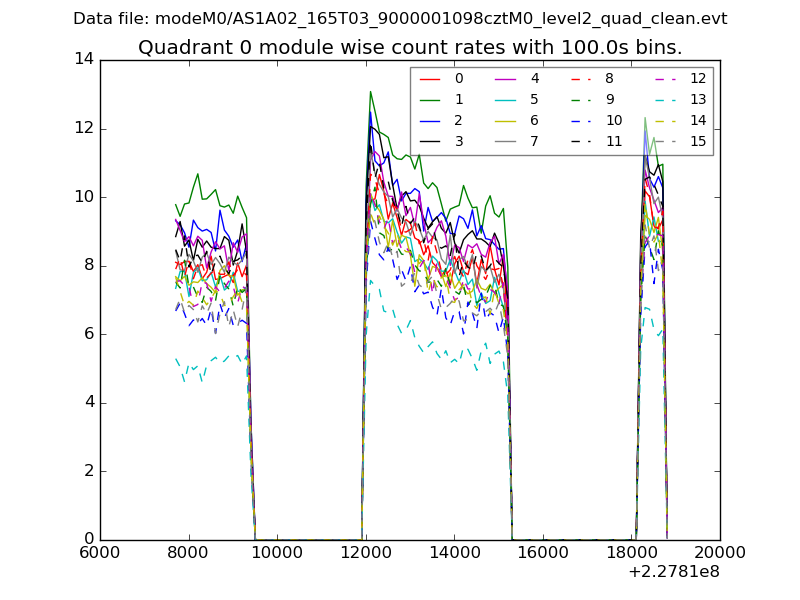 |
 |
| Module-wise count rates for Quadrant B Data is divided into 100 sec bins |
 |
 |
| Module-wise count rates for Quadrant C Data is divided into 100 sec bins |
 |
 |
| Module-wise count rates for Quadrant D Data is divided into 100 sec bins |
 |
 |
| Parameter | Plot |
|---|---|
| CZT HV Monitor |  |
| D_VDD |  |
| Temperature 1 | 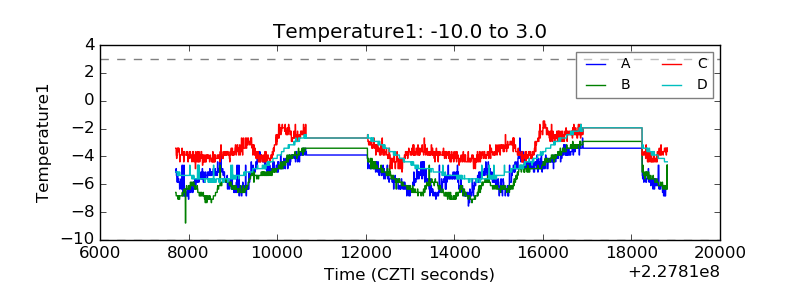 |
| Veto HV Monitor | 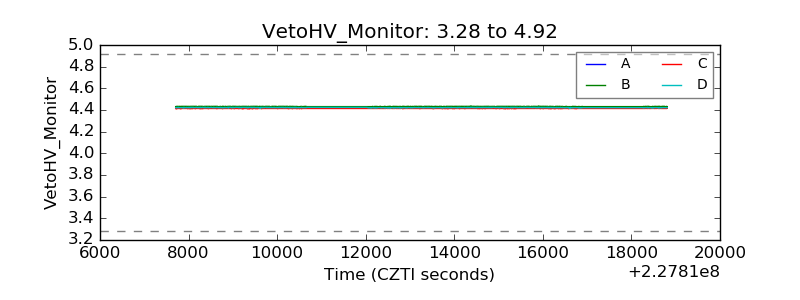 |
| Veto LLD | 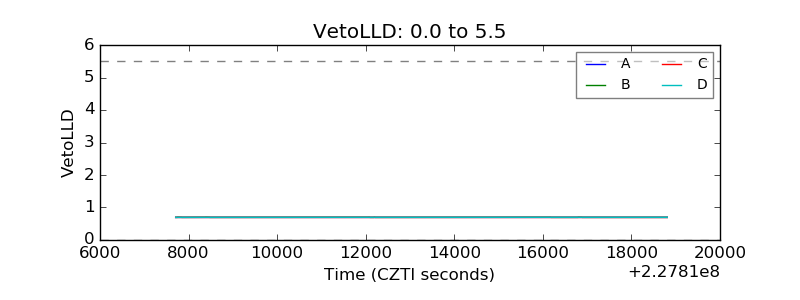 |
| Alpha Counter | 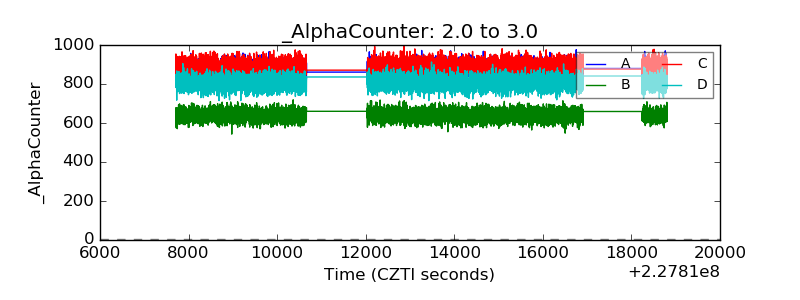 |
| _CPM_Rate | 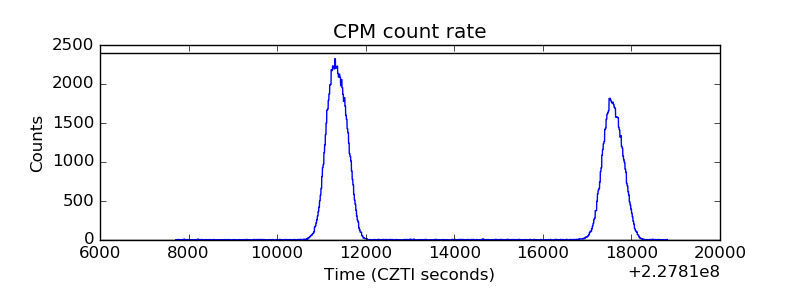 |
| CZT Counter |  |
| +2.5 Volts monitor |  |
| +5 Volts monitor |  |
| _ROLL_ROT |  |
| _Roll_DEC |  |
| _Roll_RA |  |
| Veto Counter |  |