| Param | Original file | Final file |
|---|---|---|
| Filename | modeM0/AS1A02_165T03_9000001098_08003cztM0_level2.evt | modeM0/AS1A02_165T03_9000001098_08003cztM0_level2_quad_clean.evt |
| Size (bytes) | 289,062,720 | 62,642,880 |
| Size | 275.7 MB | 59.7 MB |
| Events in quadrant A | 1,950,983 | 394,363 |
| Events in quadrant B | 2,049,166 | 408,213 |
| Events in quadrant C | 1,970,520 | 413,943 |
| Events in quadrant D | 2,500,416 | 387,979 |
| Mode SS | |||
|---|---|---|---|
| Quadrant | BADHDUFLAG | Total packets | Discarded packets |
| A | 0 | 84 | 0 |
| B | 0 | 84 | 0 |
| C | 0 | 84 | 0 |
| D | 0 | 84 | 0 |
| Mode M0 | |||
|---|---|---|---|
| Quadrant | BADHDUFLAG | Total packets | Discarded packets |
| A | 0 | 8636 | 2 |
| B | 0 | 8914 | 1 |
| C | 0 | 8689 | 1 |
| D | 0 | 10350 | 1 |
| Mode M9 | |||
|---|---|---|---|
| Quadrant | BADHDUFLAG | Total packets | Discarded packets |
| A | 0 | 14 | 0 |
| B | 0 | 14 | 0 |
| C | 0 | 14 | 0 |
| D | 0 | 14 | 0 |
| Quadrant | Total seconds | Saturated seconds | Saturation percentage |
|---|---|---|---|
| A | 4150 | 20 | 0.481928% |
| B | 4150 | 35 | 0.843373% |
| C | 4150 | 19 | 0.457831% |
| D | 4150 | 77 | 1.855422% |
Noise dominated data is calculated using 1-second bins in cleaned event files. If a bin has >2000 counts, and if more than 50% of those come from <1% of pixels, then it is considered to be noise-dominated and hence unusable.
| Quadrant | # 1 sec bins | Bins with >0 counts | Bins with >2000 counts | High rate bins dominated by noise | Noise dominated (total time) | Noise dominated (detector-on time) | Marked lightcurve |
|---|---|---|---|---|---|---|---|
| A | 5521 | 4151 | 0 | 0 | 0.00% | 0.00% | 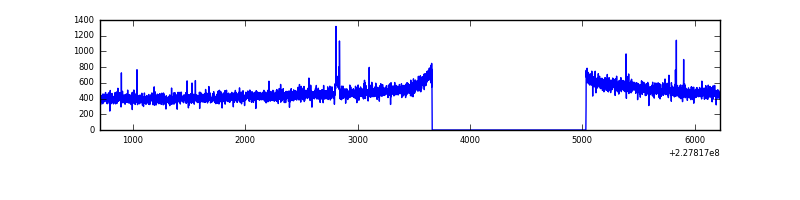 |
| B | 5521 | 4151 | 1 | 1 | 0.02% | 0.02% | 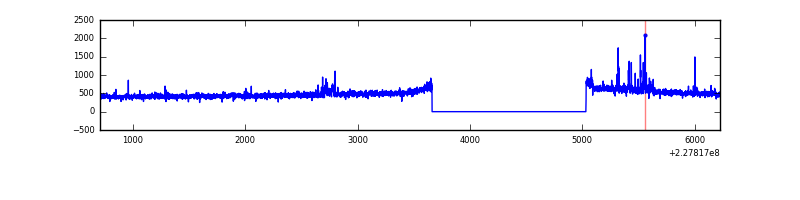 |
| C | 5521 | 4151 | 0 | 0 | 0.00% | 0.00% | 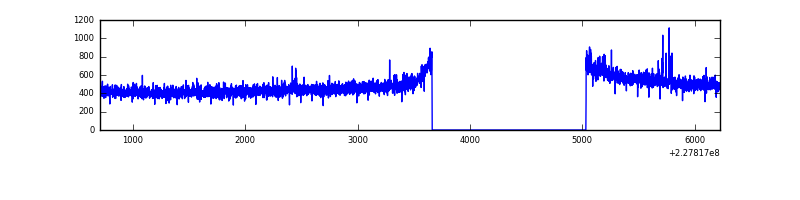 |
| D | 5521 | 4151 | 45 | 45 | 0.82% | 1.08% | 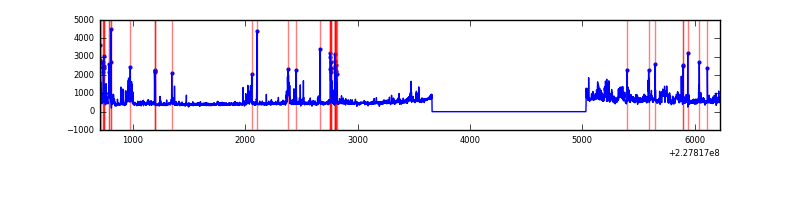 |
Top three noisy pixels from each quadrant. If the there are fewer than three noisy pixels in the level2.evt file, extra rows are filled as -1
| Pixel properties | Quadrant properties | ||||||
|---|---|---|---|---|---|---|---|
| Quadrant | DetID | PixID | Counts | Sigma | Mean | Median | Sigma |
| A | 0 | 128 | 7825 | 72.34 | 501 | 491 | 101.4 |
| A | 13 | 14 | 5715 | 51.52 | 501 | 491 | 101.4 |
| A | 0 | 226 | 4721 | 41.72 | 501 | 491 | 101.4 |
| B | 5 | 255 | 27452 | 281.54 | 508 | 497 | 95.7 |
| B | 4 | 239 | 23926 | 244.71 | 508 | 497 | 95.7 |
| B | 11 | 51 | 13649 | 137.37 | 508 | 497 | 95.7 |
| C | 1 | 16 | 14507 | 121.86 | 499 | 501 | 114.9 |
| C | 13 | 61 | 3783 | 28.55 | 499 | 501 | 114.9 |
| C | 10 | 169 | 2912 | 20.97 | 499 | 501 | 114.9 |
| D | 1 | 52 | 302488 | 2541.28 | 489 | 476 | 118.8 |
| D | 11 | 144 | 174023 | 1460.31 | 489 | 476 | 118.8 |
| D | 2 | 14 | 133267 | 1117.37 | 489 | 476 | 118.8 |
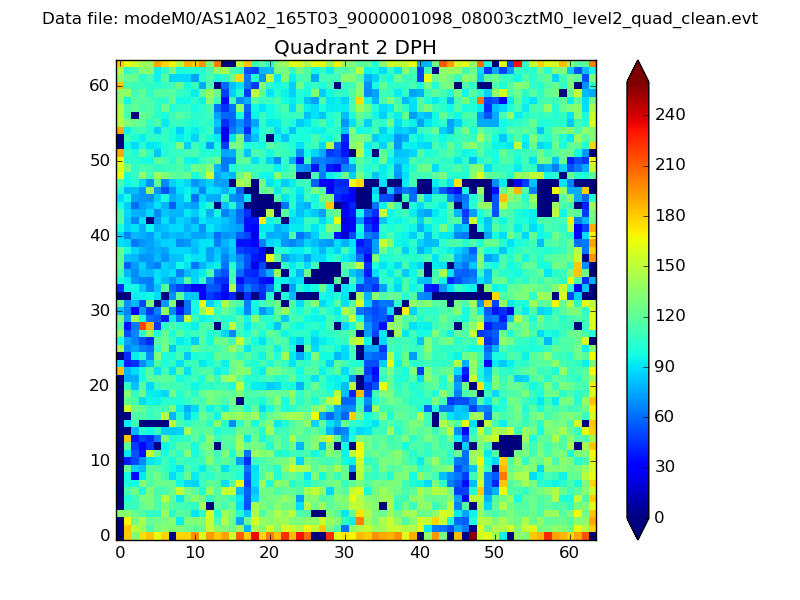
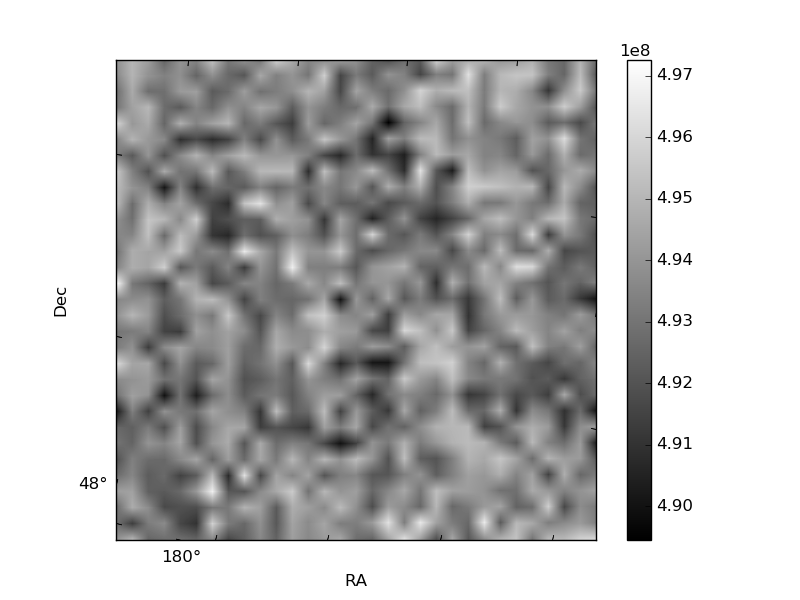
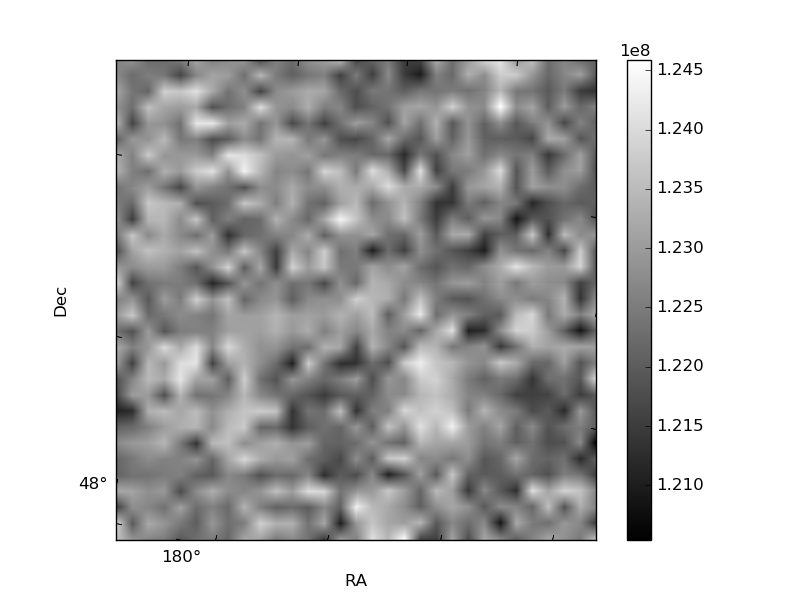
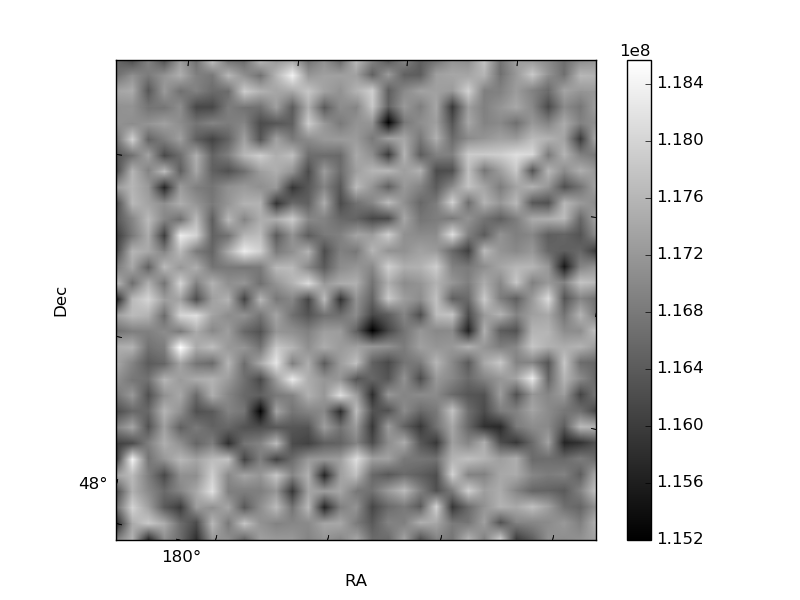
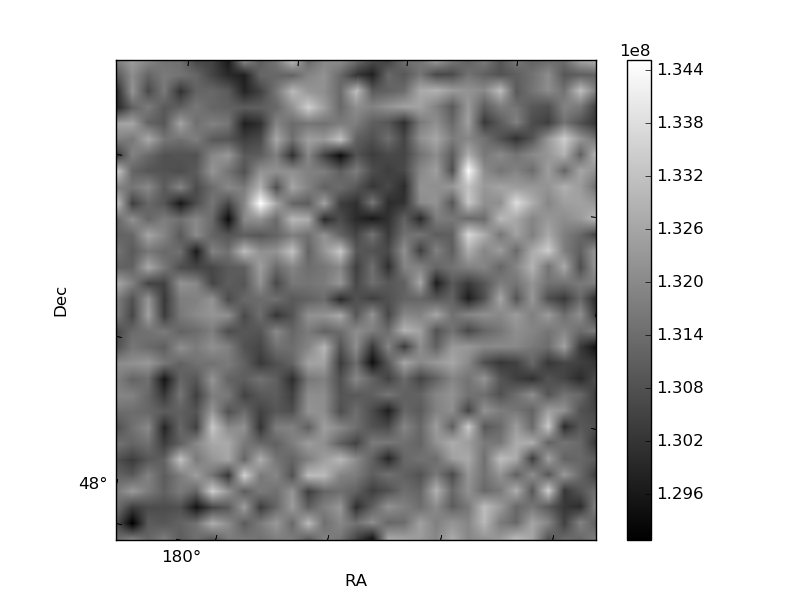
Histogram calculated using DETX and DETY for each event in the final _common_clean file
| Quadrant A | 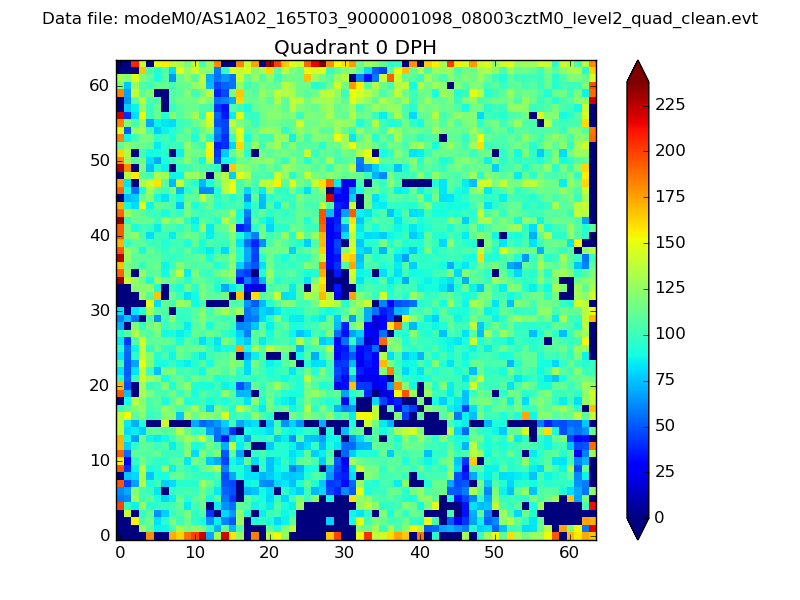 |
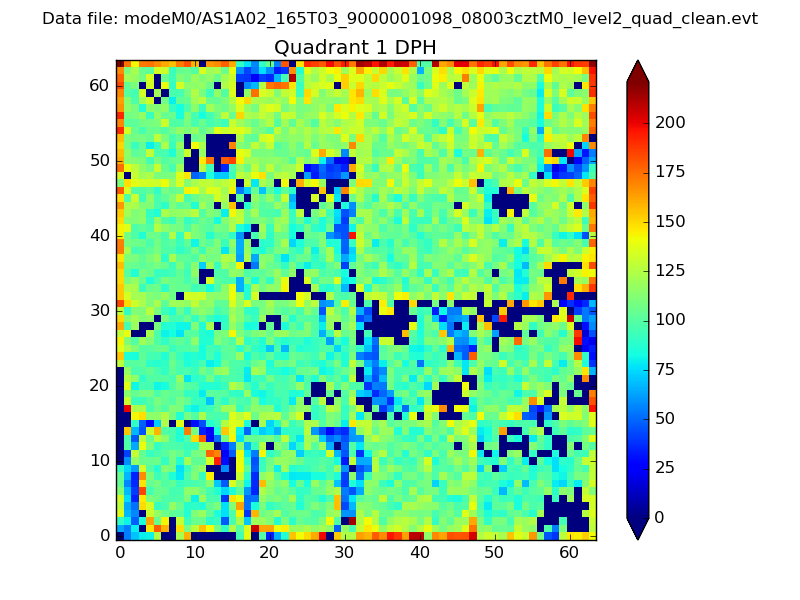 |
Quadrant B |
|---|---|---|---|
| Quadrant D | 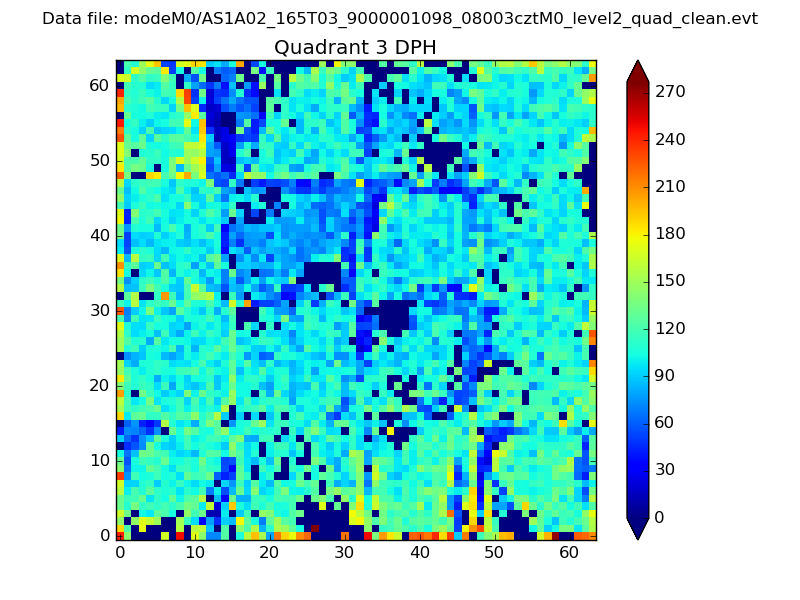 |
 |
Quadrant C |
| Plot type | Count rate plots | Images |
|---|---|---|
| Comparison with Poisson distribution Blue bars denote a histogram of data divided into 1 sec bins. Red curve is a Poisson curve with rate = median count rate of data. |
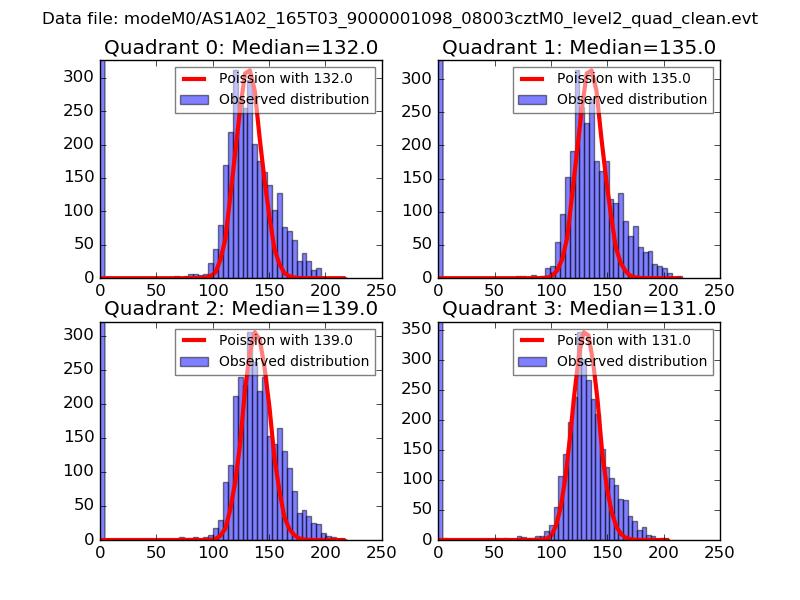 |
 |
| Quadrant-wise count rates Data is divided into 100 sec bins |
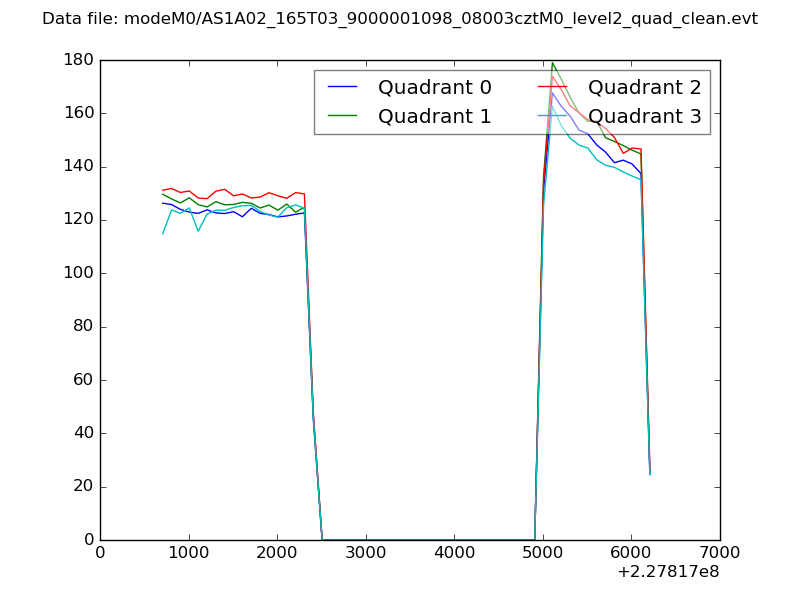 |
|
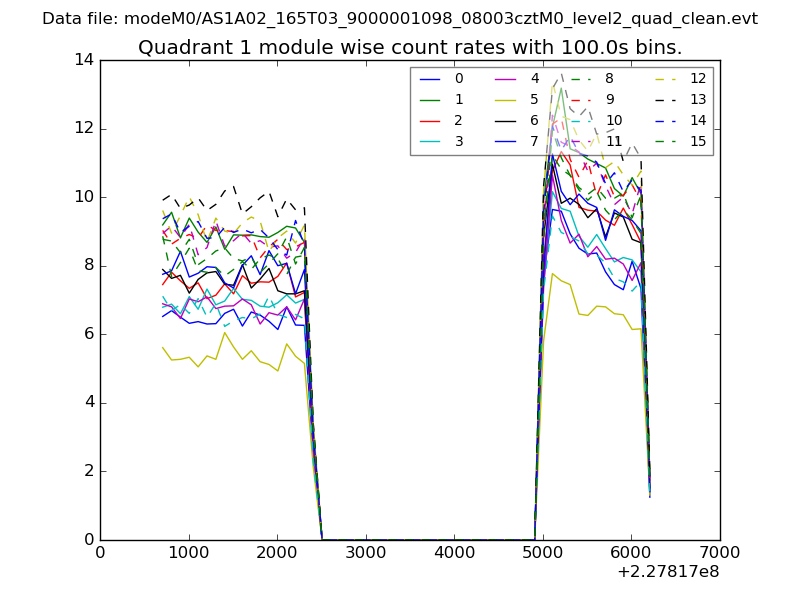
| Module-wise count rates for Quadrant A Data is divided into 100 sec bins |
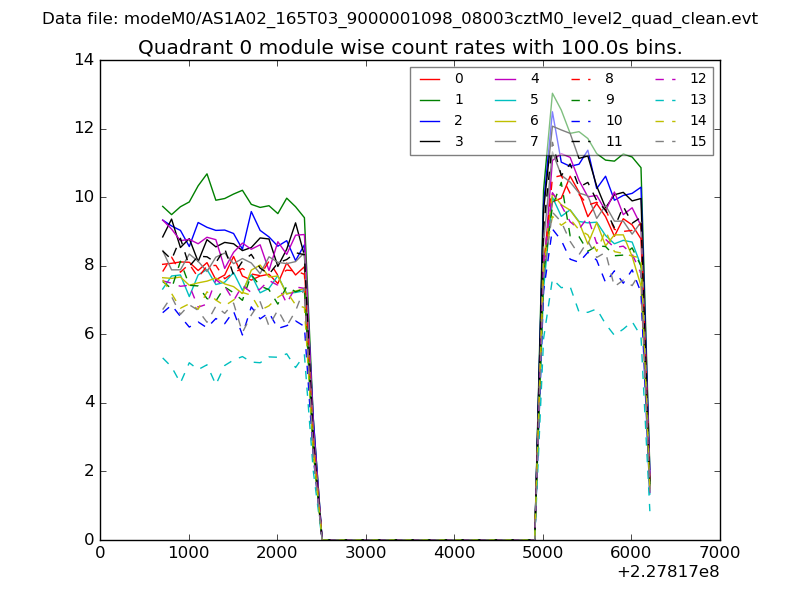 |
 |
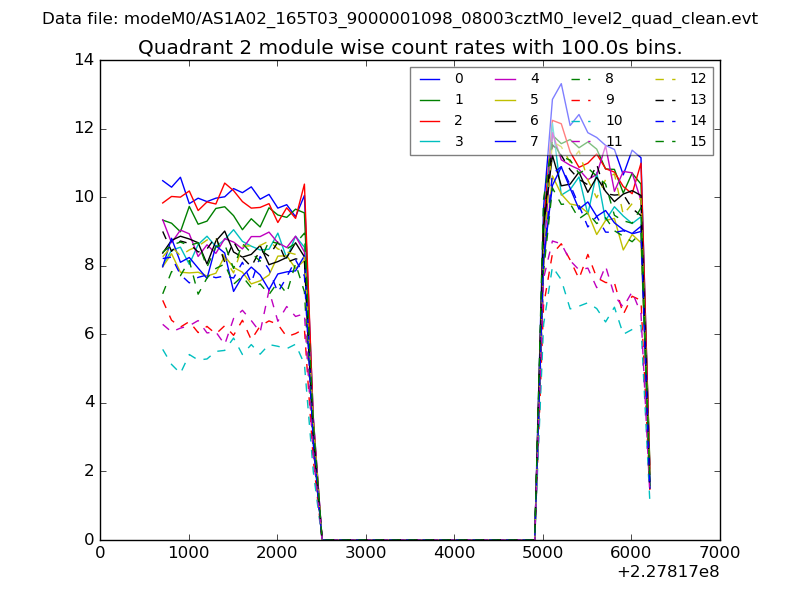
| Module-wise count rates for Quadrant B Data is divided into 100 sec bins |
 |
 |
| Module-wise count rates for Quadrant C Data is divided into 100 sec bins |
 |
 |
| Module-wise count rates for Quadrant D Data is divided into 100 sec bins |
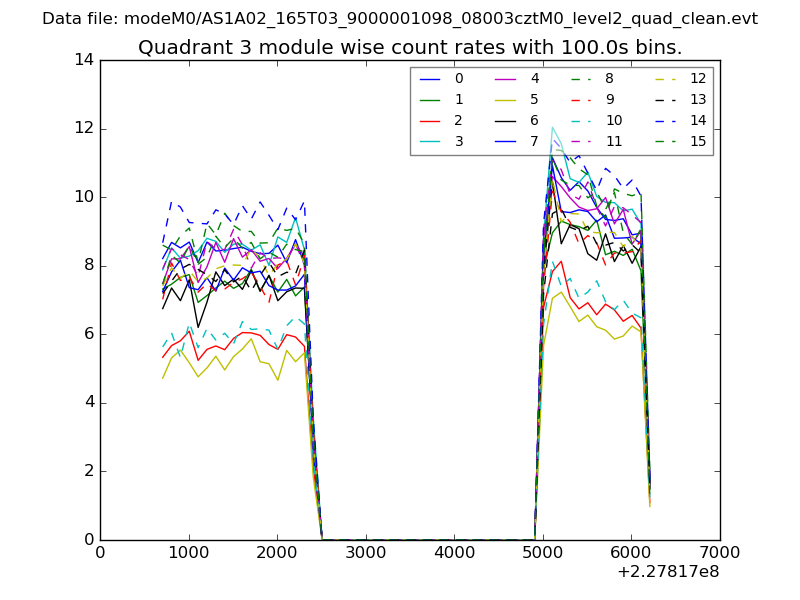 |
 |
| Parameter | Plot |
|---|---|
| CZT HV Monitor | 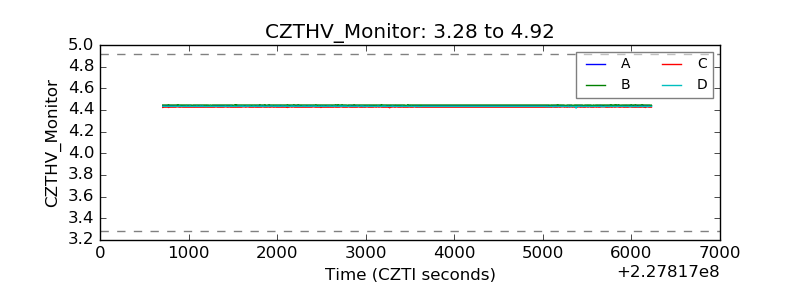 |
| D_VDD | 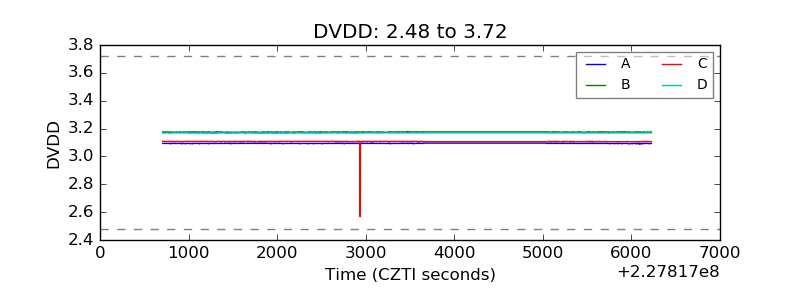 |
| Temperature 1 | 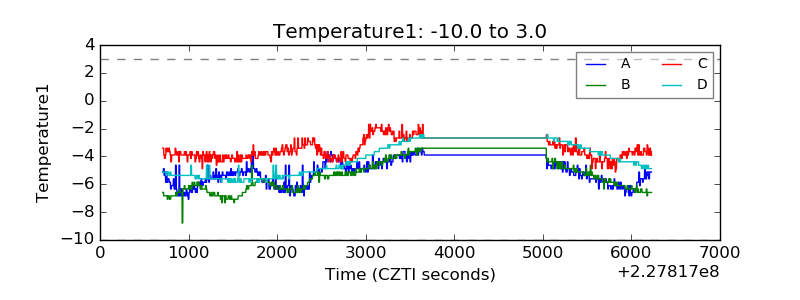 |
| Veto HV Monitor | 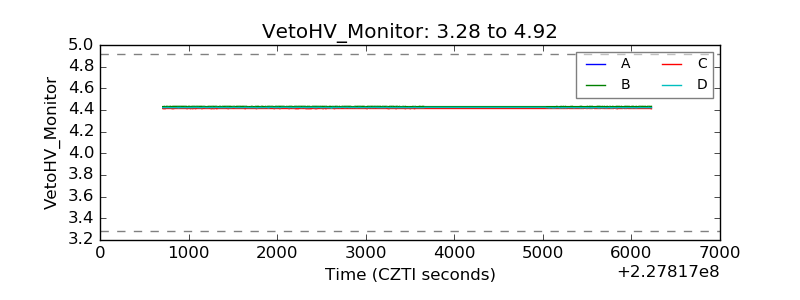 |
| Veto LLD | 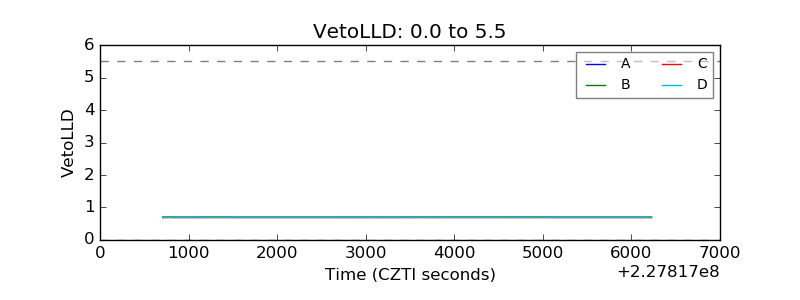 |
| Alpha Counter | 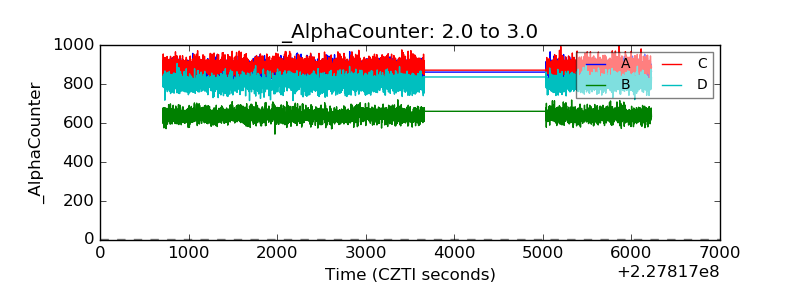 |
| _CPM_Rate | 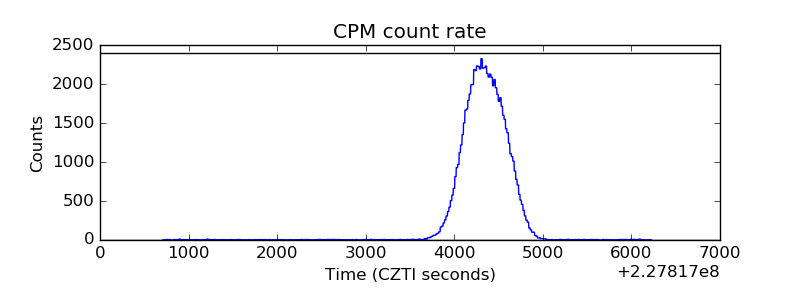 |
| CZT Counter | 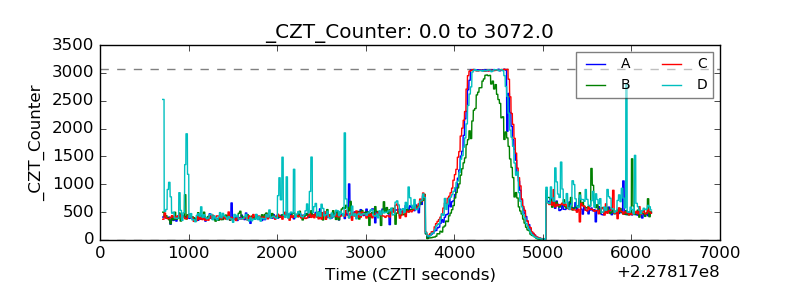 |
| +2.5 Volts monitor |  |
| +5 Volts monitor |  |
| _ROLL_ROT | 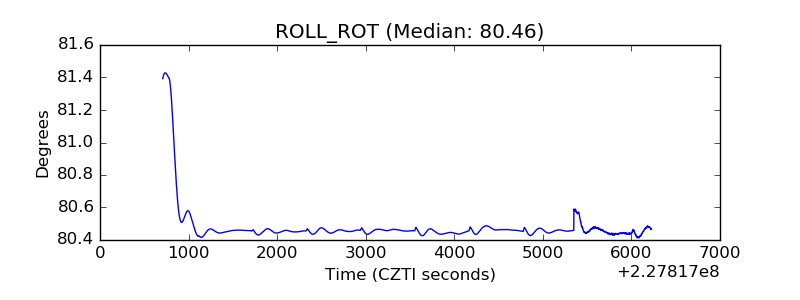 |
| _Roll_DEC | 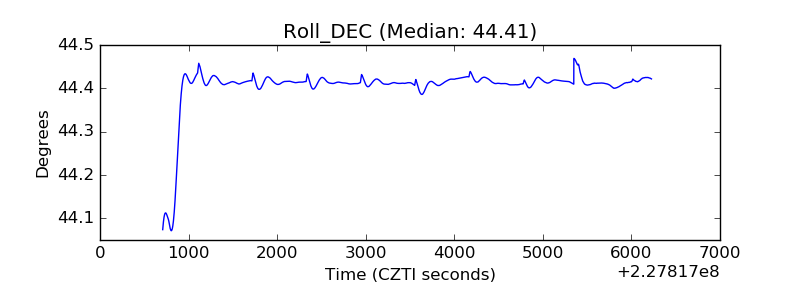 |
| _Roll_RA | 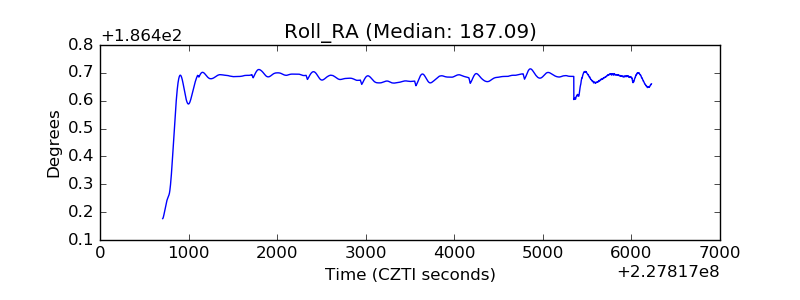 |
| Veto Counter | 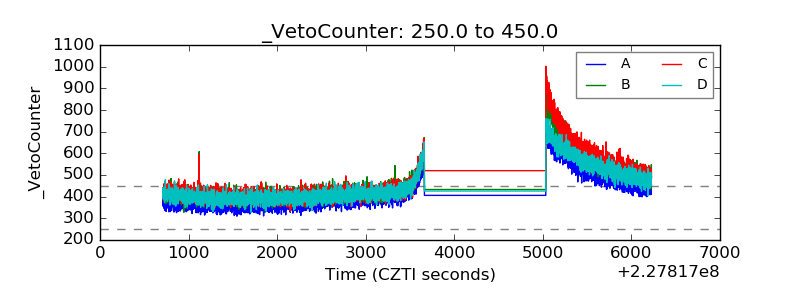 |