| Param | Original file | Final file |
|---|---|---|
| Filename | modeM0/AS1A02_165T03_9000001098_08004cztM0_level2.evt | modeM0/AS1A02_165T03_9000001098_08004cztM0_level2_quad_clean.evt |
| Size (bytes) | 420,880,320 | 84,139,200 |
| Size | 401.4 MB | 80.2 MB |
| Events in quadrant A | 2,825,191 | 526,792 |
| Events in quadrant B | 3,002,593 | 547,300 |
| Events in quadrant C | 2,872,839 | 550,087 |
| Events in quadrant D | 3,647,392 | 514,061 |
| Mode SS | |||
|---|---|---|---|
| Quadrant | BADHDUFLAG | Total packets | Discarded packets |
| A | 0 | 122 | 0 |
| B | 0 | 122 | 0 |
| C | 0 | 122 | 0 |
| D | 0 | 122 | 0 |
| Mode M0 | |||
|---|---|---|---|
| Quadrant | BADHDUFLAG | Total packets | Discarded packets |
| A | 0 | 12323 | 2 |
| B | 0 | 12770 | 2 |
| C | 0 | 12427 | 2 |
| D | 0 | 14914 | 2 |
| Mode M9 | |||
|---|---|---|---|
| Quadrant | BADHDUFLAG | Total packets | Discarded packets |
| A | 0 | 27 | 0 |
| B | 0 | 27 | 0 |
| C | 0 | 27 | 0 |
| D | 0 | 27 | 0 |
| Quadrant | Total seconds | Saturated seconds | Saturation percentage |
|---|---|---|---|
| A | 5859 | 57 | 0.972862% |
| B | 5859 | 100 | 1.706776% |
| C | 5859 | 64 | 1.092337% |
| D | 5859 | 115 | 1.962792% |
Noise dominated data is calculated using 1-second bins in cleaned event files. If a bin has >2000 counts, and if more than 50% of those come from <1% of pixels, then it is considered to be noise-dominated and hence unusable.
| Quadrant | # 1 sec bins | Bins with >0 counts | Bins with >2000 counts | High rate bins dominated by noise | Noise dominated (total time) | Noise dominated (detector-on time) | Marked lightcurve |
|---|---|---|---|---|---|---|---|
| A | 8555 | 5861 | 0 | 0 | 0.00% | 0.00% | 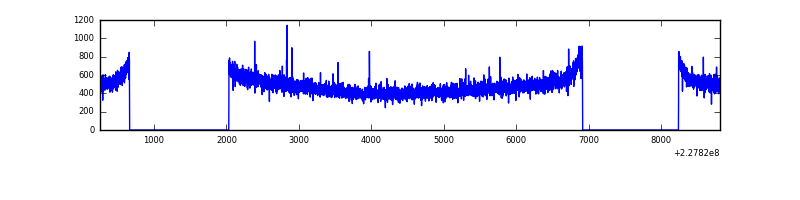 |
| B | 8555 | 5861 | 4 | 4 | 0.05% | 0.07% |  |
| C | 8555 | 5861 | 0 | 0 | 0.00% | 0.00% | 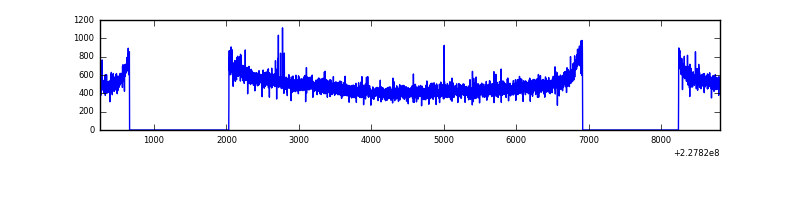 |
| D | 8555 | 5861 | 44 | 44 | 0.51% | 0.75% | 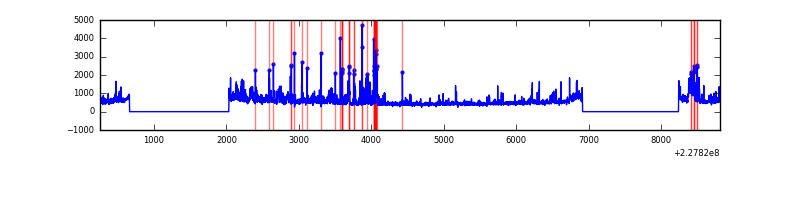 |
Top three noisy pixels from each quadrant. If the there are fewer than three noisy pixels in the level2.evt file, extra rows are filled as -1
| Pixel properties | Quadrant properties | ||||||
|---|---|---|---|---|---|---|---|
| Quadrant | DetID | PixID | Counts | Sigma | Mean | Median | Sigma |
| A | 0 | 226 | 6889 | 41.95 | 730 | 714 | 147.2 |
| A | 12 | 194 | 6411 | 38.7 | 730 | 714 | 147.2 |
| A | 4 | 2 | 5305 | 31.19 | 730 | 714 | 147.2 |
| B | 4 | 239 | 44826 | 317.79 | 741 | 725 | 138.8 |
| B | 5 | 255 | 25534 | 178.77 | 741 | 725 | 138.8 |
| B | 4 | 173 | 20640 | 143.51 | 741 | 725 | 138.8 |
| C | 1 | 16 | 16978 | 96.95 | 730 | 733 | 167.6 |
| C | 13 | 61 | 5539 | 28.68 | 730 | 733 | 167.6 |
| C | 9 | 236 | 3125 | 14.28 | 730 | 733 | 167.6 |
| D | 11 | 144 | 408391 | 2303.92 | 716 | 699 | 177.0 |
| D | 1 | 52 | 283971 | 1600.8 | 716 | 699 | 177.0 |
| D | 2 | 14 | 139066 | 781.93 | 716 | 699 | 177.0 |
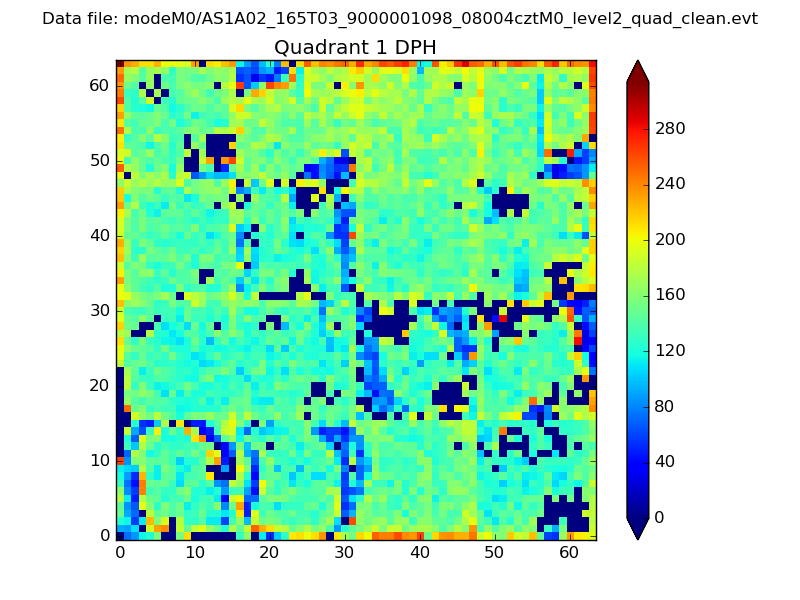
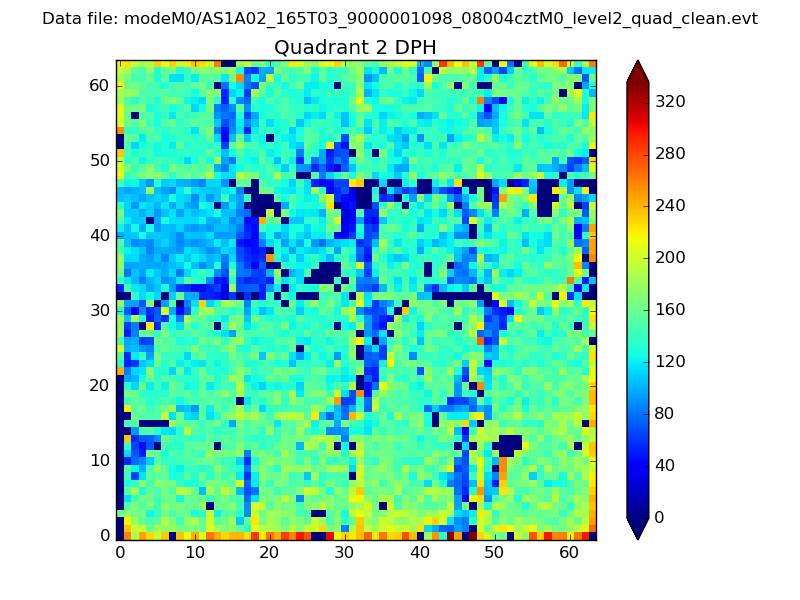
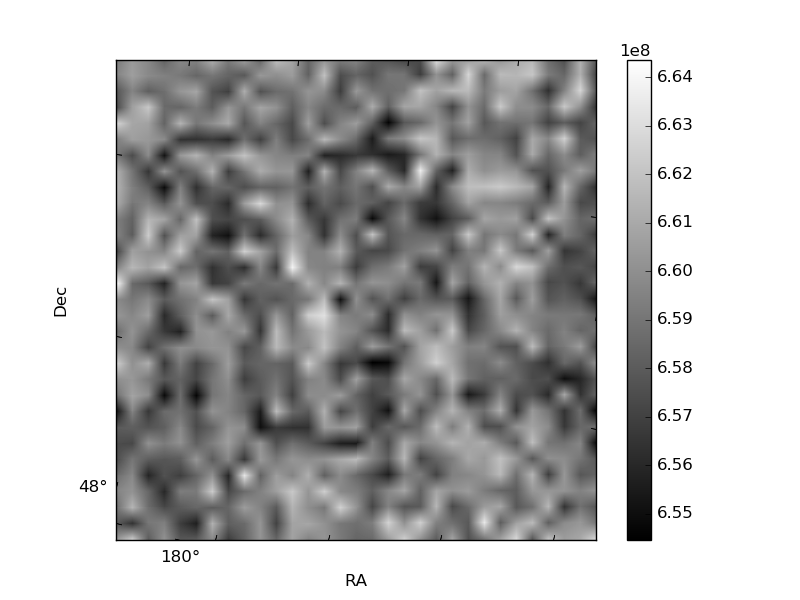
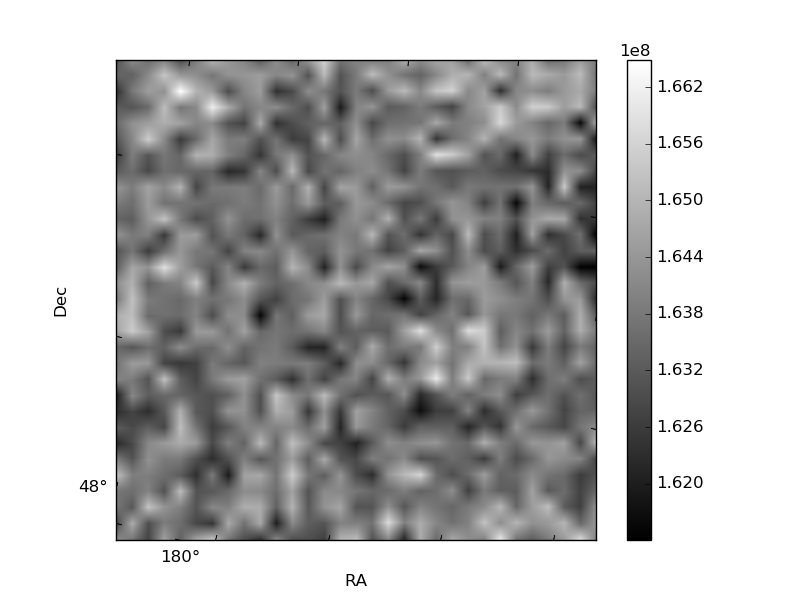
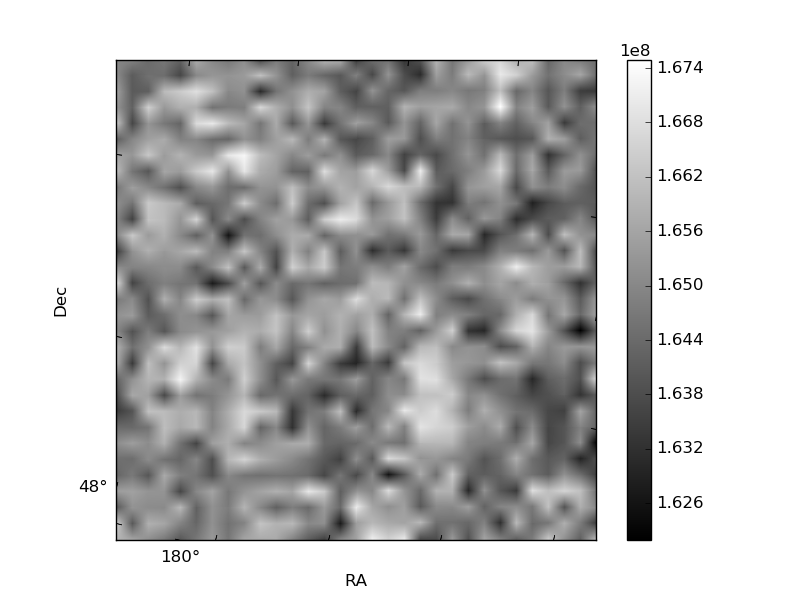
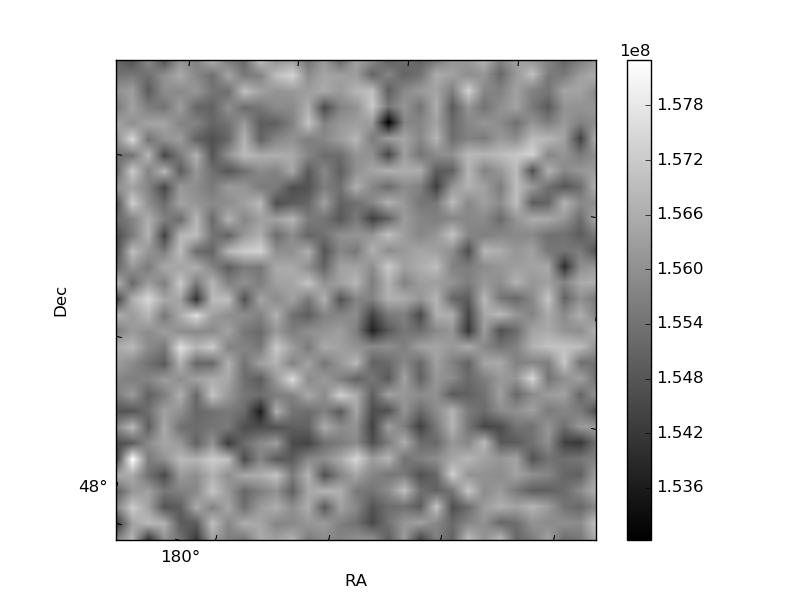
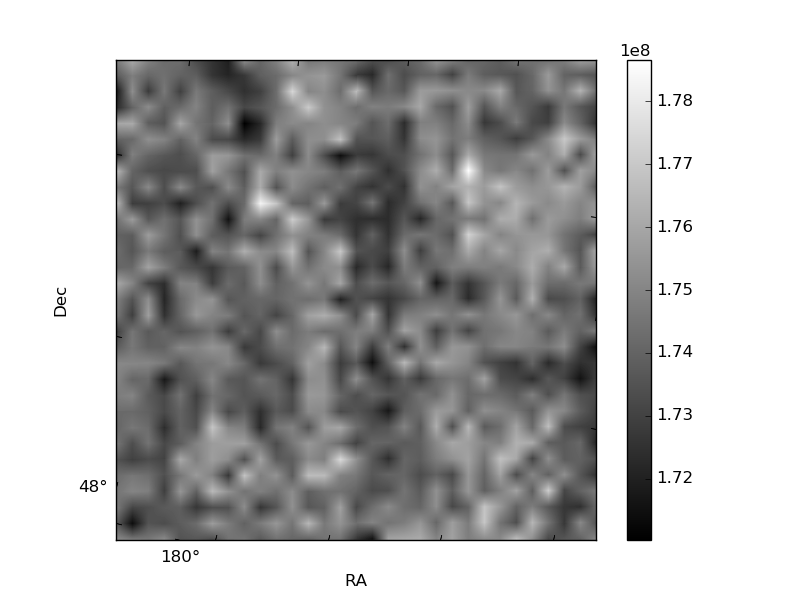
Histogram calculated using DETX and DETY for each event in the final _common_clean file
| Quadrant A | 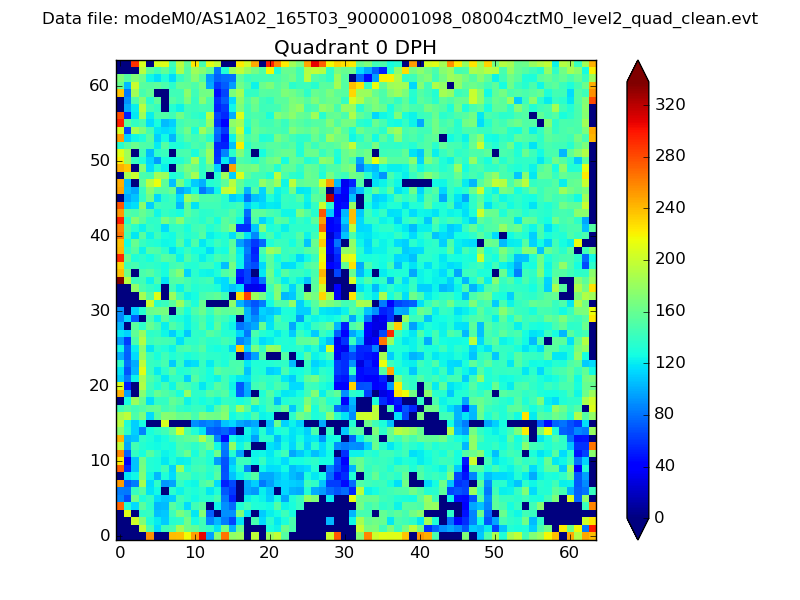 |
 |
Quadrant B |
|---|---|---|---|
| Quadrant D | 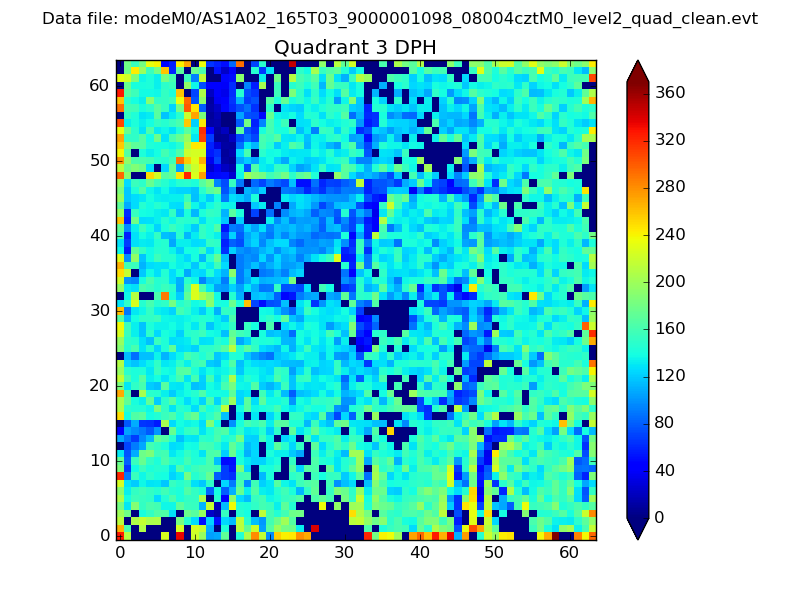 |
 |
Quadrant C |
| Plot type | Count rate plots | Images |
|---|---|---|
| Comparison with Poisson distribution Blue bars denote a histogram of data divided into 1 sec bins. Red curve is a Poisson curve with rate = median count rate of data. |
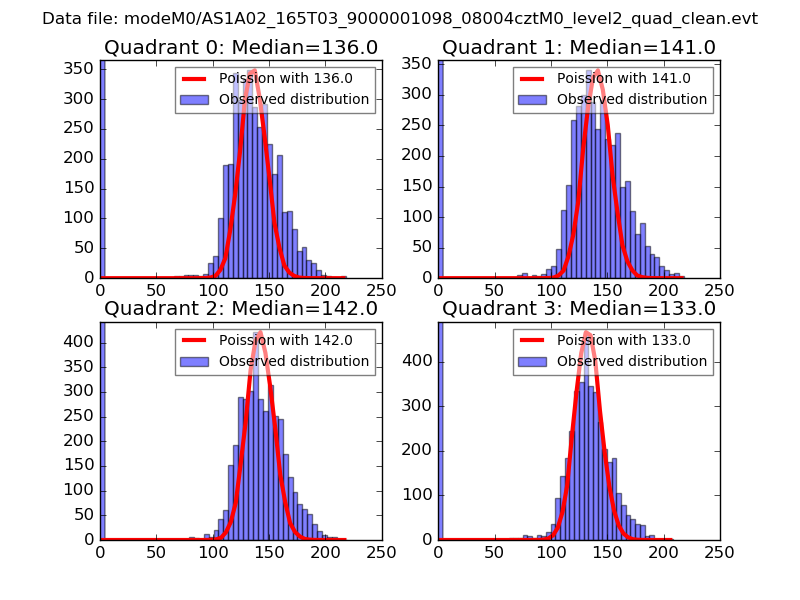 |
 |
| Quadrant-wise count rates Data is divided into 100 sec bins |
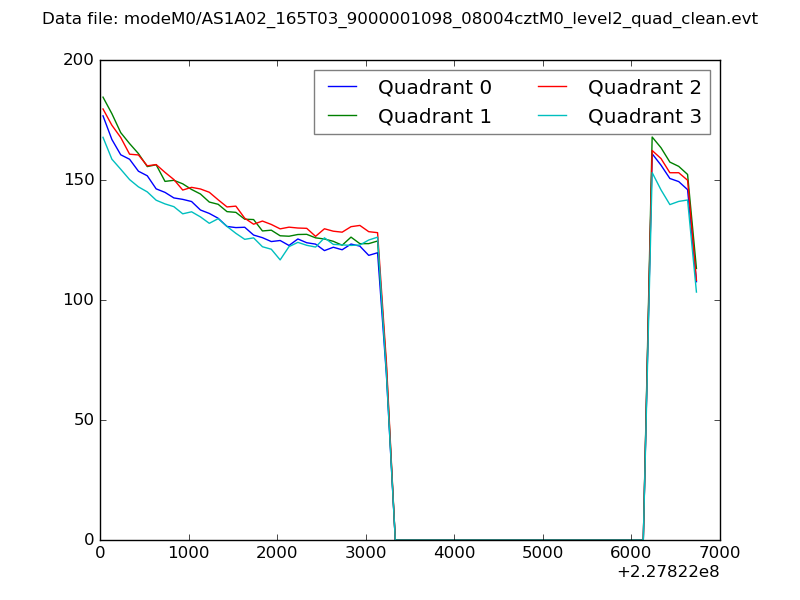 |
|
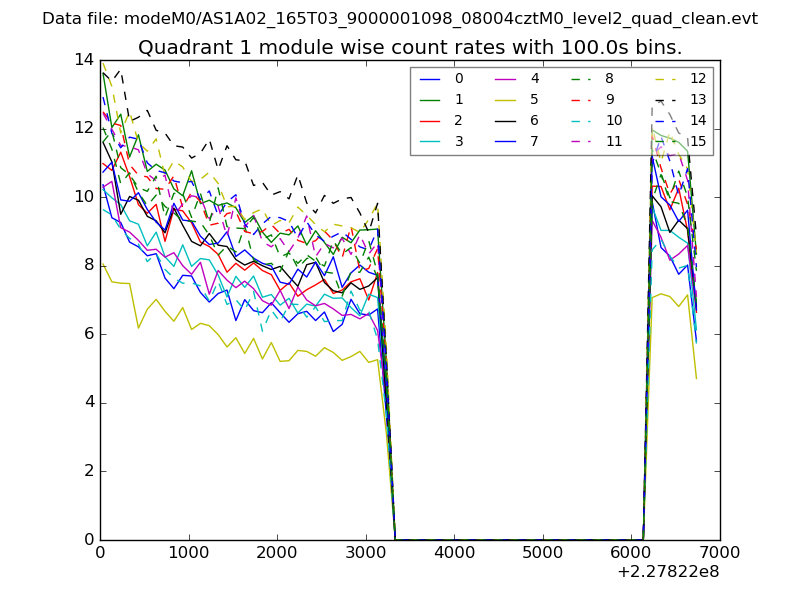
| Module-wise count rates for Quadrant A Data is divided into 100 sec bins |
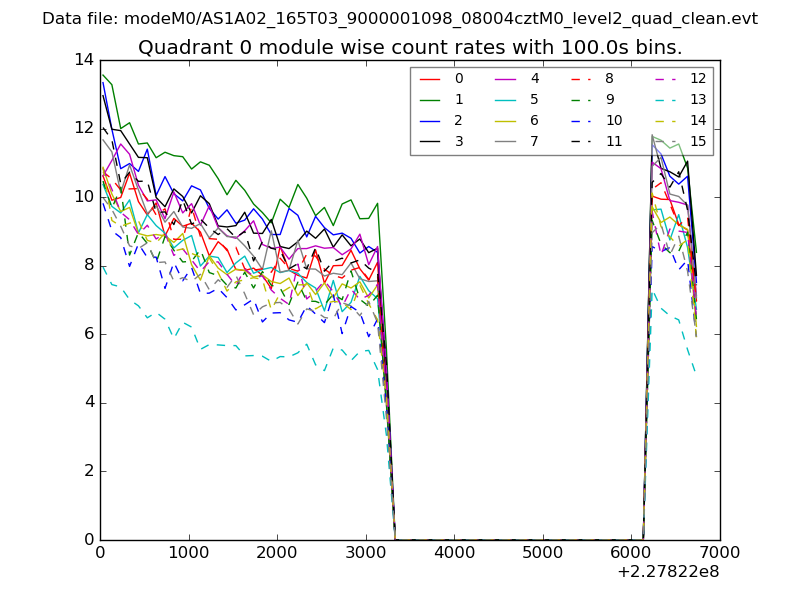 |
 |
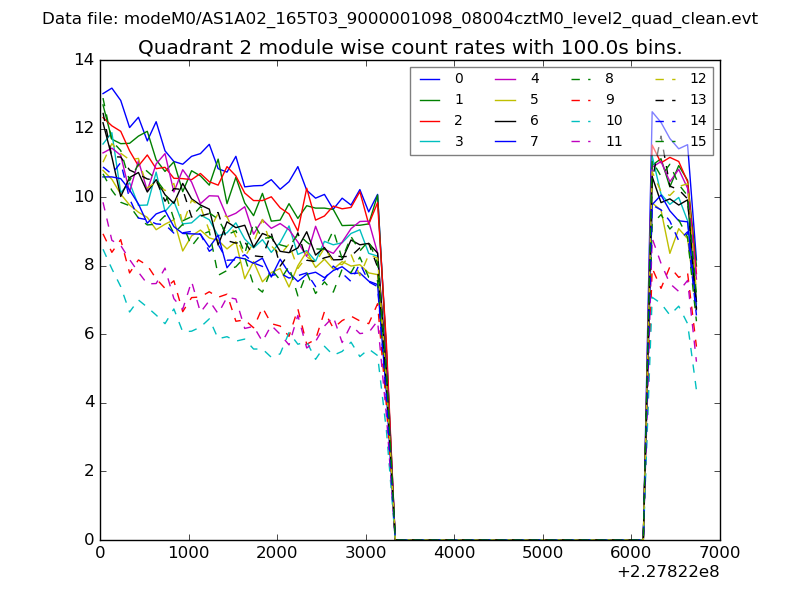
| Module-wise count rates for Quadrant B Data is divided into 100 sec bins |
 |
 |
| Module-wise count rates for Quadrant C Data is divided into 100 sec bins |
 |
 |
| Module-wise count rates for Quadrant D Data is divided into 100 sec bins |
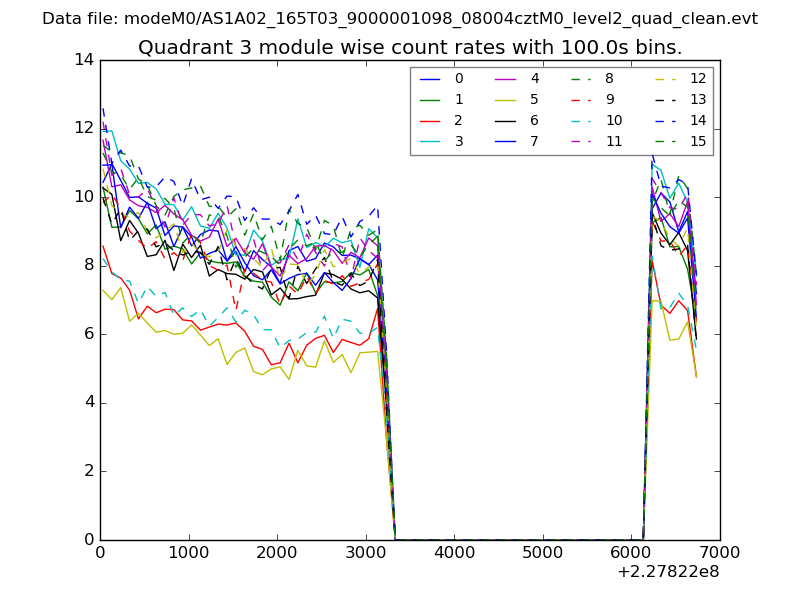 |
 |
| Parameter | Plot |
|---|---|
| CZT HV Monitor | 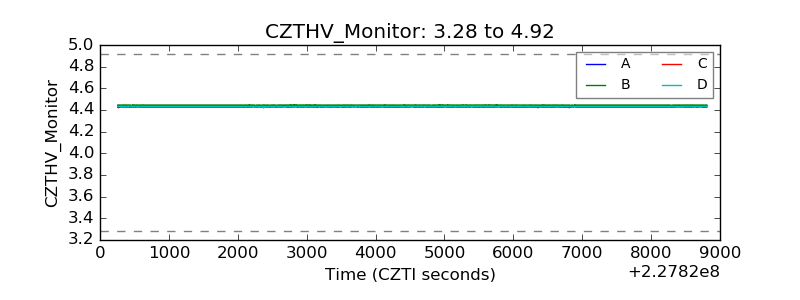 |
| D_VDD |  |
| Temperature 1 | 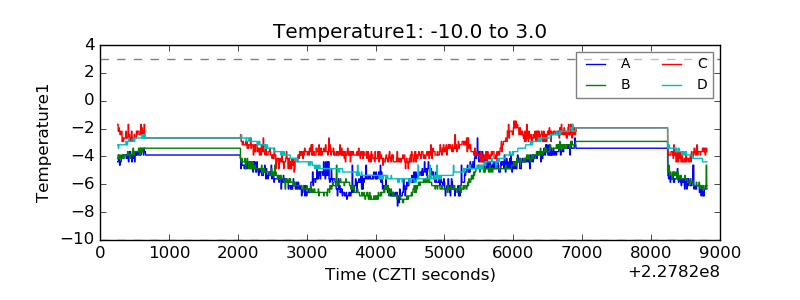 |
| Veto HV Monitor | 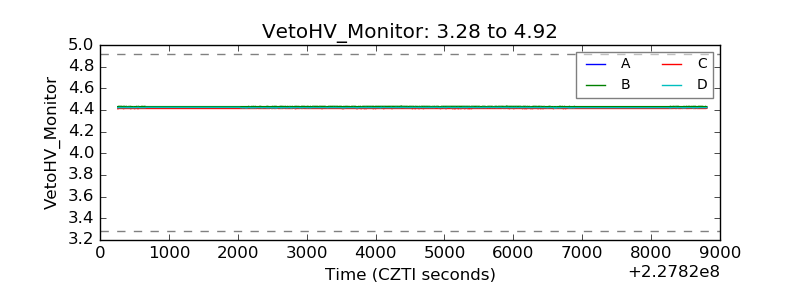 |
| Veto LLD | 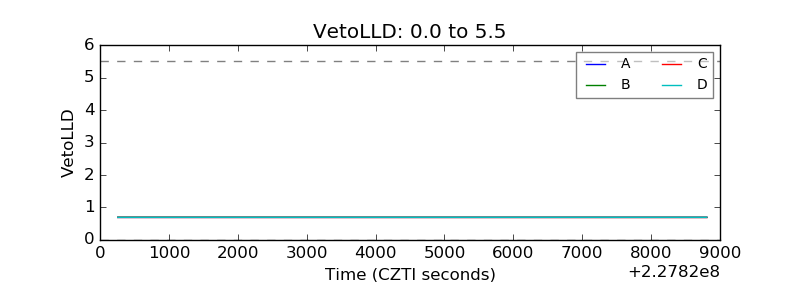 |
| Alpha Counter | 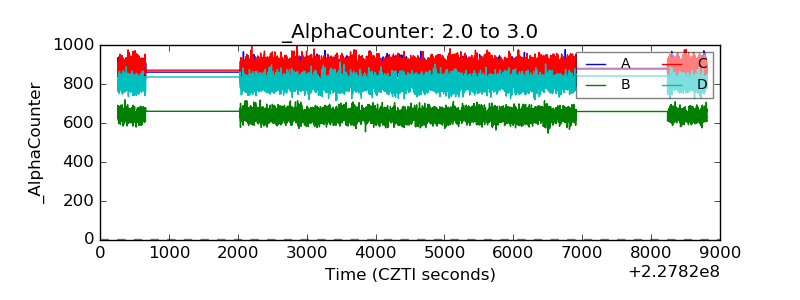 |
| _CPM_Rate | 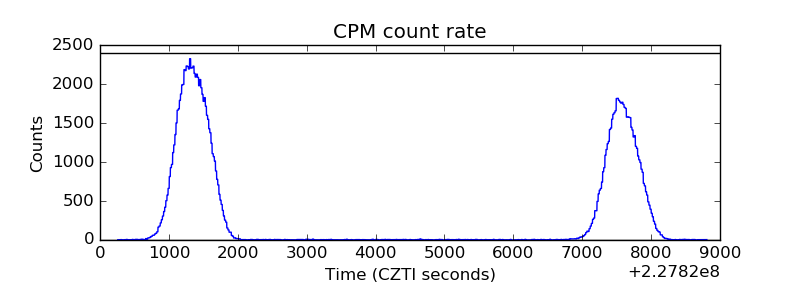 |
| CZT Counter | 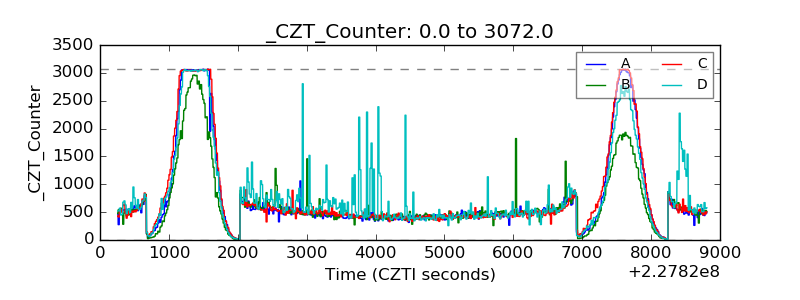 |
| +2.5 Volts monitor |  |
| +5 Volts monitor |  |
| _ROLL_ROT | 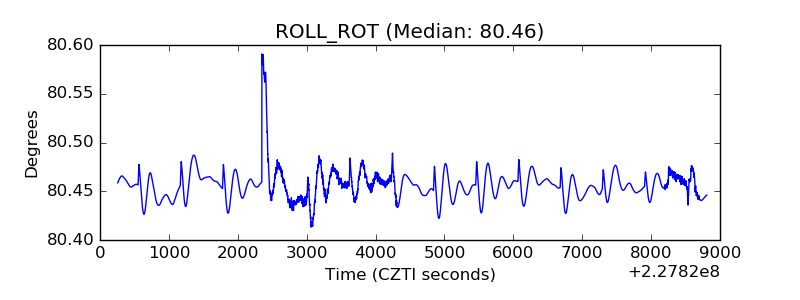 |
| _Roll_DEC | 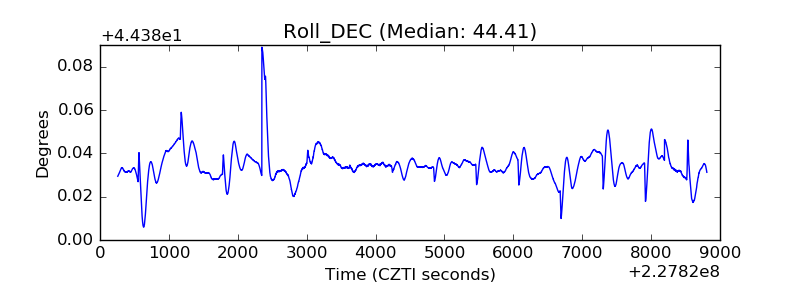 |
| _Roll_RA | 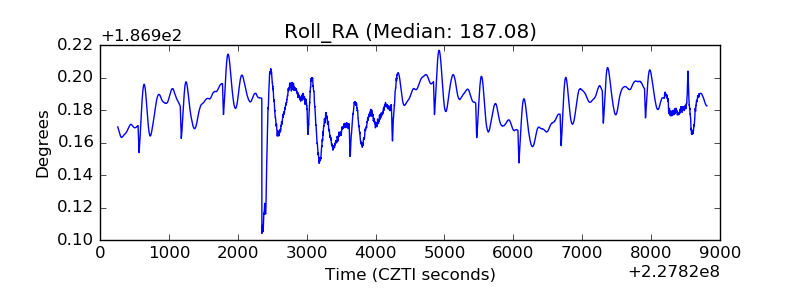 |
| Veto Counter | 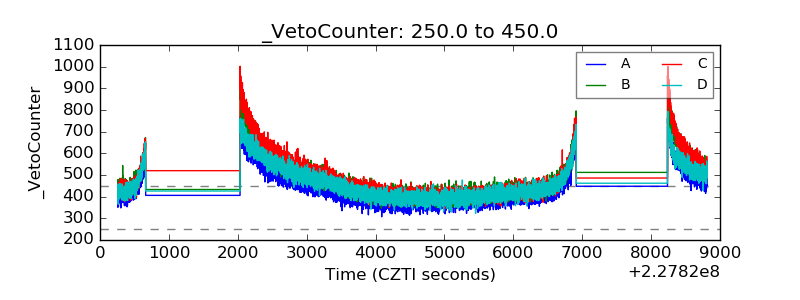 |