| Param | Original file | Final file |
|---|---|---|
| Filename | modeM0/AS1A02_165T03_9000001098_08005cztM0_level2.evt | modeM0/AS1A02_165T03_9000001098_08005cztM0_level2_quad_clean.evt |
| Size (bytes) | 87,102,720 | 14,135,040 |
| Size | 83.1 MB | 13.5 MB |
| Events in quadrant A | 574,554 | 87,254 |
| Events in quadrant B | 616,161 | 91,053 |
| Events in quadrant C | 587,374 | 88,709 |
| Events in quadrant D | 787,584 | 82,181 |
| Mode SS | |||
|---|---|---|---|
| Quadrant | BADHDUFLAG | Total packets | Discarded packets |
| A | 0 | 24 | 0 |
| B | 0 | 24 | 0 |
| C | 0 | 24 | 0 |
| D | 0 | 24 | 0 |
| Mode M0 | |||
|---|---|---|---|
| Quadrant | BADHDUFLAG | Total packets | Discarded packets |
| A | 0 | 2318 | 1 |
| B | 0 | 2449 | 1 |
| C | 0 | 2339 | 1 |
| D | 0 | 2997 | 1 |
| Mode M9 | |||
|---|---|---|---|
| Quadrant | BADHDUFLAG | Total packets | Discarded packets |
| A | 0 | 13 | 0 |
| B | 0 | 13 | 0 |
| C | 0 | 13 | 0 |
| D | 0 | 13 | 0 |
| Quadrant | Total seconds | Saturated seconds | Saturation percentage |
|---|---|---|---|
| A | 1012 | 37 | 3.656126% |
| B | 1012 | 62 | 6.126482% |
| C | 1012 | 45 | 4.446640% |
| D | 1012 | 59 | 5.830040% |
Noise dominated data is calculated using 1-second bins in cleaned event files. If a bin has >2000 counts, and if more than 50% of those come from <1% of pixels, then it is considered to be noise-dominated and hence unusable.
| Quadrant | # 1 sec bins | Bins with >0 counts | Bins with >2000 counts | High rate bins dominated by noise | Noise dominated (total time) | Noise dominated (detector-on time) | Marked lightcurve |
|---|---|---|---|---|---|---|---|
| A | 2337 | 1013 | 0 | 0 | 0.00% | 0.00% | 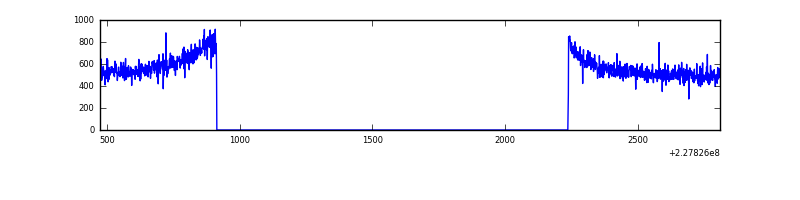 |
| B | 2337 | 1013 | 1 | 1 | 0.04% | 0.10% | 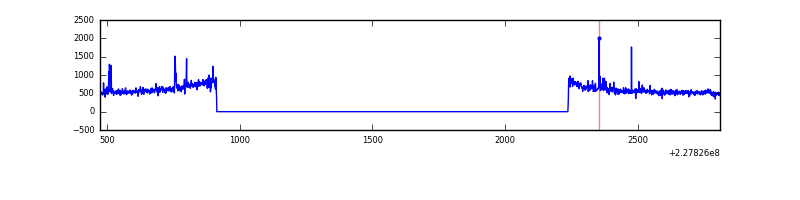 |
| C | 2337 | 1013 | 0 | 0 | 0.00% | 0.00% | 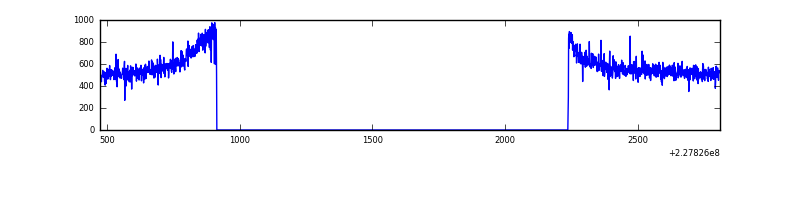 |
| D | 2337 | 1013 | 7 | 7 | 0.30% | 0.69% | 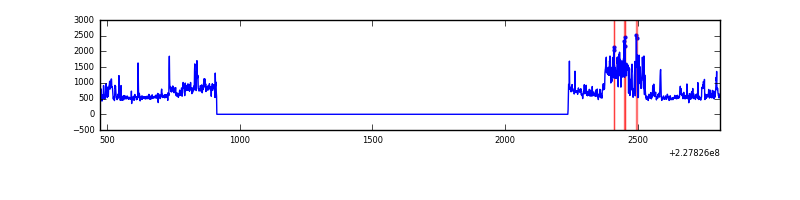 |
Top three noisy pixels from each quadrant. If the there are fewer than three noisy pixels in the level2.evt file, extra rows are filled as -1
| Pixel properties | Quadrant properties | ||||||
|---|---|---|---|---|---|---|---|
| Quadrant | DetID | PixID | Counts | Sigma | Mean | Median | Sigma |
| A | 0 | 226 | 1394 | 38.22 | 148 | 144 | 32.7 |
| A | 12 | 194 | 1344 | 36.69 | 148 | 144 | 32.7 |
| A | 13 | 14 | 1091 | 28.95 | 148 | 144 | 32.7 |
| B | 4 | 239 | 13021 | 419.42 | 151 | 146 | 30.7 |
| B | 5 | 250 | 7188 | 229.4 | 151 | 146 | 30.7 |
| B | 5 | 255 | 4379 | 137.9 | 151 | 146 | 30.7 |
| C | 1 | 16 | 1452 | 35.71 | 149 | 150 | 36.5 |
| C | 13 | 61 | 1096 | 25.94 | 149 | 150 | 36.5 |
| C | 12 | 4 | 995 | 23.17 | 149 | 150 | 36.5 |
| D | 11 | 144 | 168843 | 4367.54 | 146 | 142 | 38.6 |
| D | 1 | 52 | 37304 | 962.1 | 146 | 142 | 38.6 |
| D | 1 | 83 | 11003 | 281.18 | 146 | 142 | 38.6 |
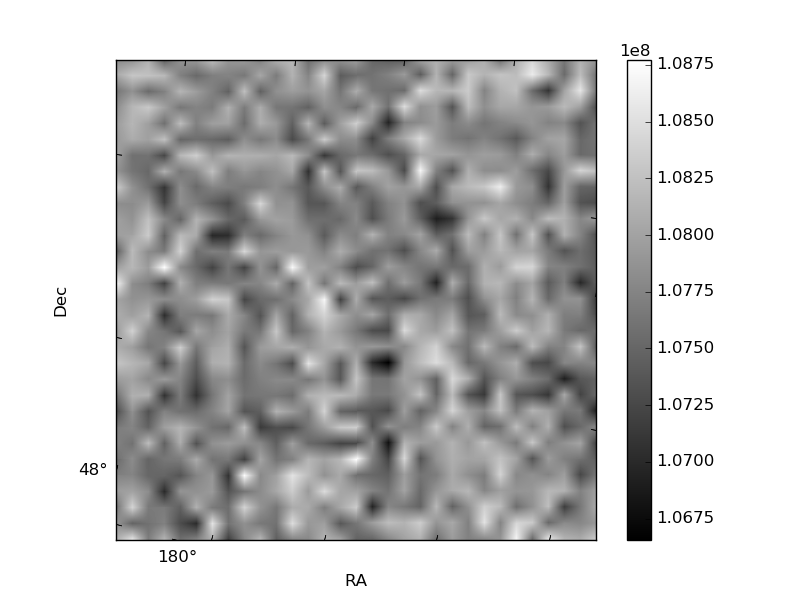
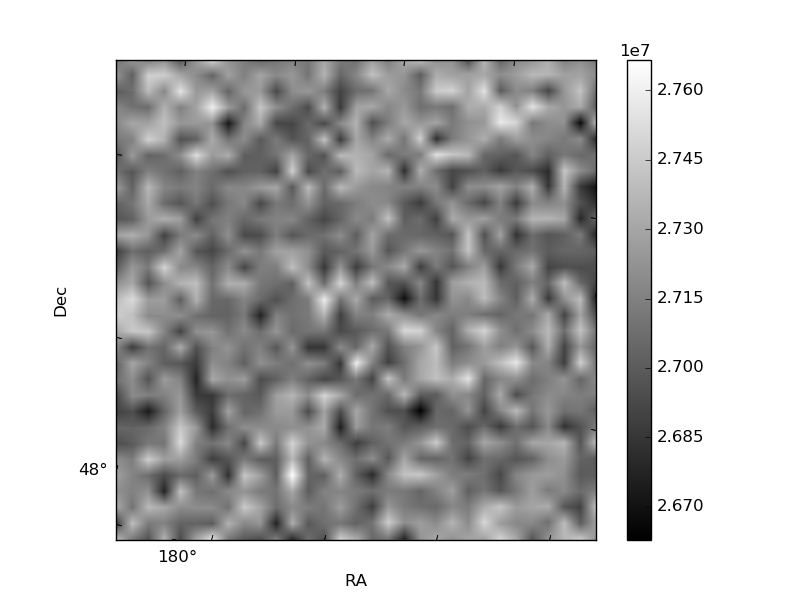
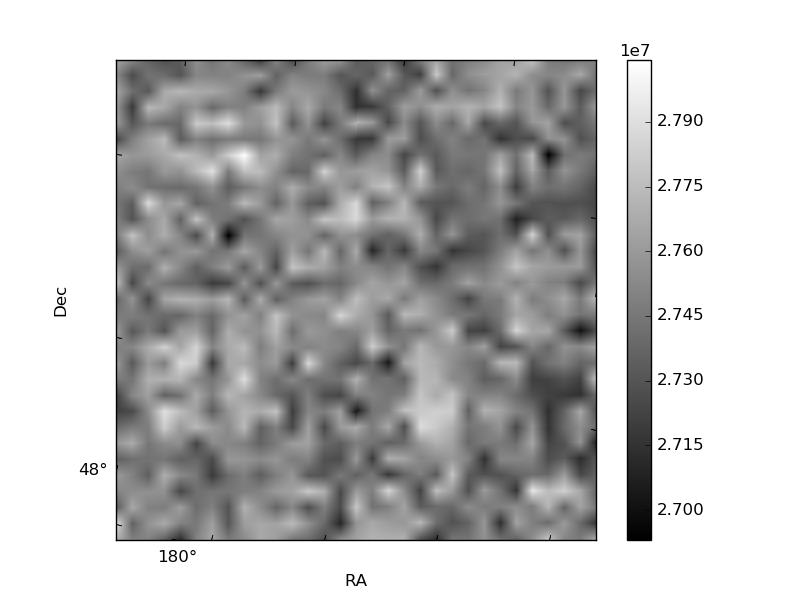
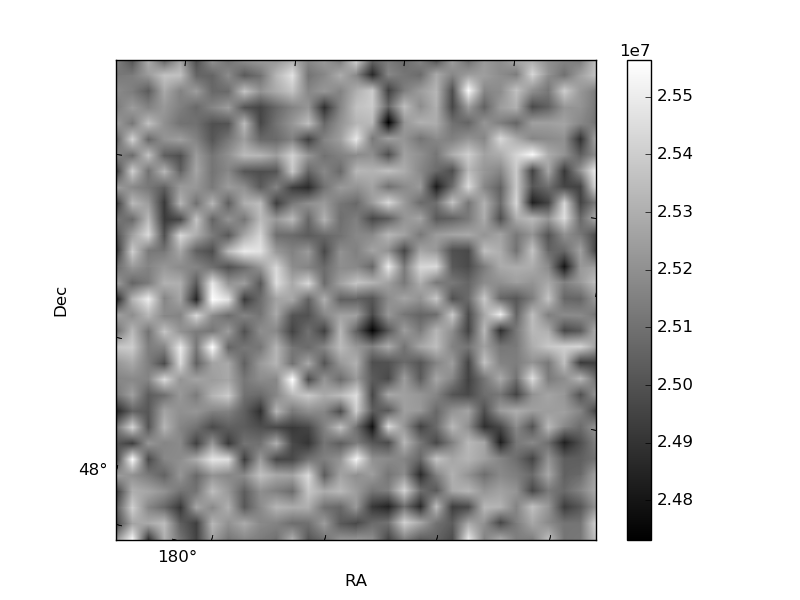
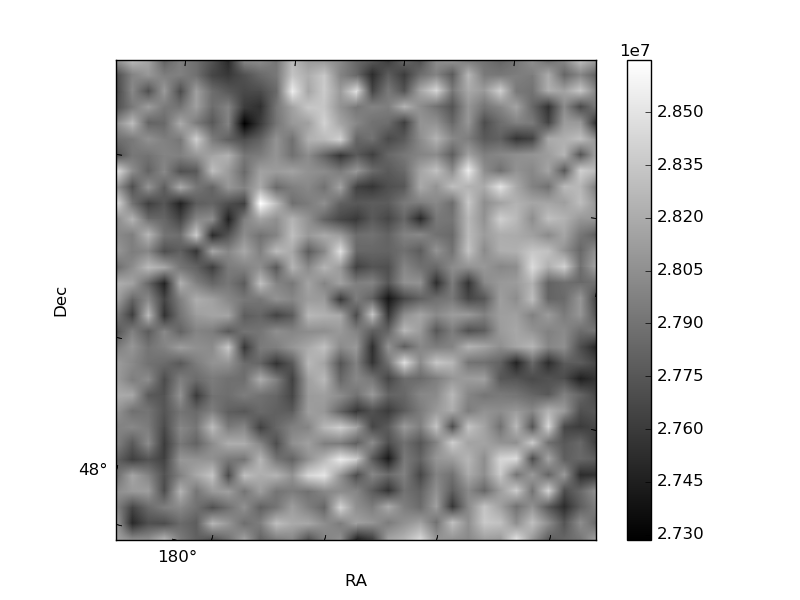
Histogram calculated using DETX and DETY for each event in the final _common_clean file
| Quadrant A | 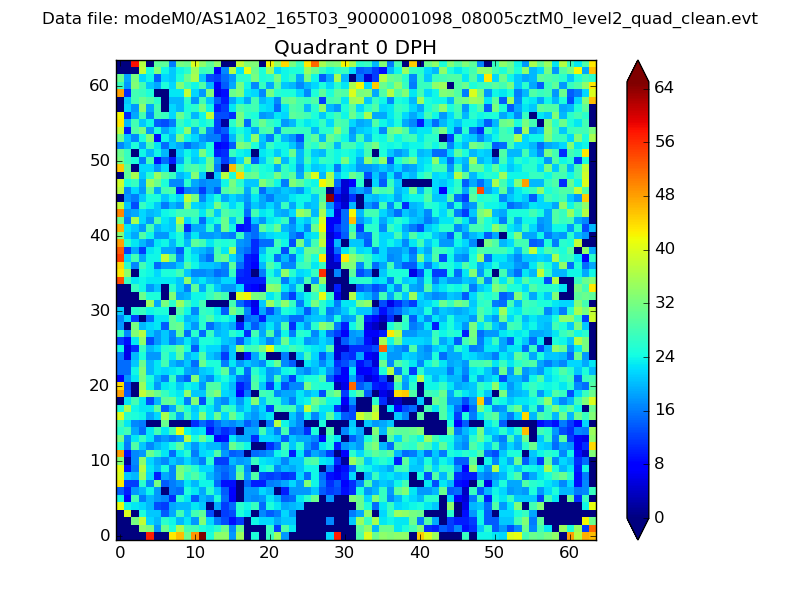 |
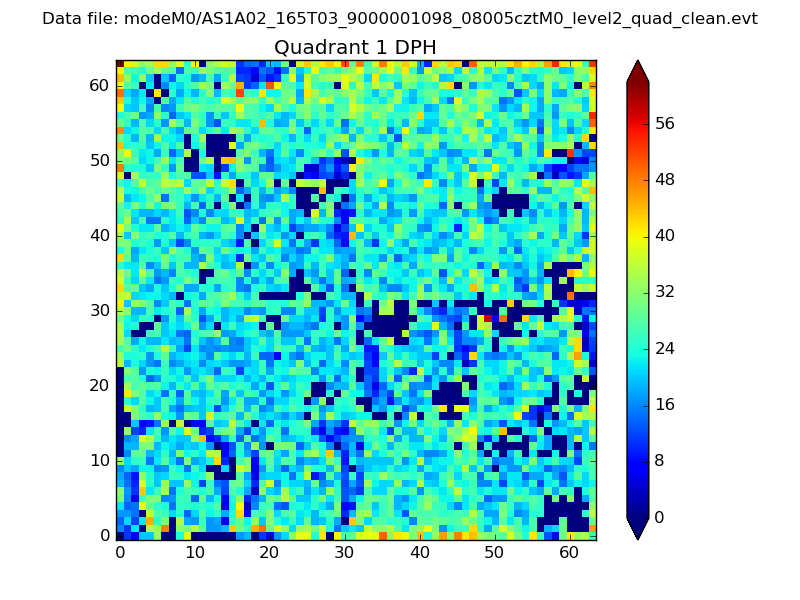 |
Quadrant B |
|---|---|---|---|
| Quadrant D | 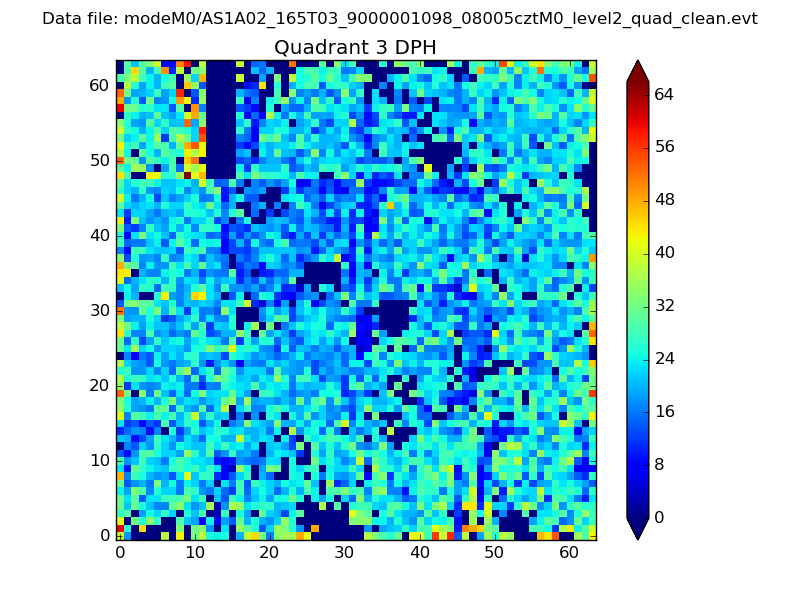 |
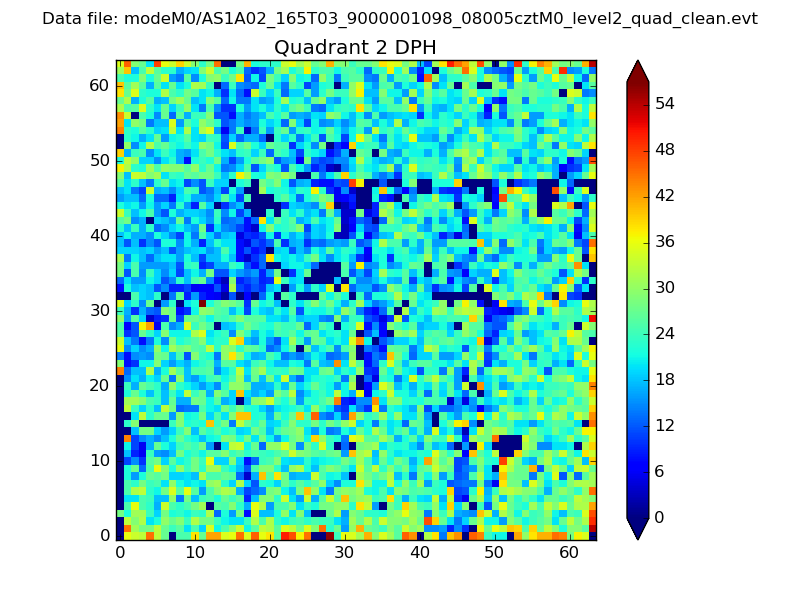 |
Quadrant C |
| Plot type | Count rate plots | Images |
|---|---|---|
| Comparison with Poisson distribution Blue bars denote a histogram of data divided into 1 sec bins. Red curve is a Poisson curve with rate = median count rate of data. |
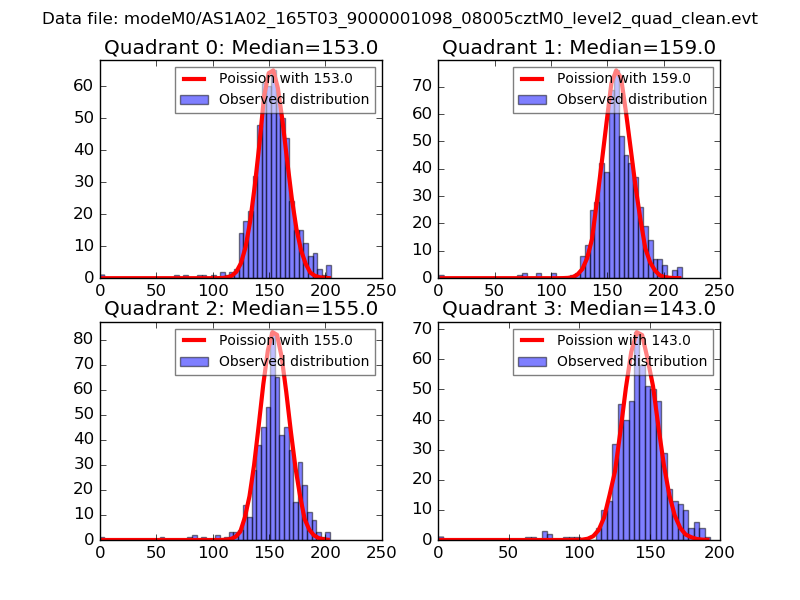 |
 |
| Quadrant-wise count rates Data is divided into 100 sec bins |
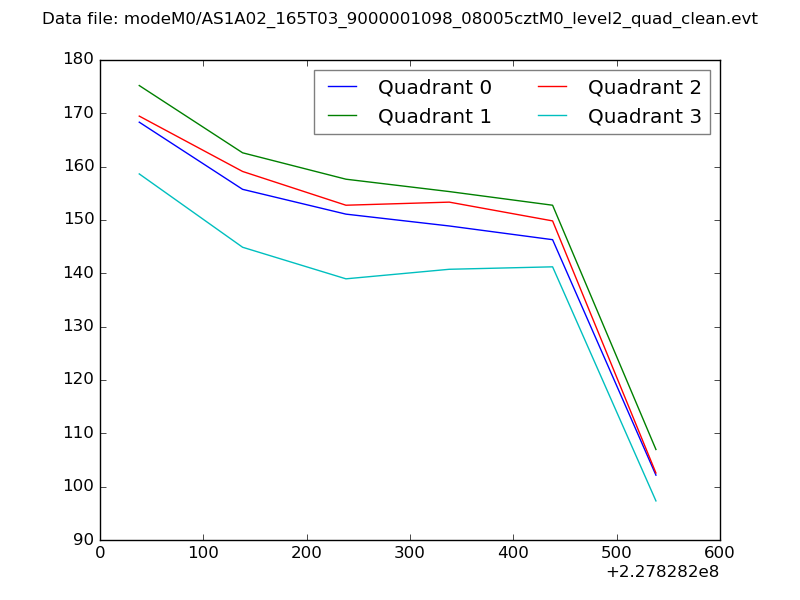 |
|
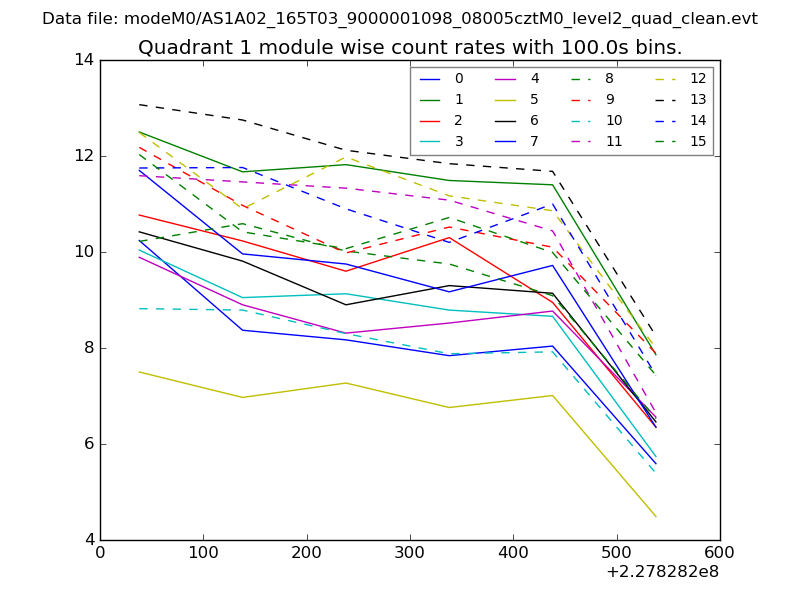
| Module-wise count rates for Quadrant A Data is divided into 100 sec bins |
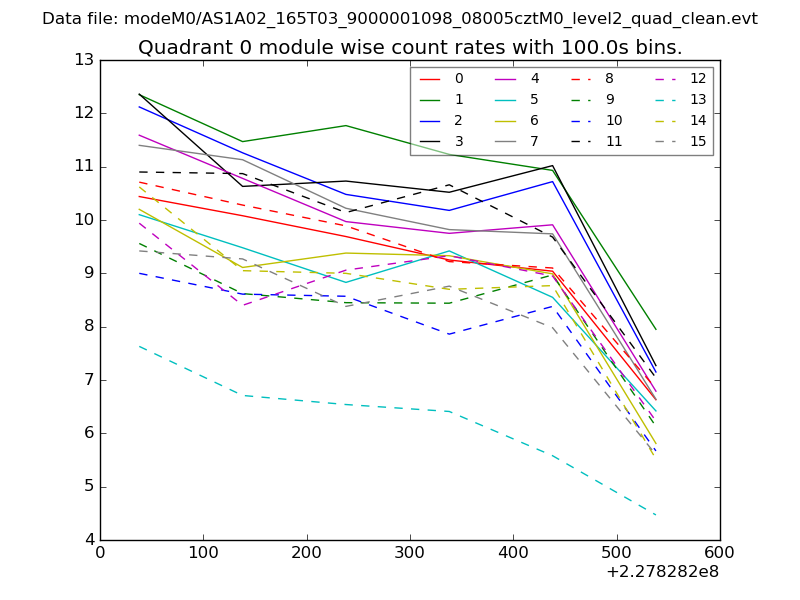 |
 |
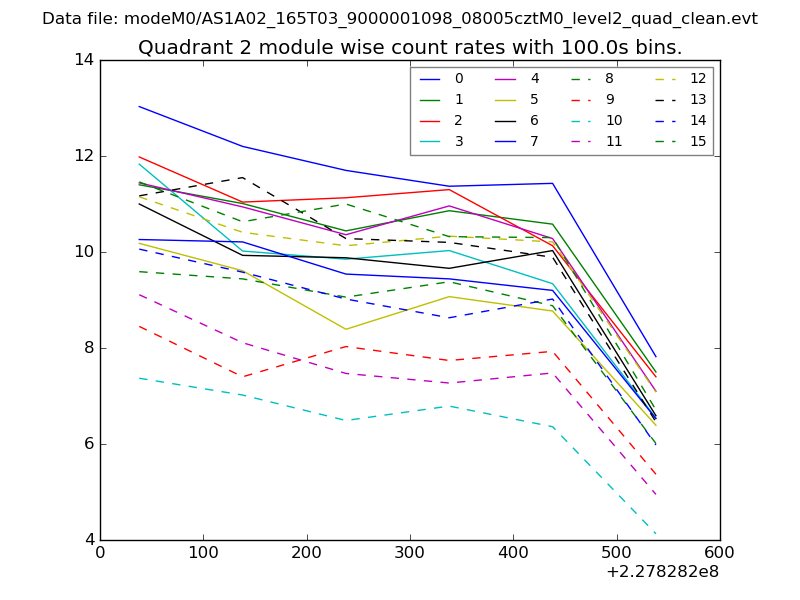
| Module-wise count rates for Quadrant B Data is divided into 100 sec bins |
 |
 |
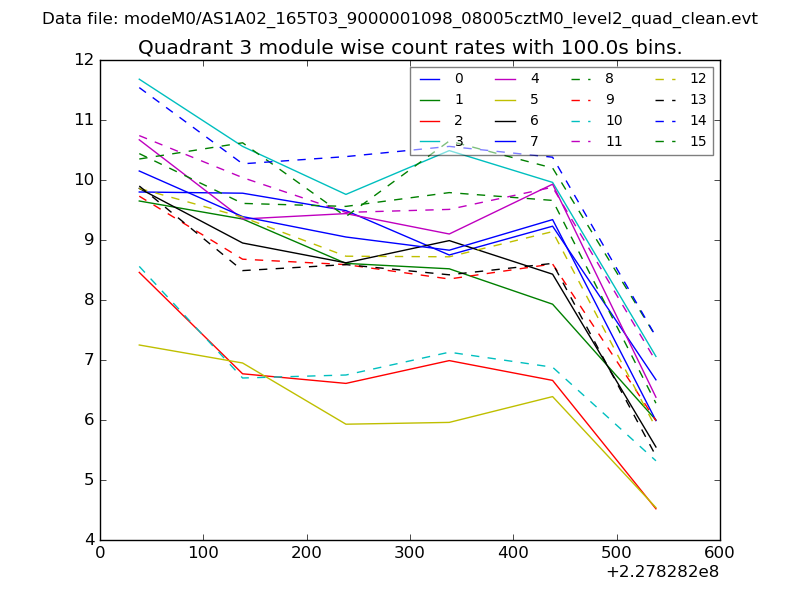
| Module-wise count rates for Quadrant C Data is divided into 100 sec bins |
 |
 |
| Module-wise count rates for Quadrant D Data is divided into 100 sec bins |
 |
 |
| Parameter | Plot |
|---|---|
| CZT HV Monitor | 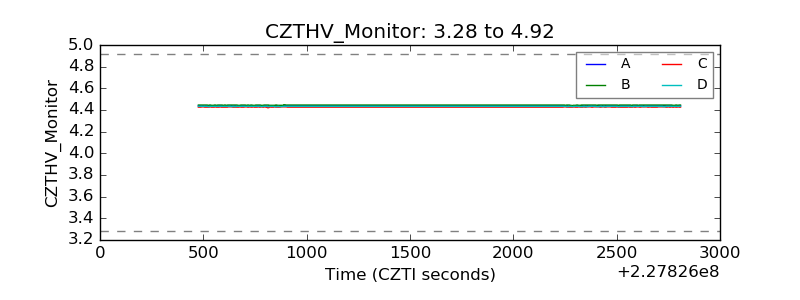 |
| D_VDD | 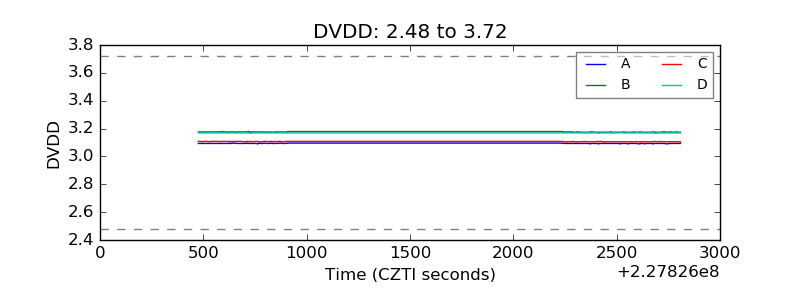 |
| Temperature 1 | 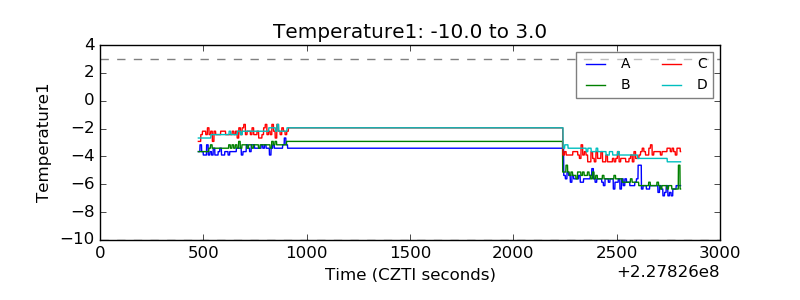 |
| Veto HV Monitor | 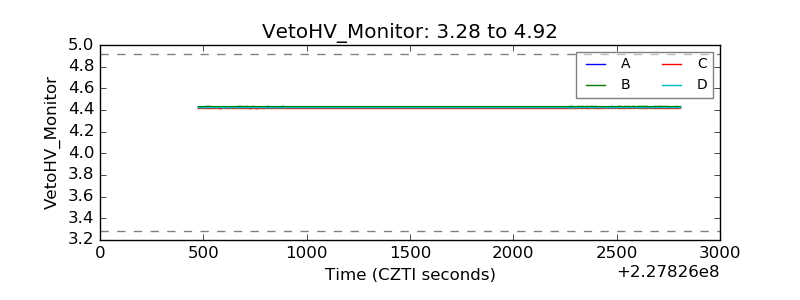 |
| Veto LLD | 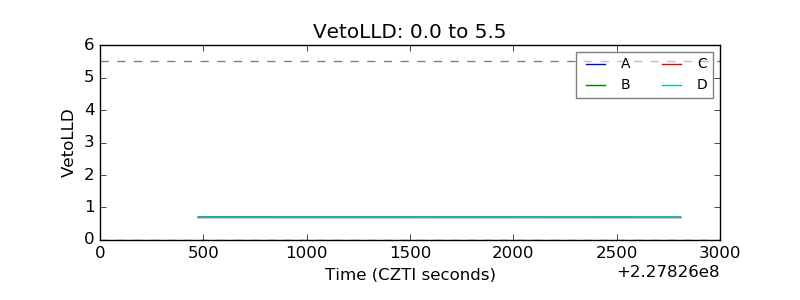 |
| Alpha Counter | 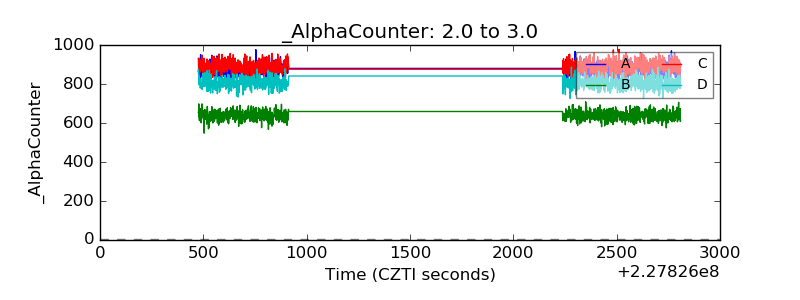 |
| _CPM_Rate | 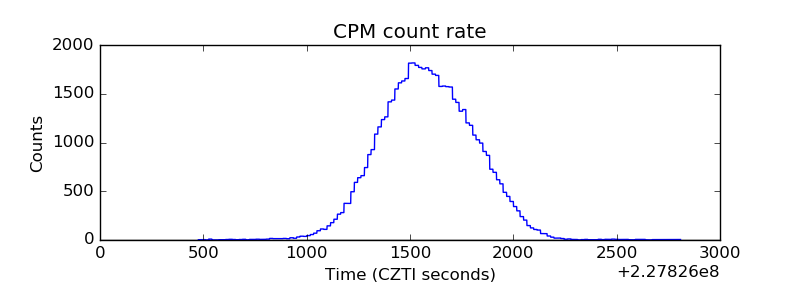 |
| CZT Counter | 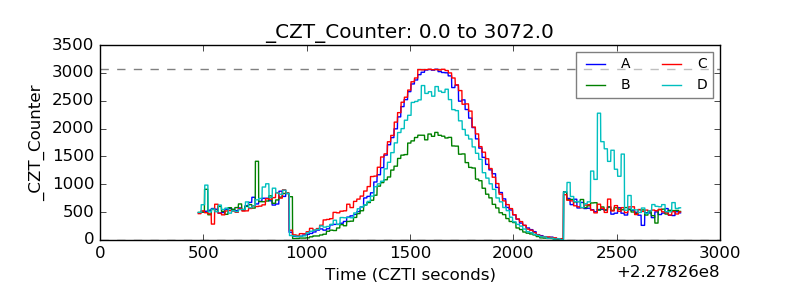 |
| +2.5 Volts monitor |  |
| +5 Volts monitor |  |
| _ROLL_ROT | 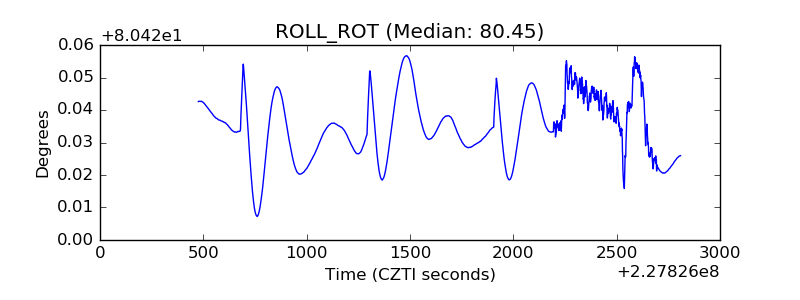 |
| _Roll_DEC | 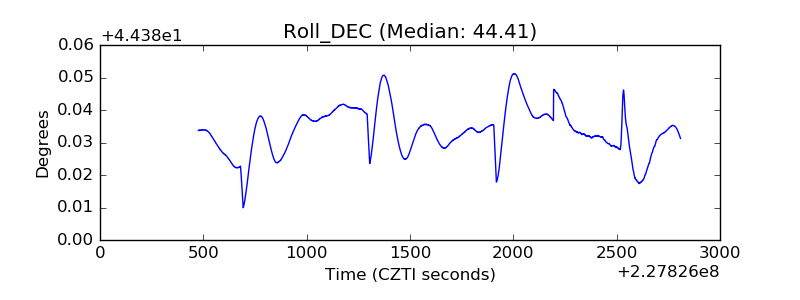 |
| _Roll_RA | 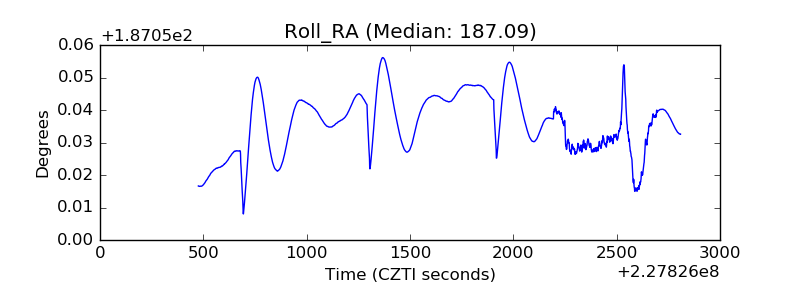 |
| Veto Counter | 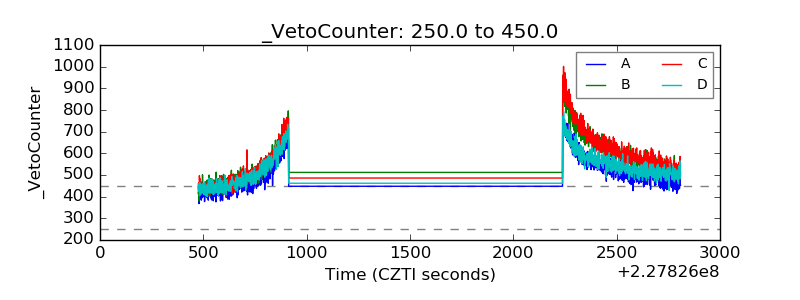 |