| Param | Original file | Final file |
|---|---|---|
| Filename | modeM0/AS1G06_138T03_9000001096cztM0_level2.fits | modeM0/AS1G06_138T03_9000001096cztM0_level2_quad_clean.evt |
| Size (bytes) | 483,566,400 | 503,991,360 |
| Size | 461.2 MB | 480.6 MB |
| Events in quadrant A | 2,884,620 | 3,017,070 |
| Events in quadrant B | 2,817,028 | 3,056,572 |
| Events in quadrant C | 2,896,096 | 2,943,464 |
| Events in quadrant D | 2,456,074 | 2,656,963 |
| Mode M0 | |||
|---|---|---|---|
| Quadrant | BADHDUFLAG | Total packets | Discarded packets |
| A | 0 | 107989 | 0 |
| B | 0 | 109615 | 0 |
| C | 0 | 110735 | 0 |
| D | 0 | 132714 | 0 |
| Mode SS | |||
|---|---|---|---|
| Quadrant | BADHDUFLAG | Total packets | Discarded packets |
| A | 0 | 1064 | 0 |
| B | 0 | 1064 | 0 |
| C | 0 | 1064 | 0 |
| D | 0 | 1064 | 0 |
| Mode M9 | |||
|---|---|---|---|
| Quadrant | BADHDUFLAG | Total packets | Discarded packets |
| A | 0 | 68 | 0 |
| B | 0 | 68 | 0 |
| C | 0 | 68 | 0 |
| D | 0 | 68 | 0 |
| Quadrant | Total seconds | Saturated seconds | Saturation percentage |
|---|---|---|---|
| A | 52329 | 818 | 1.563187% |
| B | 52325 | 943 | 1.802198% |
| C | 52321 | 601 | 1.148678% |
| D | 52327 | 2649 | 5.062396% |
Noise dominated data is calculated using 1-second bins in cleaned event files. If a bin has >2000 counts, and if more than 50% of those come from <1% of pixels, then it is considered to be noise-dominated and hence unusable.
| Quadrant | # 1 sec bins | Bins with >0 counts | Bins with >2000 counts | High rate bins dominated by noise | Noise dominated (total time) | Noise dominated (detector-on time) | Marked lightcurve |
|---|---|---|---|---|---|---|---|
| A | 59012 | 52331 | 0 | 0 | 0.00% | 0.00% |  |
| B | 59012 | 52332 | 0 | 0 | 0.00% | 0.00% | 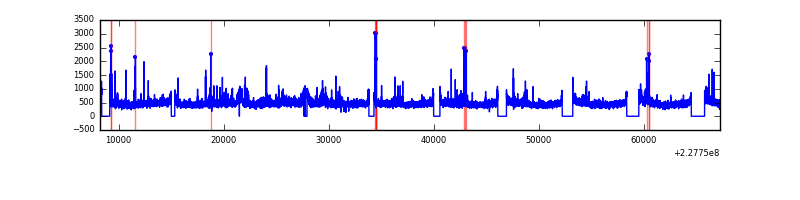 |
| C | 59012 | 52330 | 0 | 0 | 0.00% | 0.00% |  |
| D | 59012 | 52290 | 0 | 0 | 0.00% | 0.00% |  |
Top three noisy pixels from each quadrant. If the there are fewer than three noisy pixels in the level2.evt file, extra rows are filled as -1
| Pixel properties | Quadrant properties | ||||||
|---|---|---|---|---|---|---|---|
| Quadrant | DetID | PixID | Counts | Sigma | Mean | Median | Sigma |
| A | 0 | 29 | 2724 | 10.52 | 749 | 695 | 192.9 |
| A | 7 | 110 | 2463 | 9.16 | 749 | 695 | 192.9 |
| A | 0 | 30 | 2149 | 7.54 | 749 | 695 | 192.9 |
| B | 2 | 9 | 2438 | 11.51 | 741 | 700 | 151.0 |
| B | 3 | 17 | 1967 | 8.39 | 741 | 700 | 151.0 |
| B | 14 | 254 | 1856 | 7.66 | 741 | 700 | 151.0 |
| C | 12 | 241 | 2164 | 7.25 | 764 | 706 | 201.0 |
| C | 1 | 80 | 2141 | 7.14 | 764 | 706 | 201.0 |
| C | 1 | 81 | 2090 | 6.88 | 764 | 706 | 201.0 |
| D | 3 | 14 | 1860 | 6.54 | 699 | 633 | 187.5 |
| D | 3 | 31 | 1829 | 6.38 | 699 | 633 | 187.5 |
| D | 6 | 231 | 1788 | 6.16 | 699 | 633 | 187.5 |
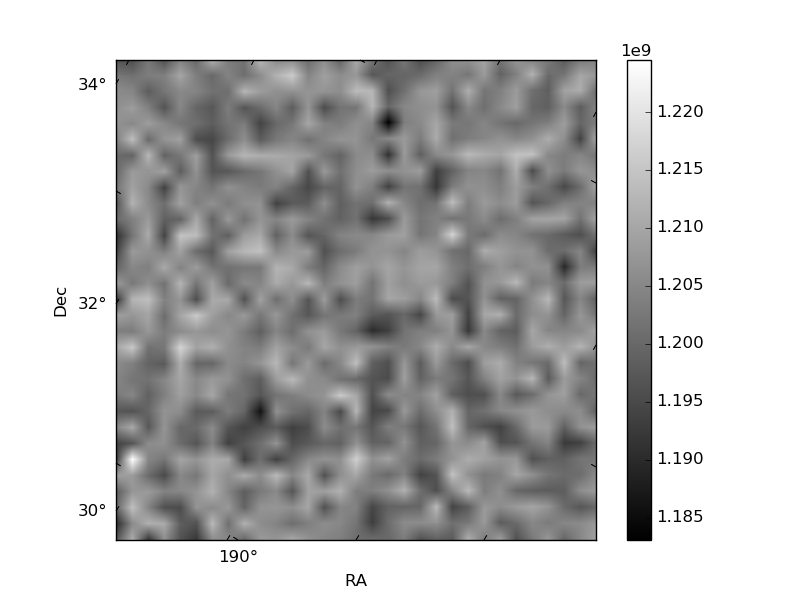
Histogram calculated using DETX and DETY for each event in the final _common_clean file
| Quadrant A | 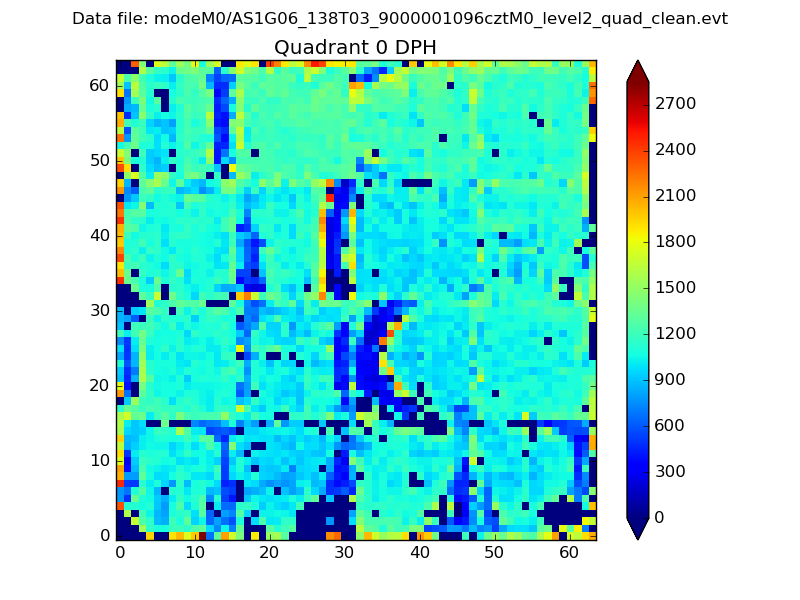 |
 |
Quadrant B |
|---|---|---|---|
| Quadrant D |  |
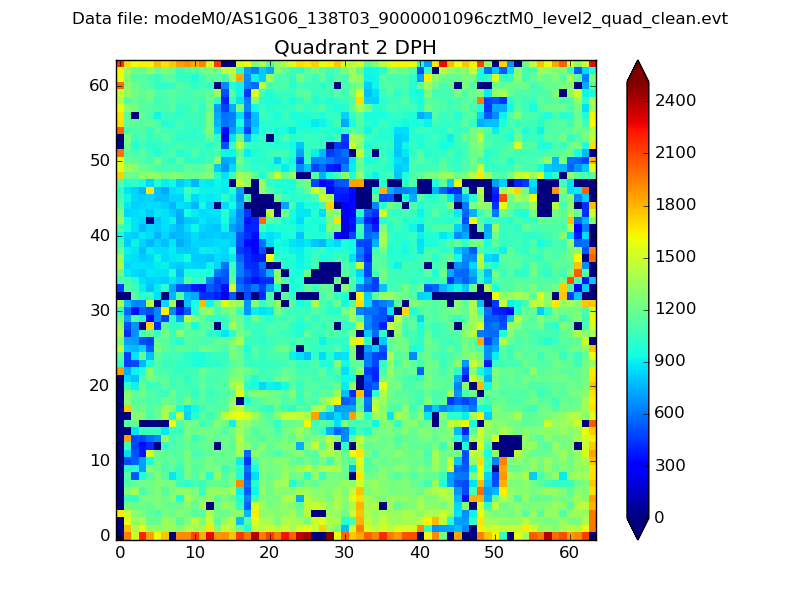 |
Quadrant C |
| Plot type | Count rate plots | Images |
|---|---|---|
| Comparison with Poisson distribution Blue bars denote a histogram of data divided into 1 sec bins. Red curve is a Poisson curve with rate = median count rate of data. |
 |
 |
| Quadrant-wise count rates Data is divided into 100 sec bins |
 |
|
| Module-wise count rates for Quadrant A Data is divided into 100 sec bins |
 |
 |
| Module-wise count rates for Quadrant B Data is divided into 100 sec bins |
 |
 |
| Module-wise count rates for Quadrant C Data is divided into 100 sec bins |
 |
 |
| Module-wise count rates for Quadrant D Data is divided into 100 sec bins |
 |
 |
| Parameter | Plot |
|---|---|
| CZT HV Monitor | 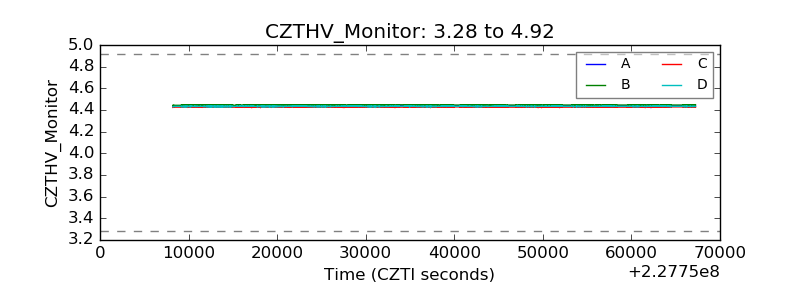 |
| D_VDD |  |
| Temperature 1 | 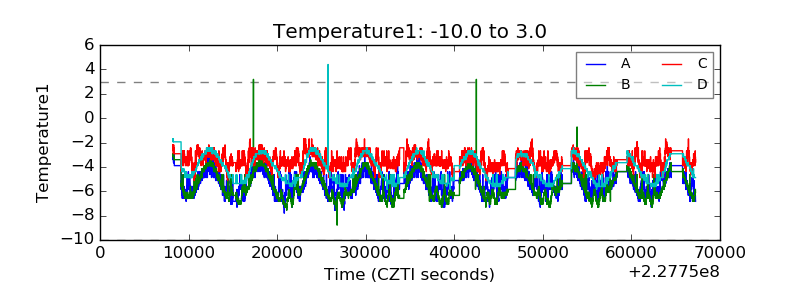 |
| Veto HV Monitor |  |
| Veto LLD |  |
| Alpha Counter |  |
| _CPM_Rate | 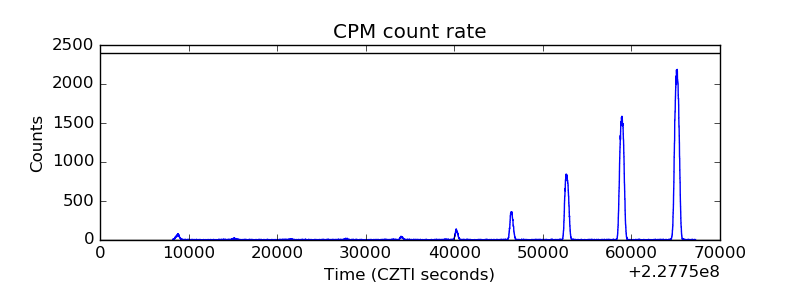 |
| CZT Counter |  |
| +2.5 Volts monitor |  |
| +5 Volts monitor |  |
| _ROLL_ROT |  |
| _Roll_DEC |  |
| _Roll_RA |  |
| Veto Counter |  |