| Param | Original file | Final file |
|---|---|---|
| Filename | modeM0/AS1G06_138T03_9000001096_07994cztM0_level2.evt | modeM0/AS1G06_138T03_9000001096_07994cztM0_level2_quad_clean.evt |
| Size (bytes) | 512,219,520 | 100,195,200 |
| Size | 488.5 MB | 95.6 MB |
| Events in quadrant A | 3,545,272 | 618,359 |
| Events in quadrant B | 3,697,825 | 635,785 |
| Events in quadrant C | 3,727,717 | 639,030 |
| Events in quadrant D | 4,017,649 | 604,307 |
| Mode M0 | |||
|---|---|---|---|
| Quadrant | BADHDUFLAG | Total packets | Discarded packets |
| A | 0 | 15976 | 3 |
| B | 0 | 16194 | 4 |
| C | 0 | 16205 | 2 |
| D | 0 | 17409 | 4 |
| Mode SS | |||
|---|---|---|---|
| Quadrant | BADHDUFLAG | Total packets | Discarded packets |
| A | 0 | 154 | 0 |
| B | 0 | 154 | 0 |
| C | 0 | 154 | 0 |
| D | 0 | 154 | 0 |
| Mode M9 | |||
|---|---|---|---|
| Quadrant | BADHDUFLAG | Total packets | Discarded packets |
| A | 0 | 1 | 0 |
| B | 0 | 1 | 0 |
| C | 0 | 1 | 0 |
| D | 0 | 2 | 0 |
| Quadrant | Total seconds | Saturated seconds | Saturation percentage |
|---|---|---|---|
| A | 7716 | 202 | 2.617937% |
| B | 7715 | 237 | 3.071938% |
| C | 7716 | 101 | 1.308968% |
| D | 7715 | 242 | 3.136747% |
Noise dominated data is calculated using 1-second bins in cleaned event files. If a bin has >2000 counts, and if more than 50% of those come from <1% of pixels, then it is considered to be noise-dominated and hence unusable.
| Quadrant | # 1 sec bins | Bins with >0 counts | Bins with >2000 counts | High rate bins dominated by noise | Noise dominated (total time) | Noise dominated (detector-on time) | Marked lightcurve |
|---|---|---|---|---|---|---|---|
| A | 7731 | 7717 | 0 | 0 | 0.00% | 0.00% | 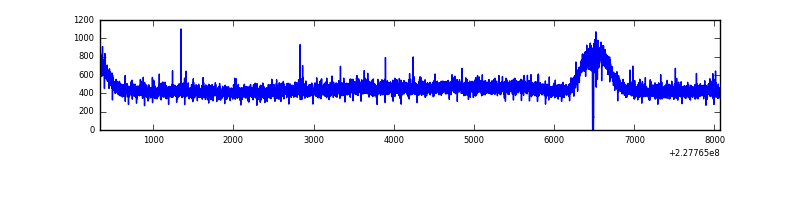 |
| B | 7731 | 7717 | 1 | 1 | 0.01% | 0.01% | 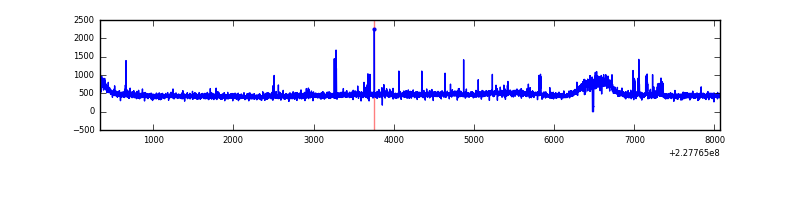 |
| C | 7731 | 7717 | 1 | 1 | 0.01% | 0.01% | 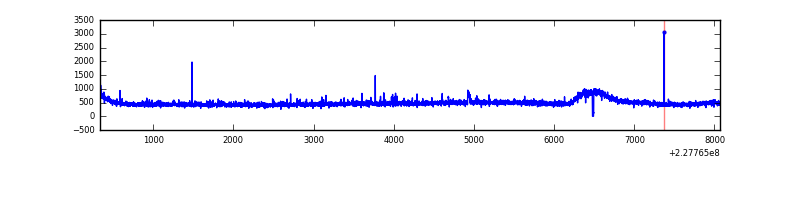 |
| D | 7731 | 7717 | 94 | 94 | 1.22% | 1.22% | 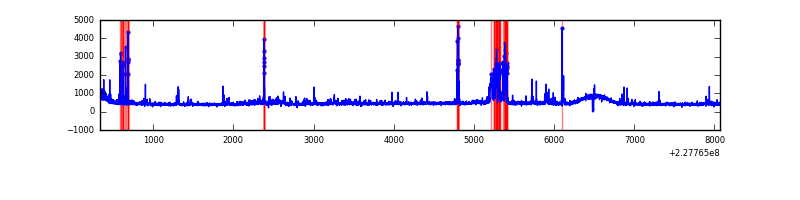 |
Top three noisy pixels from each quadrant. If the there are fewer than three noisy pixels in the level2.evt file, extra rows are filled as -1
| Pixel properties | Quadrant properties | ||||||
|---|---|---|---|---|---|---|---|
| Quadrant | DetID | PixID | Counts | Sigma | Mean | Median | Sigma |
| A | 0 | 226 | 8582 | 40.22 | 919 | 896 | 191.1 |
| A | 13 | 251 | 8477 | 39.67 | 919 | 896 | 191.1 |
| A | 12 | 194 | 7844 | 36.35 | 919 | 896 | 191.1 |
| B | 5 | 255 | 68930 | 378.47 | 922 | 898 | 179.8 |
| B | 12 | 111 | 20530 | 109.22 | 922 | 898 | 179.8 |
| B | 11 | 111 | 16518 | 86.9 | 922 | 898 | 179.8 |
| C | 8 | 208 | 154690 | 735.66 | 898 | 901 | 209.0 |
| C | 1 | 16 | 30352 | 140.88 | 898 | 901 | 209.0 |
| C | 8 | 128 | 16264 | 73.49 | 898 | 901 | 209.0 |
| D | 1 | 52 | 414535 | 1887.54 | 891 | 862 | 219.2 |
| D | 1 | 83 | 108223 | 489.87 | 891 | 862 | 219.2 |
| D | 2 | 14 | 83193 | 375.67 | 891 | 862 | 219.2 |
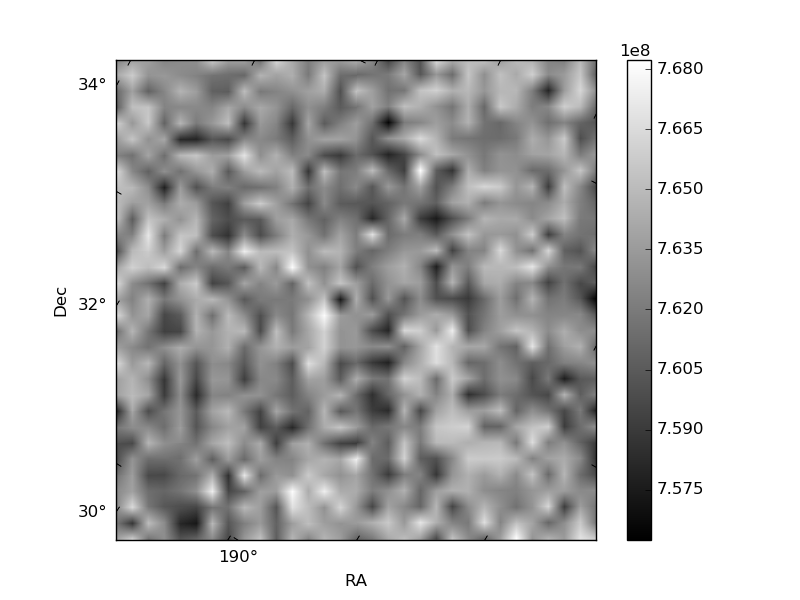
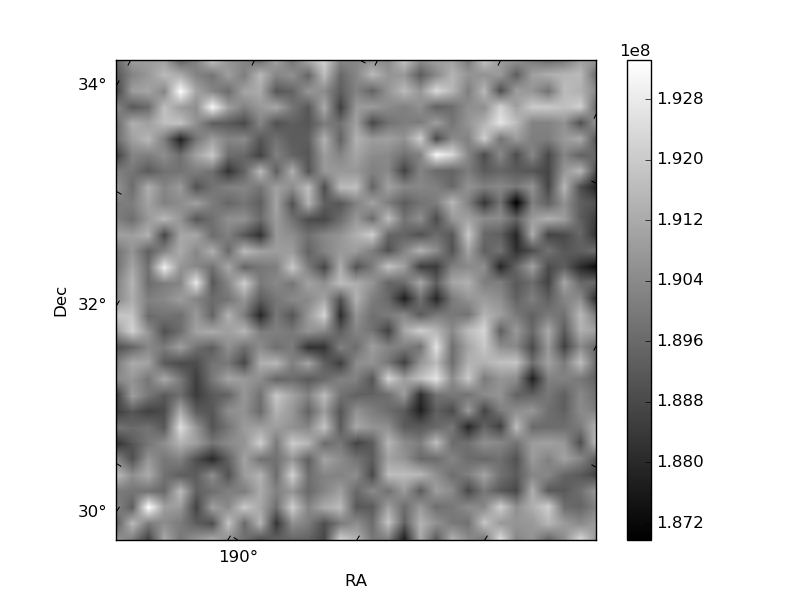
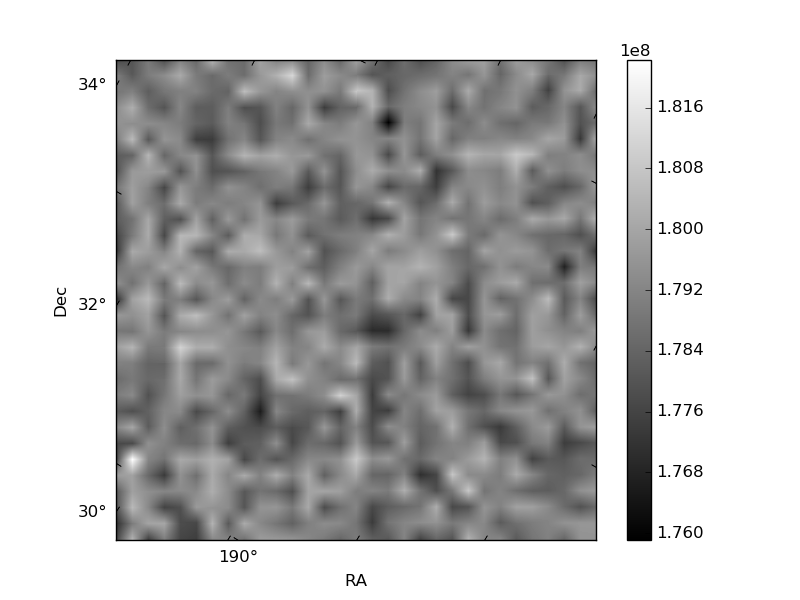
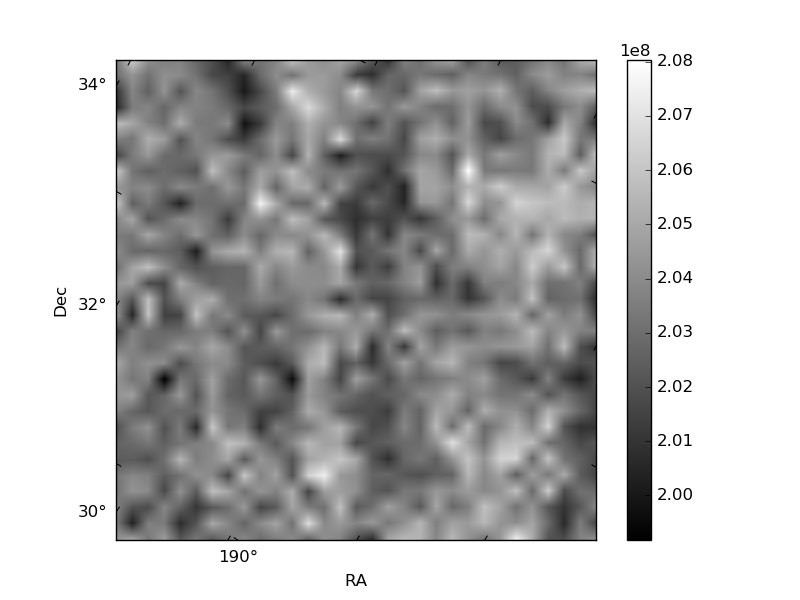
Histogram calculated using DETX and DETY for each event in the final _common_clean file
| Quadrant A | 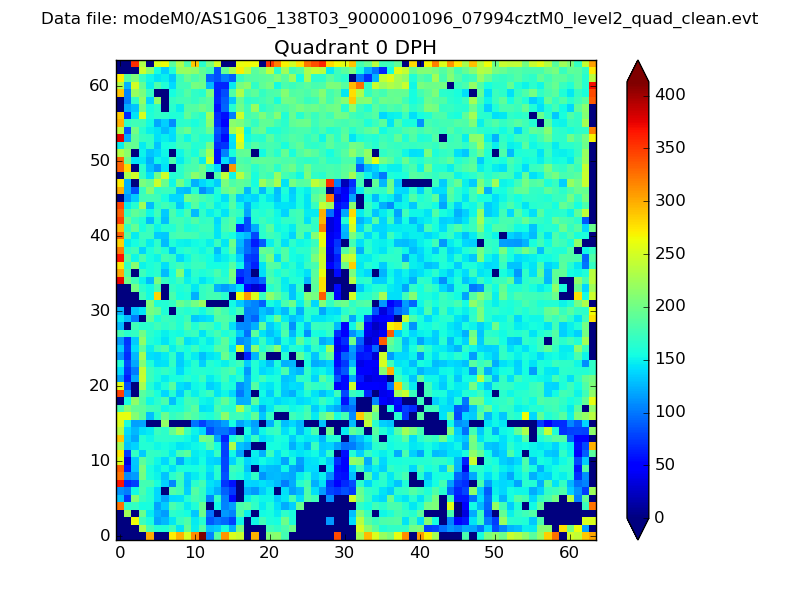 |
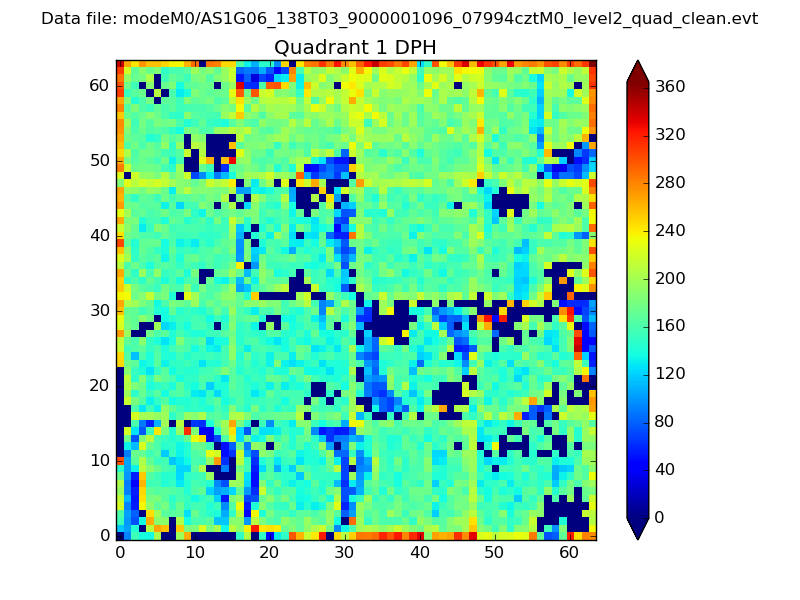 |
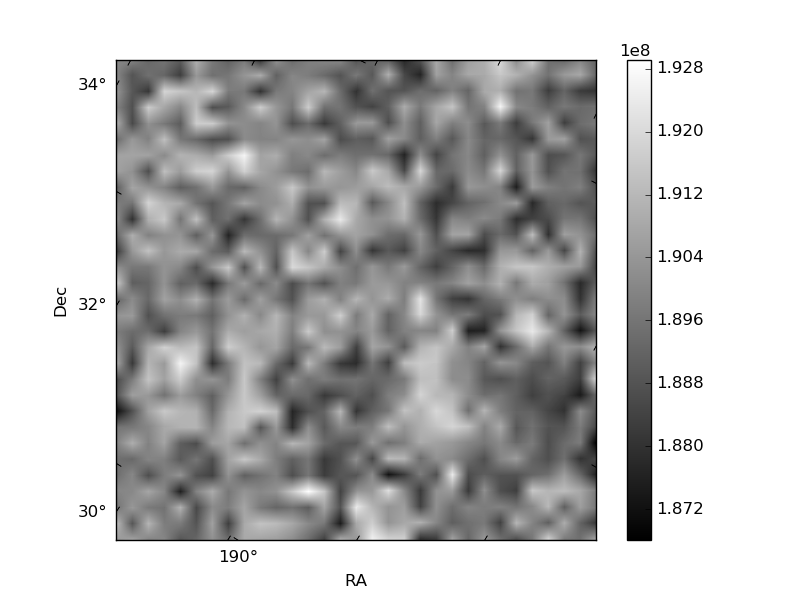
Quadrant B |
|---|---|---|---|
| Quadrant D | 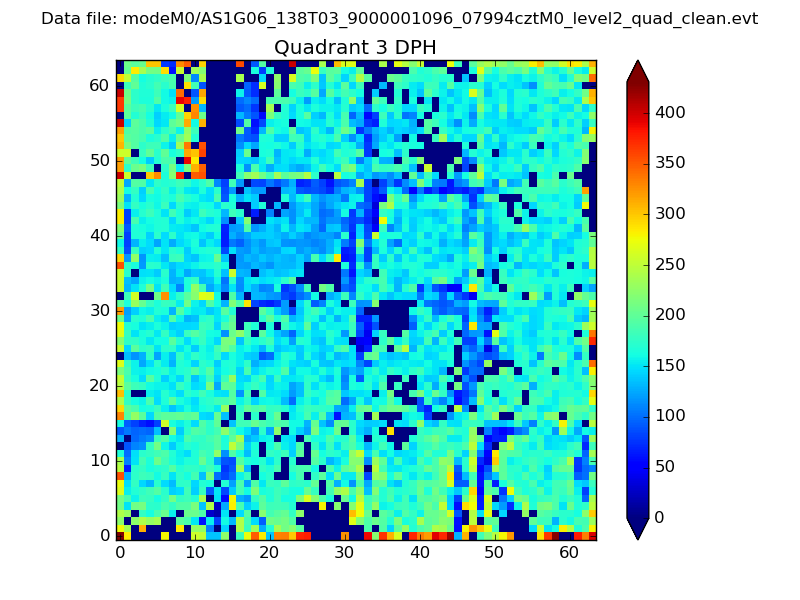 |
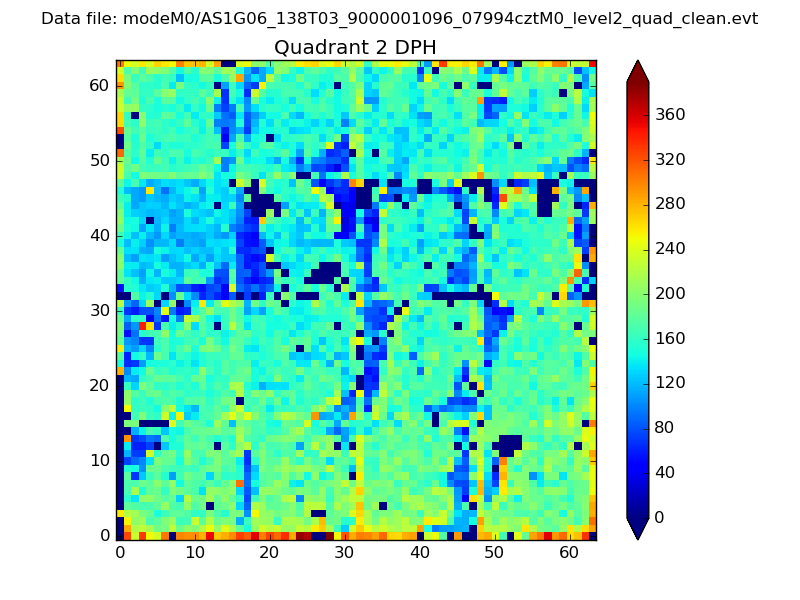 |
Quadrant C |
| Plot type | Count rate plots | Images |
|---|---|---|
| Comparison with Poisson distribution Blue bars denote a histogram of data divided into 1 sec bins. Red curve is a Poisson curve with rate = median count rate of data. |
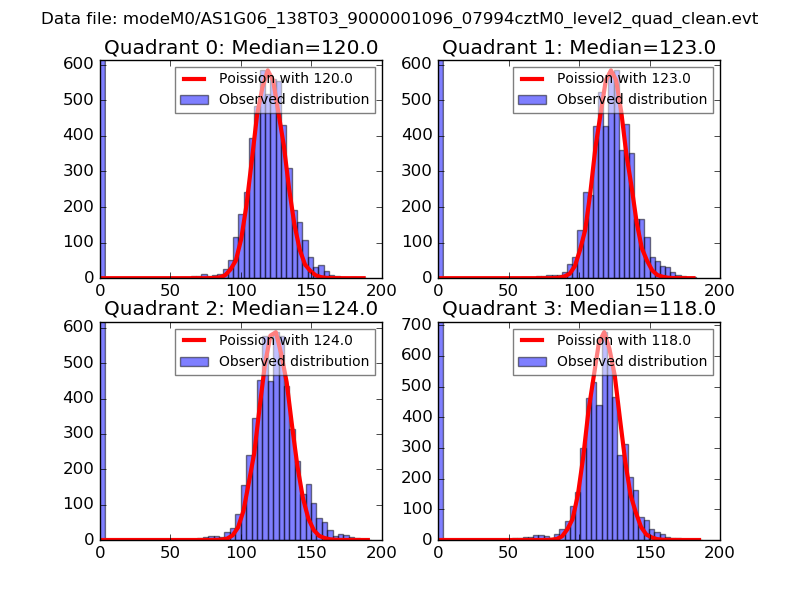 |
 |
| Quadrant-wise count rates Data is divided into 100 sec bins |
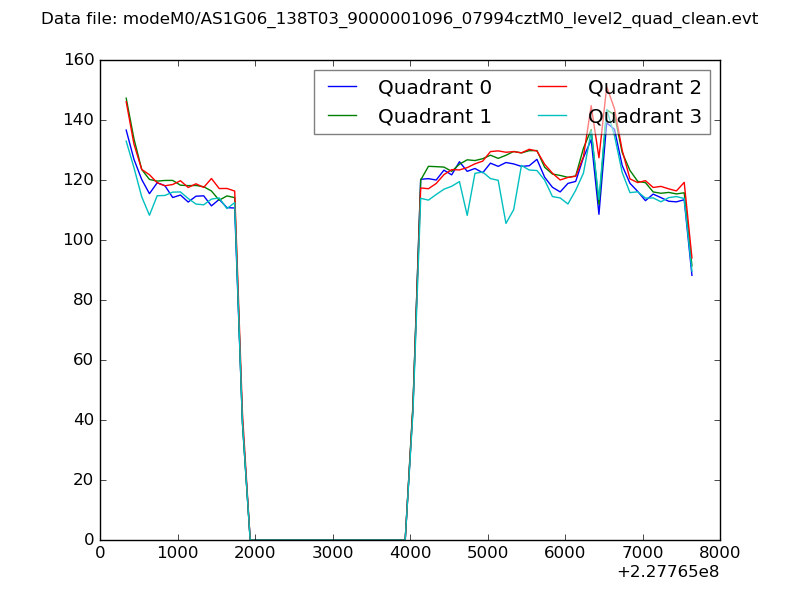 |
|
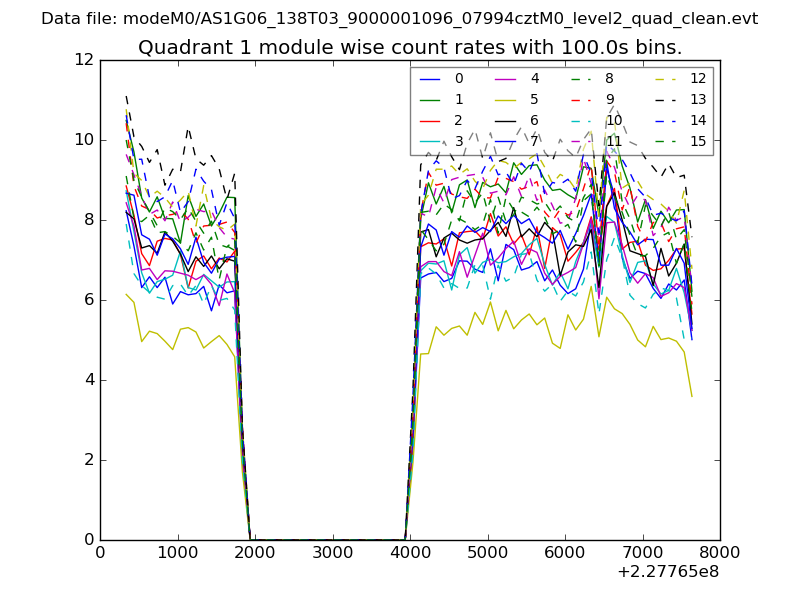
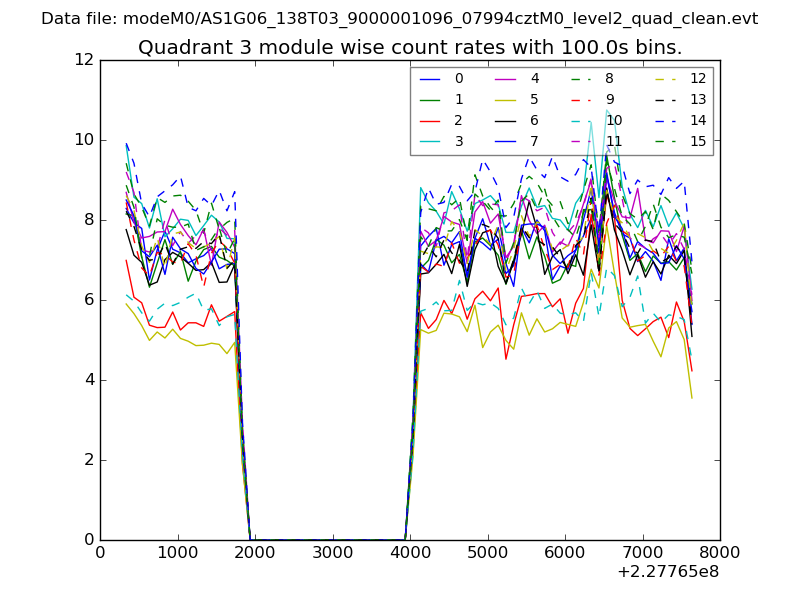
| Module-wise count rates for Quadrant A Data is divided into 100 sec bins |
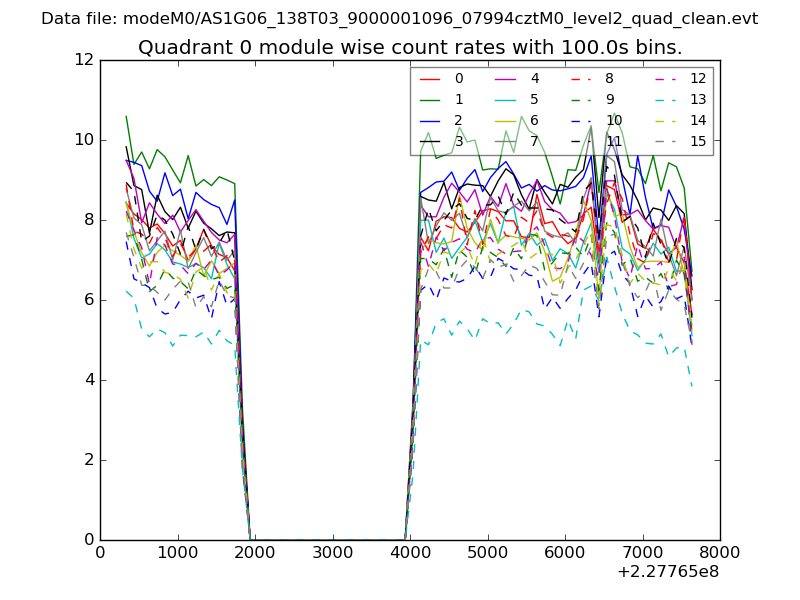 |
 |
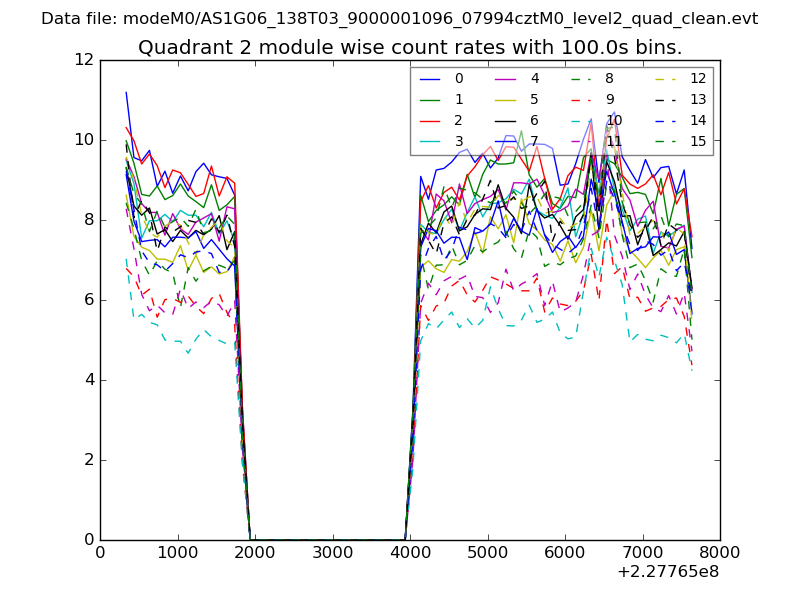
| Module-wise count rates for Quadrant B Data is divided into 100 sec bins |
 |
 |
| Module-wise count rates for Quadrant C Data is divided into 100 sec bins |
 |
 |
| Module-wise count rates for Quadrant D Data is divided into 100 sec bins |
 |
 |
| Parameter | Plot |
|---|---|
| CZT HV Monitor | 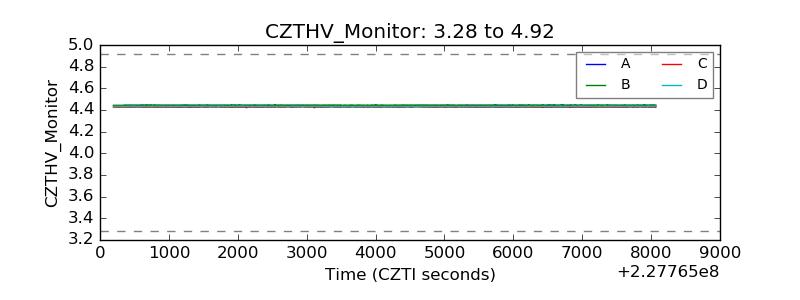 |
| D_VDD | 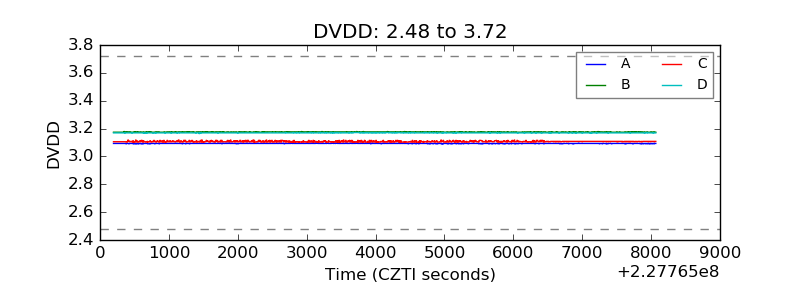 |
| Temperature 1 | 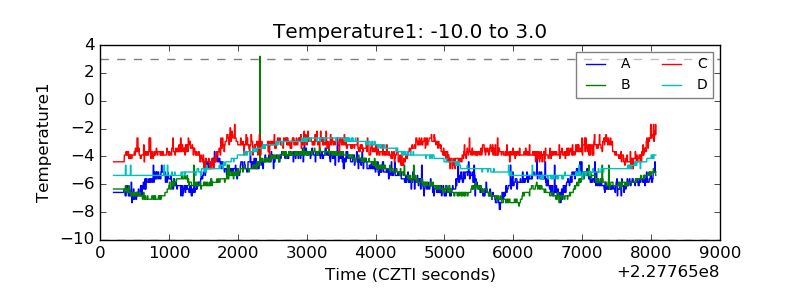 |
| Veto HV Monitor | 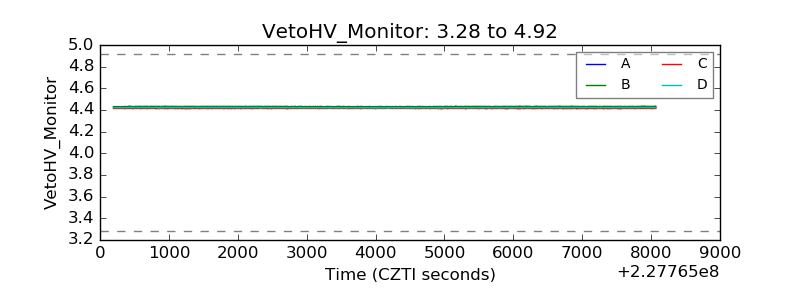 |
| Veto LLD | 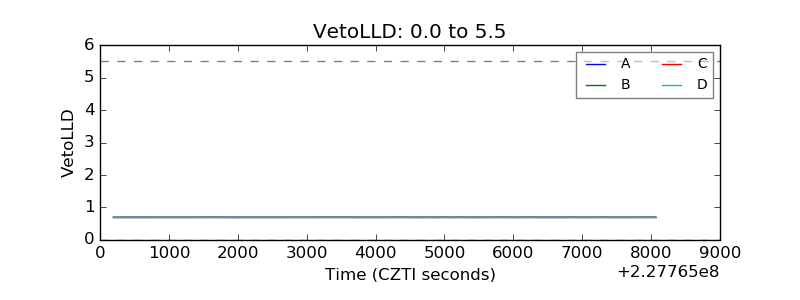 |
| Alpha Counter | 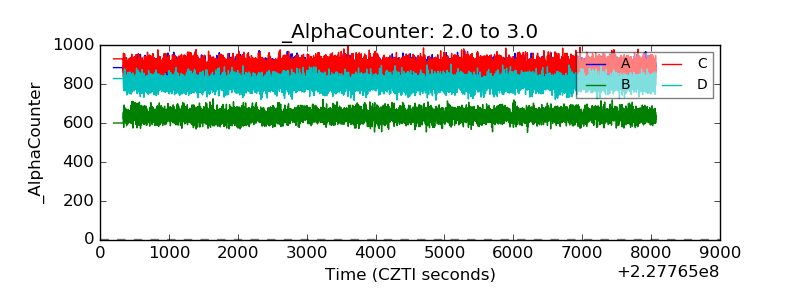 |
| _CPM_Rate | 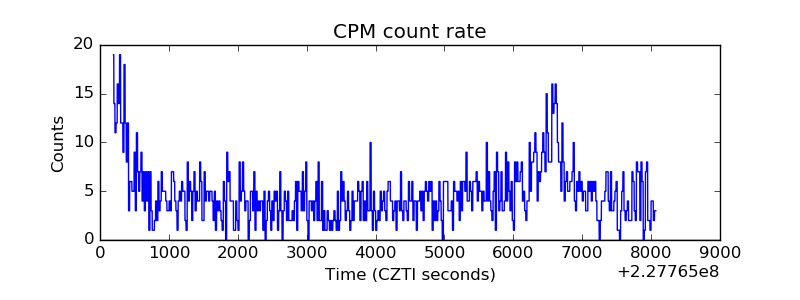 |
| CZT Counter | 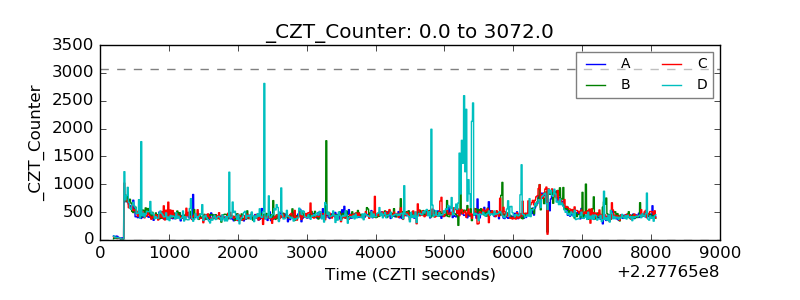 |
| +2.5 Volts monitor |  |
| +5 Volts monitor |  |
| _ROLL_ROT | 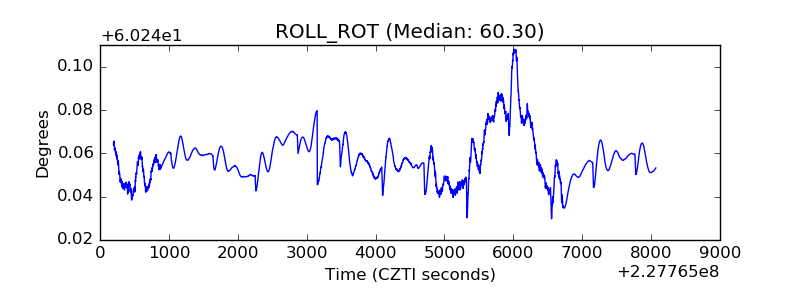 |
| _Roll_DEC | 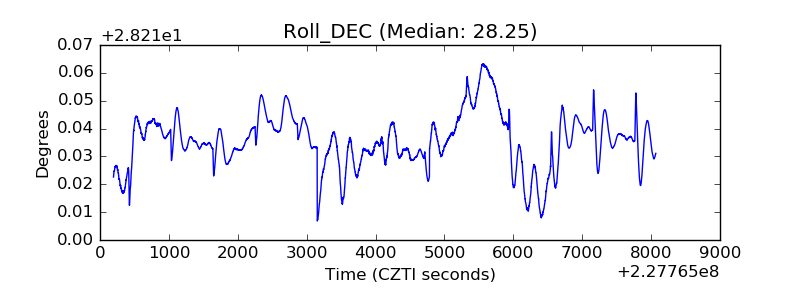 |
| _Roll_RA | 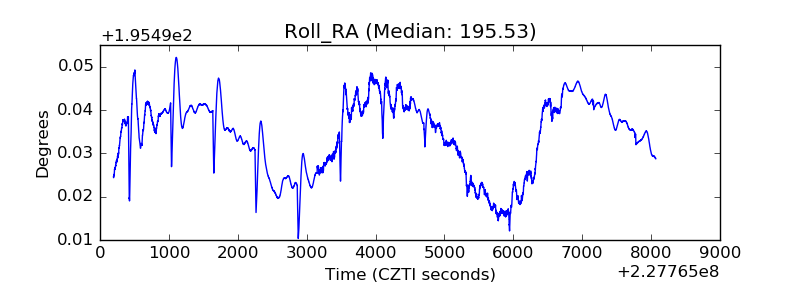 |
| Veto Counter | 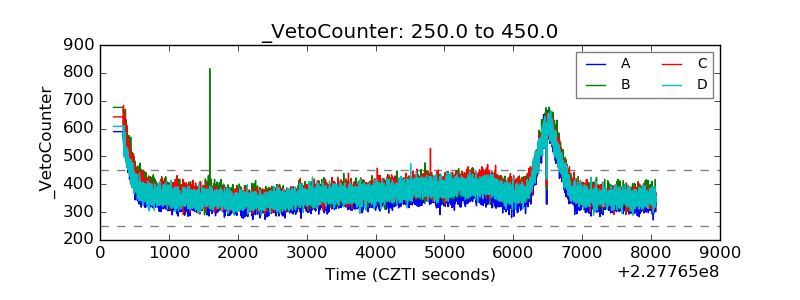 |