| Param | Original file | Final file |
|---|---|---|
| Filename | modeM0/AS1G06_138T03_9000001096_07995cztM0_level2.evt | modeM0/AS1G06_138T03_9000001096_07995cztM0_level2_quad_clean.evt |
| Size (bytes) | 636,537,600 | 99,457,920 |
| Size | 607.0 MB | 94.9 MB |
| Events in quadrant A | 3,840,394 | 609,326 |
| Events in quadrant B | 4,208,582 | 625,116 |
| Events in quadrant C | 4,607,685 | 625,269 |
| Events in quadrant D | 6,063,380 | 580,608 |
| Mode M0 | |||
|---|---|---|---|
| Quadrant | BADHDUFLAG | Total packets | Discarded packets |
| A | 0 | 17181 | 3 |
| B | 0 | 17795 | 2 |
| C | 0 | 19333 | 5 |
| D | 0 | 23724 | 2 |
| Mode SS | |||
|---|---|---|---|
| Quadrant | BADHDUFLAG | Total packets | Discarded packets |
| A | 0 | 168 | 0 |
| B | 0 | 168 | 0 |
| C | 0 | 168 | 0 |
| D | 0 | 168 | 0 |
| Mode M9 | |||
|---|---|---|---|
| Quadrant | BADHDUFLAG | Total packets | Discarded packets |
| A | 0 | 3 | 0 |
| B | 0 | 3 | 0 |
| C | 0 | 3 | 0 |
| D | 0 | 3 | 0 |
| Quadrant | Total seconds | Saturated seconds | Saturation percentage |
|---|---|---|---|
| A | 8219 | 327 | 3.978586% |
| B | 8219 | 367 | 4.465263% |
| C | 8218 | 191 | 2.324166% |
| D | 8219 | 915 | 11.132741% |
Noise dominated data is calculated using 1-second bins in cleaned event files. If a bin has >2000 counts, and if more than 50% of those come from <1% of pixels, then it is considered to be noise-dominated and hence unusable.
| Quadrant | # 1 sec bins | Bins with >0 counts | Bins with >2000 counts | High rate bins dominated by noise | Noise dominated (total time) | Noise dominated (detector-on time) | Marked lightcurve |
|---|---|---|---|---|---|---|---|
| A | 8449 | 8223 | 0 | 0 | 0.00% | 0.00% |  |
| B | 8449 | 8223 | 0 | 0 | 0.00% | 0.00% | 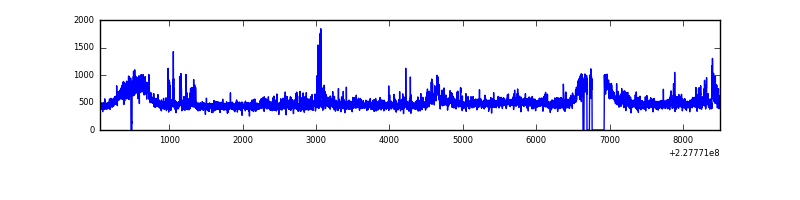 |
| C | 8449 | 8223 | 1 | 1 | 0.01% | 0.01% | 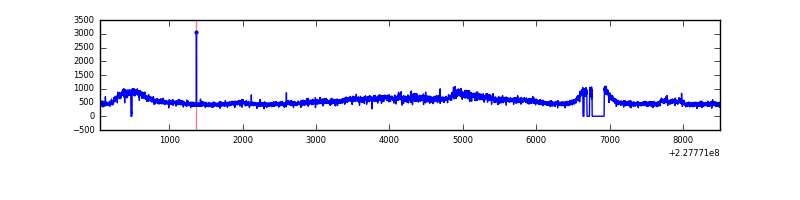 |
| D | 8449 | 8223 | 677 | 677 | 8.01% | 8.23% |  |
Top three noisy pixels from each quadrant. If the there are fewer than three noisy pixels in the level2.evt file, extra rows are filled as -1
| Pixel properties | Quadrant properties | ||||||
|---|---|---|---|---|---|---|---|
| Quadrant | DetID | PixID | Counts | Sigma | Mean | Median | Sigma |
| A | 0 | 226 | 9278 | 40.25 | 996 | 971 | 206.4 |
| A | 12 | 194 | 8668 | 37.3 | 996 | 971 | 206.4 |
| A | 0 | 128 | 5147 | 20.24 | 996 | 971 | 206.4 |
| B | 5 | 255 | 303240 | 1532.78 | 998 | 972 | 197.2 |
| B | 12 | 111 | 22354 | 108.43 | 998 | 972 | 197.2 |
| B | 11 | 111 | 18207 | 87.4 | 998 | 972 | 197.2 |
| C | 8 | 208 | 794233 | 3487.5 | 972 | 976 | 227.5 |
| C | 1 | 16 | 7441 | 28.42 | 972 | 976 | 227.5 |
| C | 13 | 61 | 7347 | 28.01 | 972 | 976 | 227.5 |
| D | 1 | 52 | 2286326 | 8969.01 | 934 | 911 | 254.8 |
| D | 1 | 83 | 98689 | 383.73 | 934 | 911 | 254.8 |
| D | 2 | 14 | 43968 | 168.98 | 934 | 911 | 254.8 |
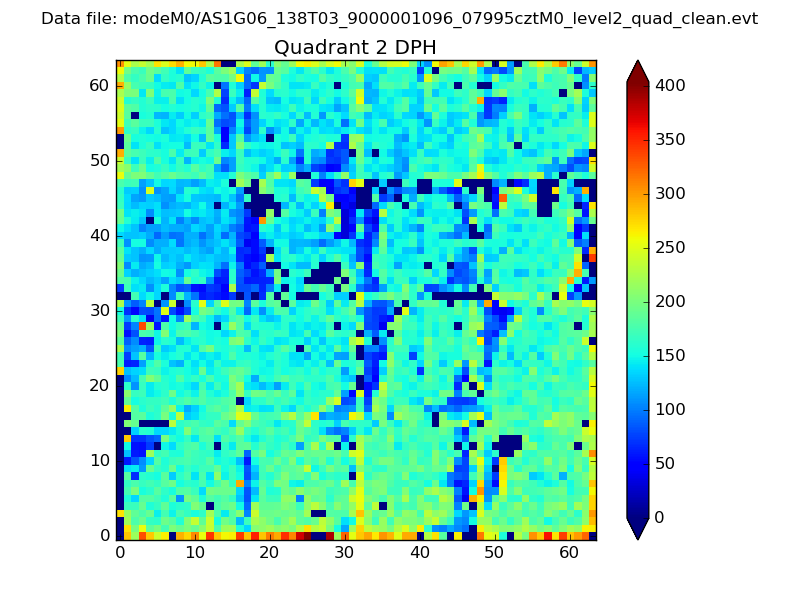
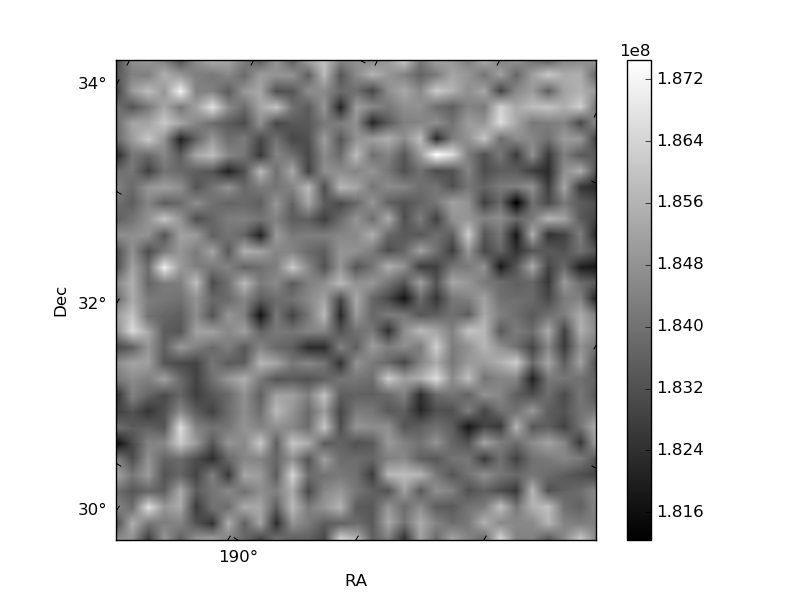
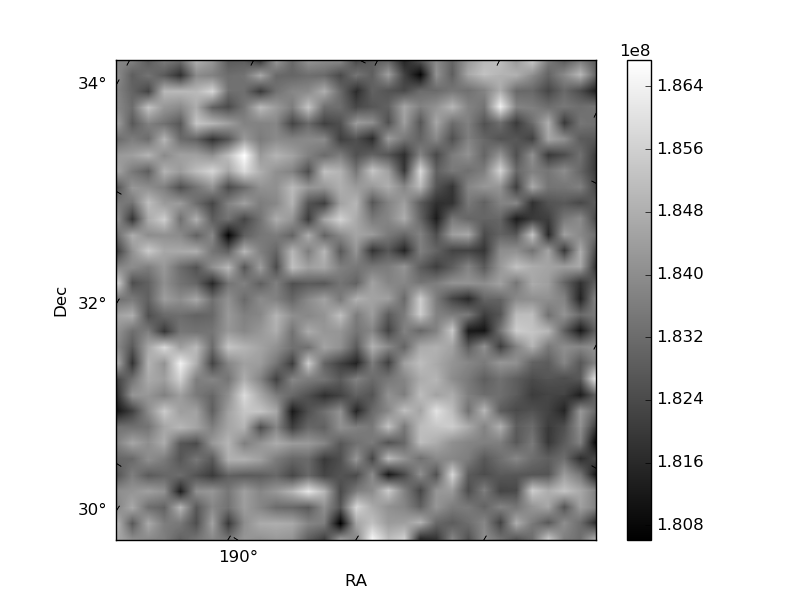
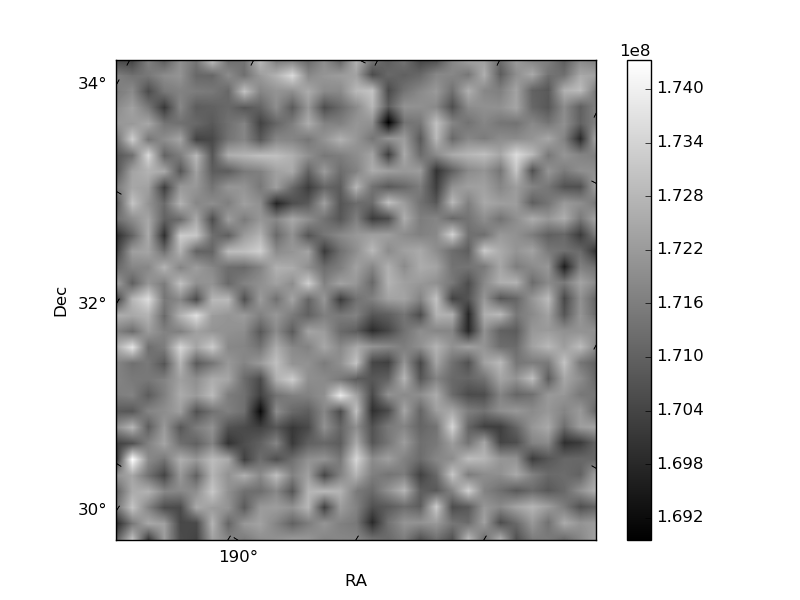
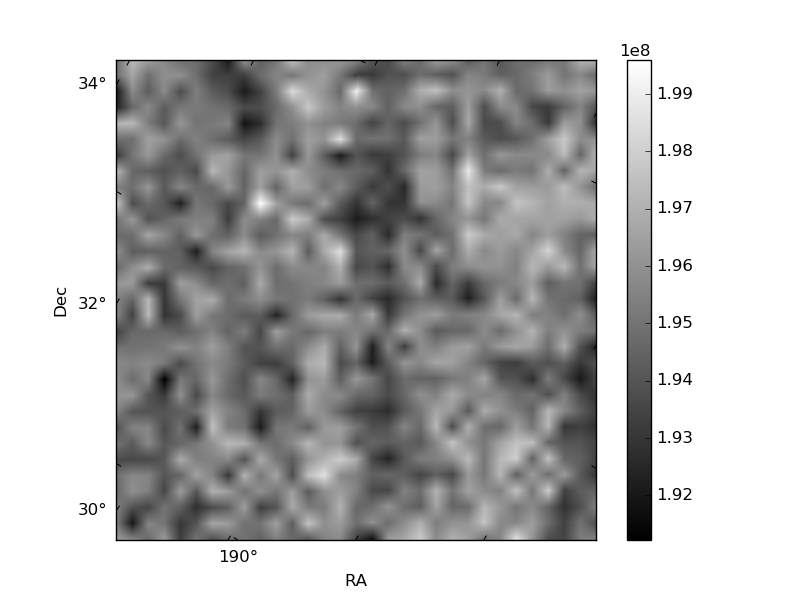
Histogram calculated using DETX and DETY for each event in the final _common_clean file
| Quadrant A | 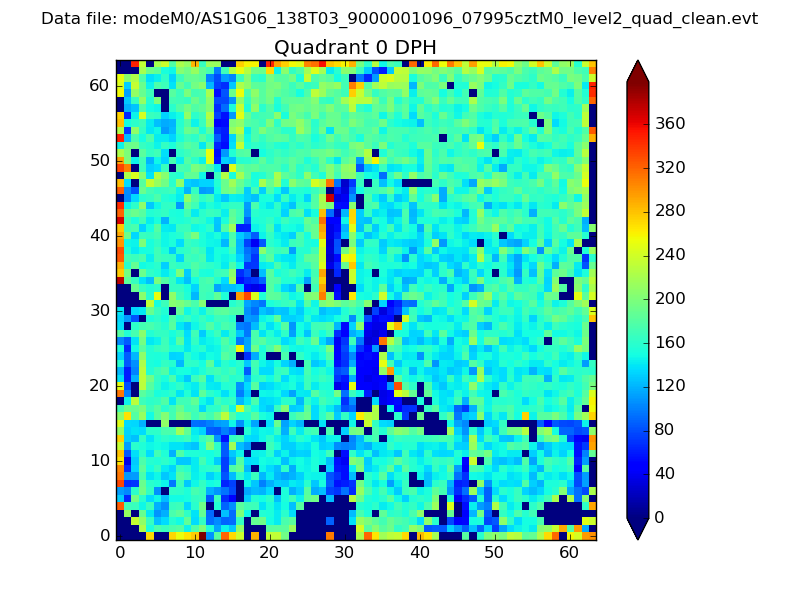 |
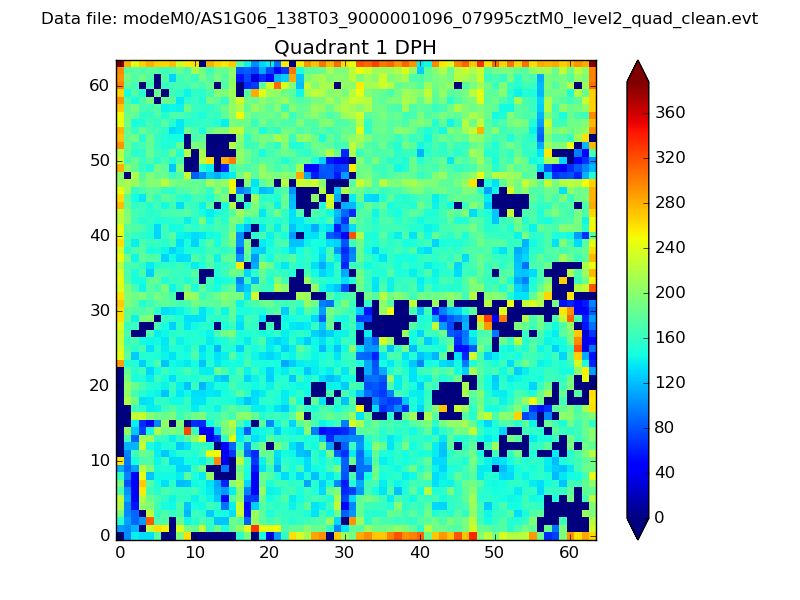 |
Quadrant B |
|---|---|---|---|
| Quadrant D | 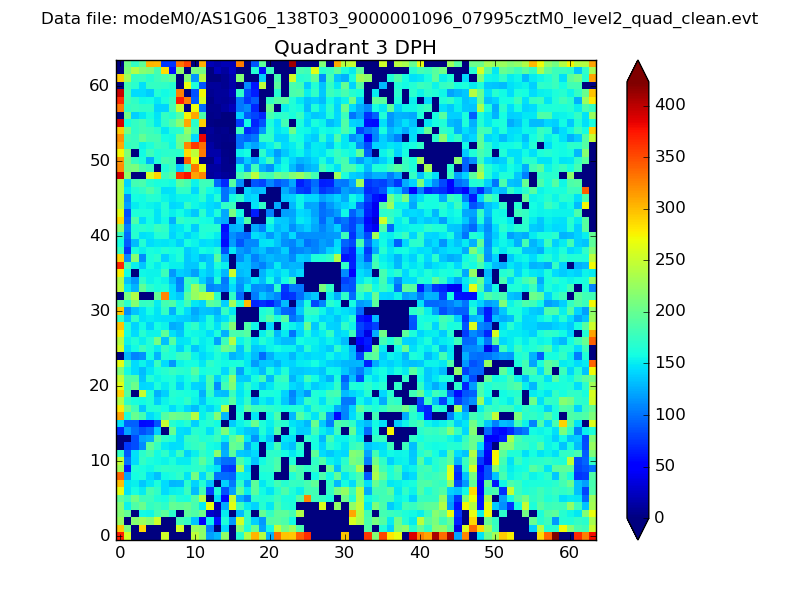 |
 |
Quadrant C |
| Plot type | Count rate plots | Images |
|---|---|---|
| Comparison with Poisson distribution Blue bars denote a histogram of data divided into 1 sec bins. Red curve is a Poisson curve with rate = median count rate of data. |
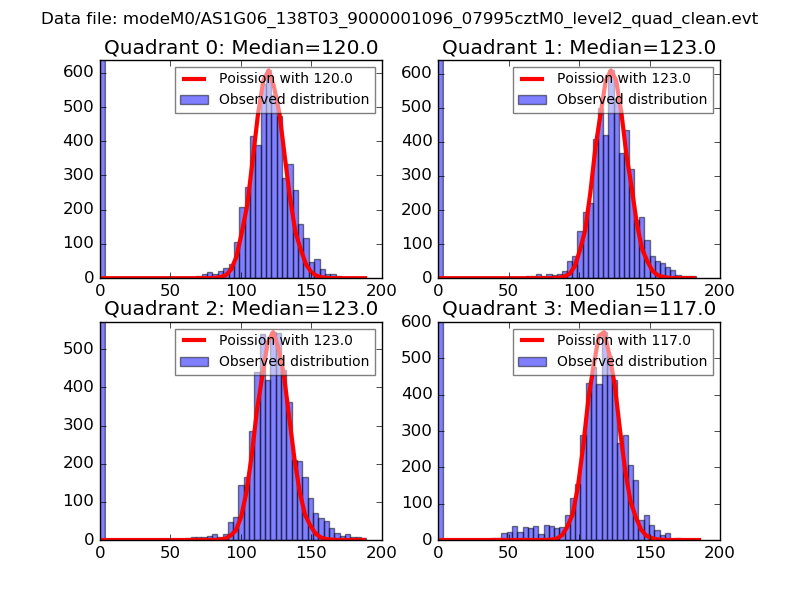 |
 |
| Quadrant-wise count rates Data is divided into 100 sec bins |
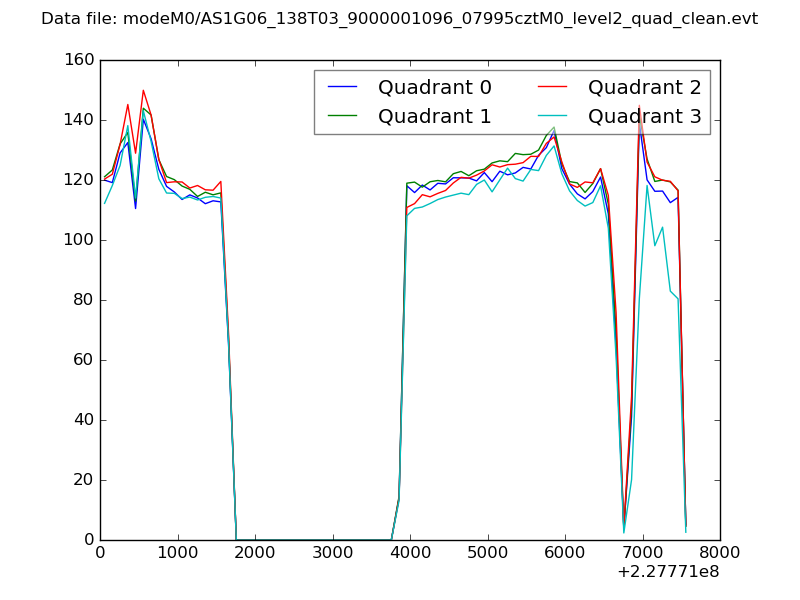 |
|
| Module-wise count rates for Quadrant A Data is divided into 100 sec bins |
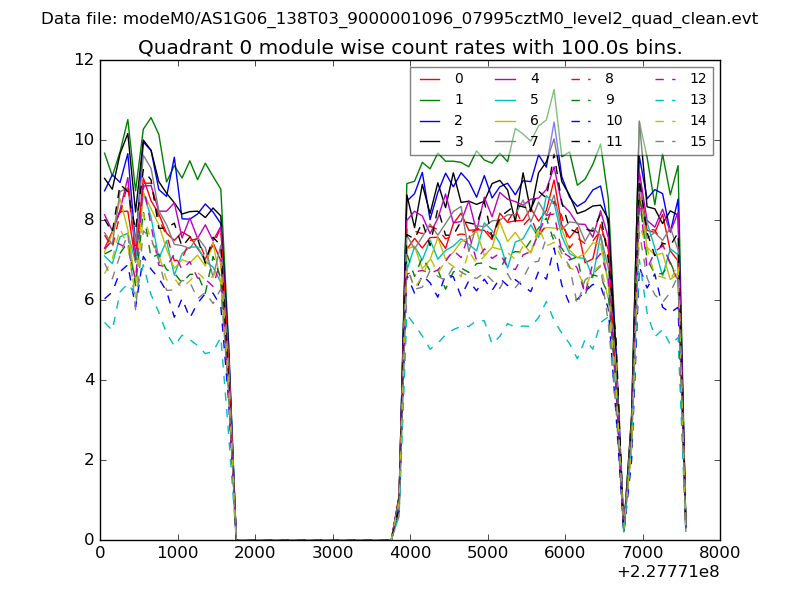 |
 |
| Module-wise count rates for Quadrant B Data is divided into 100 sec bins |
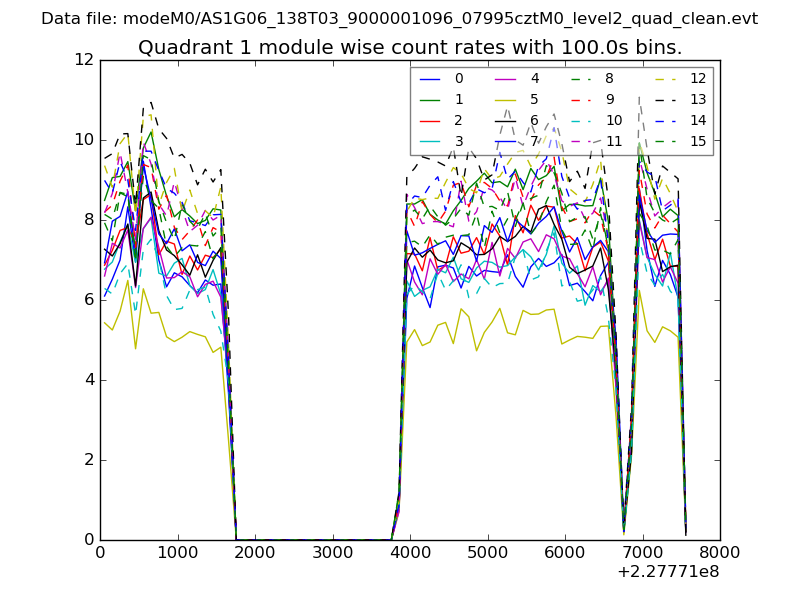 |
 |
| Module-wise count rates for Quadrant C Data is divided into 100 sec bins |
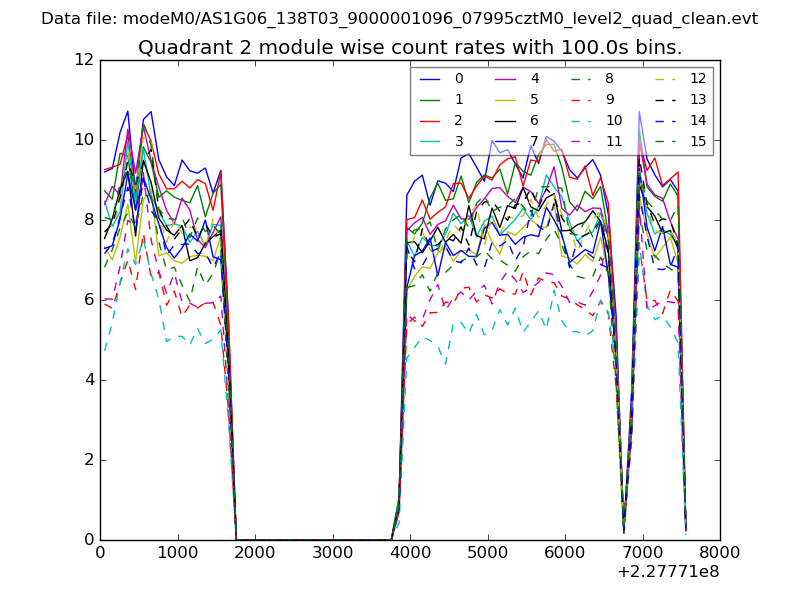 |
 |
| Module-wise count rates for Quadrant D Data is divided into 100 sec bins |
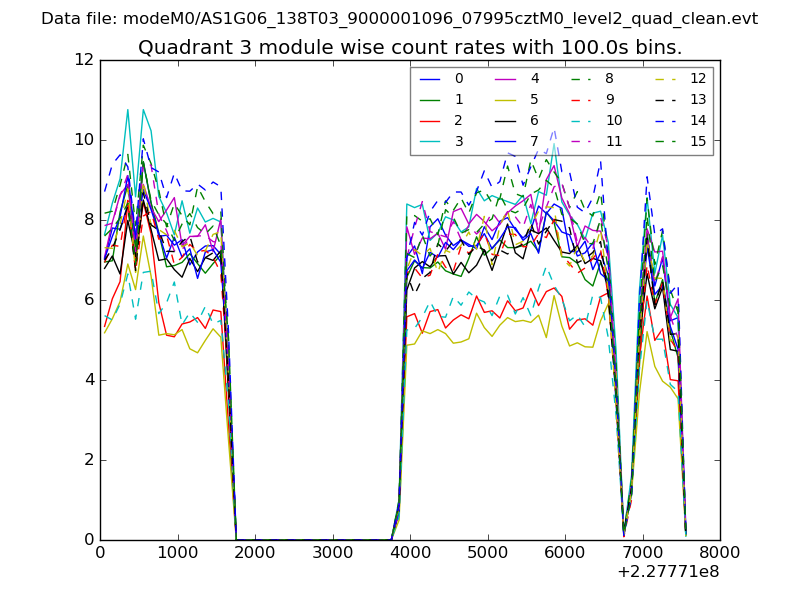 |
 |
| Parameter | Plot |
|---|---|
| CZT HV Monitor | 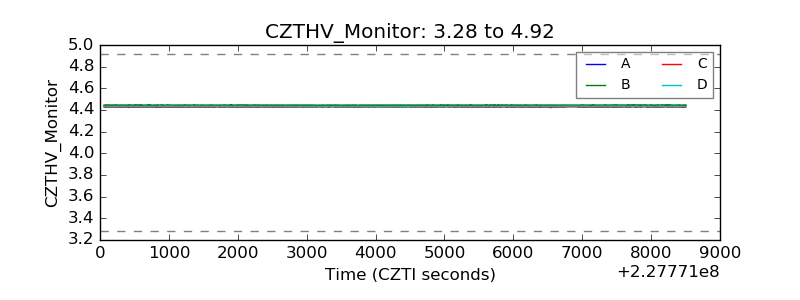 |
| D_VDD | 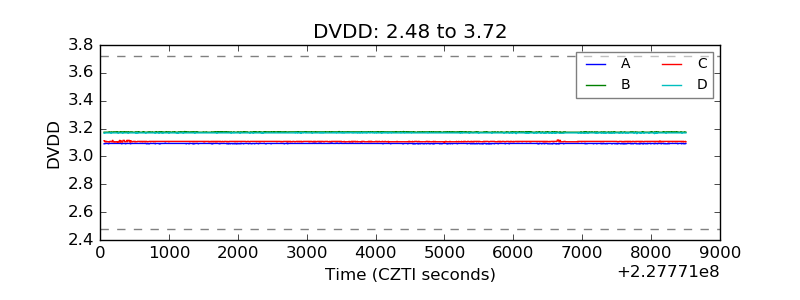 |
| Temperature 1 | 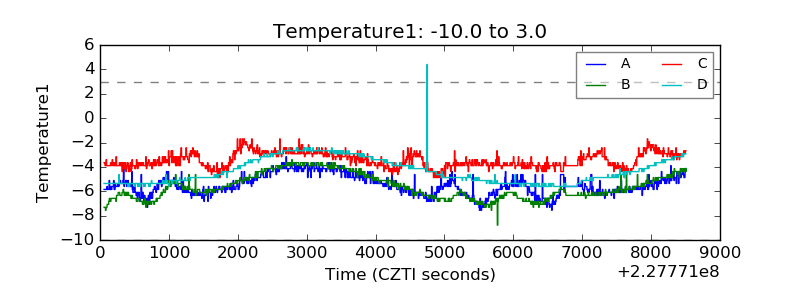 |
| Veto HV Monitor | 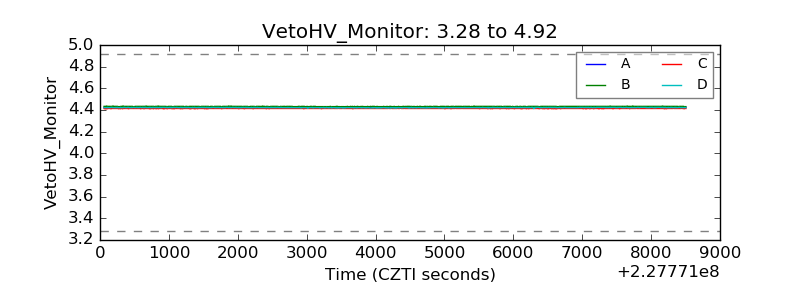 |
| Veto LLD | 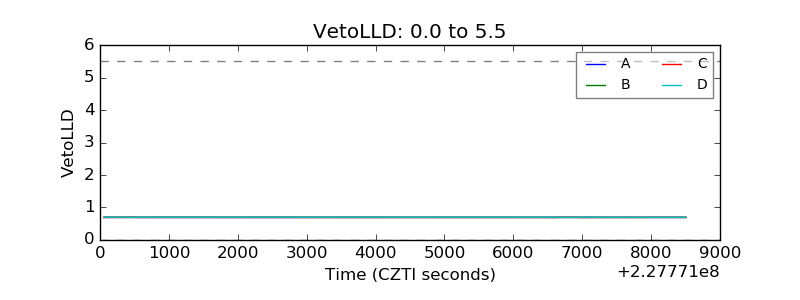 |
| Alpha Counter | 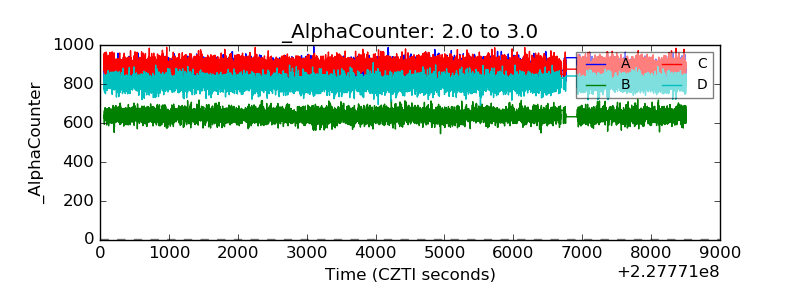 |
| _CPM_Rate | 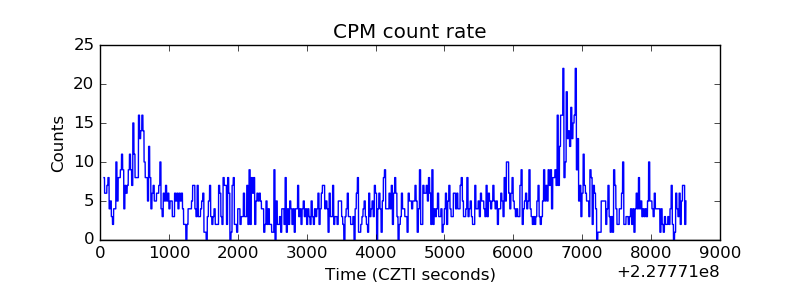 |
| CZT Counter | 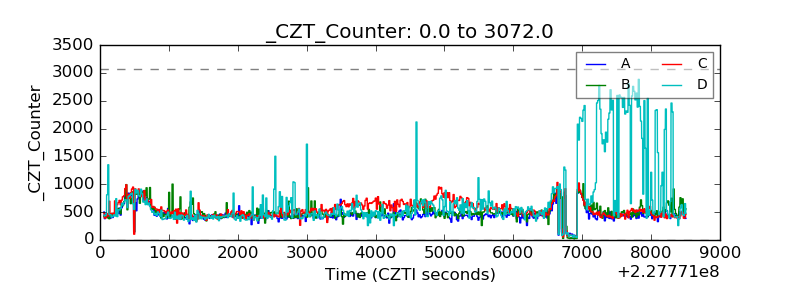 |
| +2.5 Volts monitor |  |
| +5 Volts monitor |  |
| _ROLL_ROT | 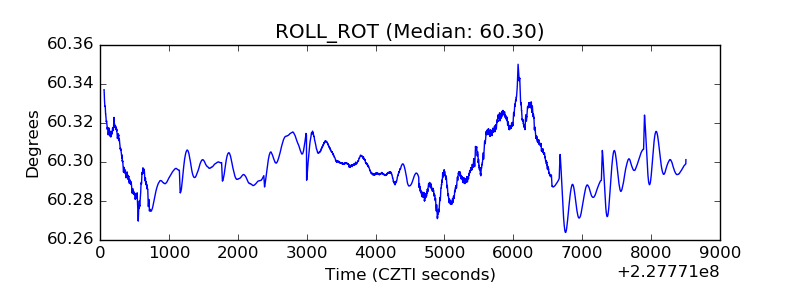 |
| _Roll_DEC | 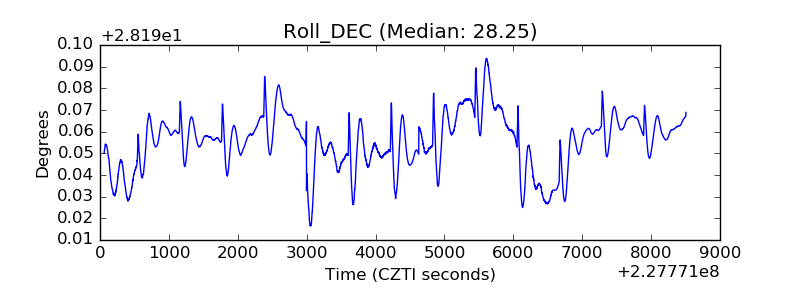 |
| _Roll_RA | 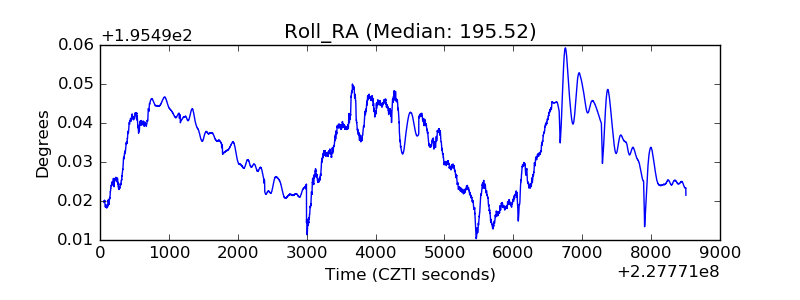 |
| Veto Counter | 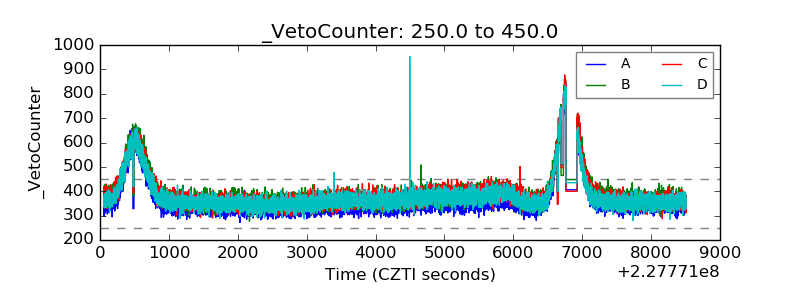 |