| Param | Original file | Final file |
|---|---|---|
| Filename | modeM0/AS1G06_138T03_9000001096_07998cztM0_level2.evt | modeM0/AS1G06_138T03_9000001096_07998cztM0_level2_quad_clean.evt |
| Size (bytes) | 1,270,555,200 | 203,768,640 |
| Size | 1.2 GB | 194.3 MB |
| Events in quadrant A | 8,311,185 | 1,231,354 |
| Events in quadrant B | 8,664,033 | 1,252,364 |
| Events in quadrant C | 8,544,888 | 1,242,726 |
| Events in quadrant D | 11,726,906 | 1,189,541 |
| Mode M0 | |||
|---|---|---|---|
| Quadrant | BADHDUFLAG | Total packets | Discarded packets |
| A | 0 | 37112 | 10 |
| B | 0 | 37619 | 15 |
| C | 0 | 37165 | 22 |
| D | 0 | 47235 | 11 |
| Mode SS | |||
|---|---|---|---|
| Quadrant | BADHDUFLAG | Total packets | Discarded packets |
| A | 0 | 368 | 0 |
| B | 0 | 368 | 0 |
| C | 0 | 368 | 0 |
| D | 0 | 368 | 0 |
| Mode M9 | |||
|---|---|---|---|
| Quadrant | BADHDUFLAG | Total packets | Discarded packets |
| A | 0 | 20 | 0 |
| B | 0 | 20 | 0 |
| C | 0 | 20 | 0 |
| D | 0 | 20 | 0 |
| Quadrant | Total seconds | Saturated seconds | Saturation percentage |
|---|---|---|---|
| A | 18220 | 229 | 1.256861% |
| B | 18217 | 243 | 1.333919% |
| C | 18213 | 199 | 1.092626% |
| D | 18219 | 1267 | 6.954279% |
Noise dominated data is calculated using 1-second bins in cleaned event files. If a bin has >2000 counts, and if more than 50% of those come from <1% of pixels, then it is considered to be noise-dominated and hence unusable.
| Quadrant | # 1 sec bins | Bins with >0 counts | Bins with >2000 counts | High rate bins dominated by noise | Noise dominated (total time) | Noise dominated (detector-on time) | Marked lightcurve |
|---|---|---|---|---|---|---|---|
| A | 20138 | 18225 | 0 | 0 | 0.00% | 0.00% | 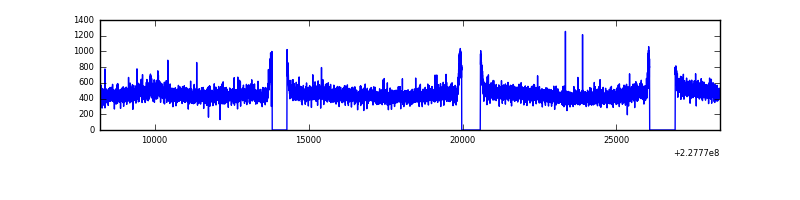 |
| B | 20138 | 18225 | 8 | 8 | 0.04% | 0.04% | 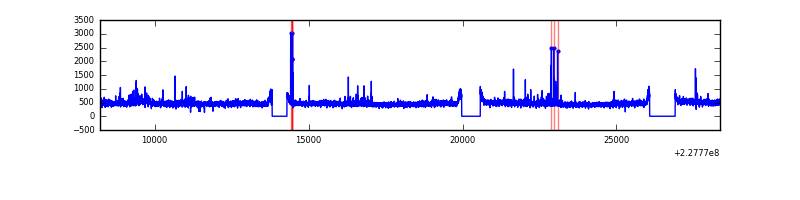 |
| C | 20138 | 18224 | 0 | 0 | 0.00% | 0.00% |  |
| D | 20138 | 18225 | 1019 | 1019 | 5.06% | 5.59% | 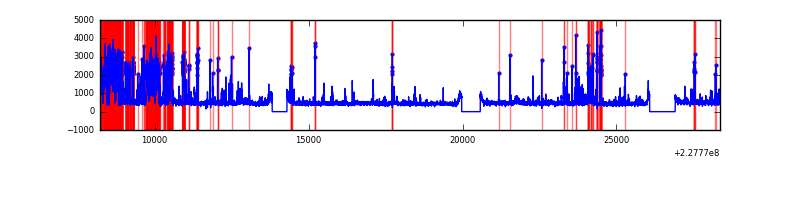 |
Top three noisy pixels from each quadrant. If the there are fewer than three noisy pixels in the level2.evt file, extra rows are filled as -1
| Pixel properties | Quadrant properties | ||||||
|---|---|---|---|---|---|---|---|
| Quadrant | DetID | PixID | Counts | Sigma | Mean | Median | Sigma |
| A | 0 | 128 | 64290 | 142.52 | 2140 | 2090 | 436.4 |
| A | 0 | 226 | 19736 | 40.43 | 2140 | 2090 | 436.4 |
| A | 12 | 194 | 18056 | 36.58 | 2140 | 2090 | 436.4 |
| B | 5 | 255 | 210494 | 500.37 | 2148 | 2089 | 416.5 |
| B | 11 | 51 | 61003 | 141.45 | 2148 | 2089 | 416.5 |
| B | 12 | 111 | 47460 | 108.93 | 2148 | 2089 | 416.5 |
| C | 8 | 208 | 357782 | 732.09 | 2089 | 2100 | 485.8 |
| C | 8 | 128 | 18225 | 33.19 | 2089 | 2100 | 485.8 |
| C | 13 | 61 | 15969 | 28.55 | 2089 | 2100 | 485.8 |
| D | 1 | 52 | 3253322 | 6597.25 | 2047 | 1990 | 492.8 |
| D | 2 | 14 | 228198 | 459.0 | 2047 | 1990 | 492.8 |
| D | 5 | 233 | 205191 | 412.31 | 2047 | 1990 | 492.8 |
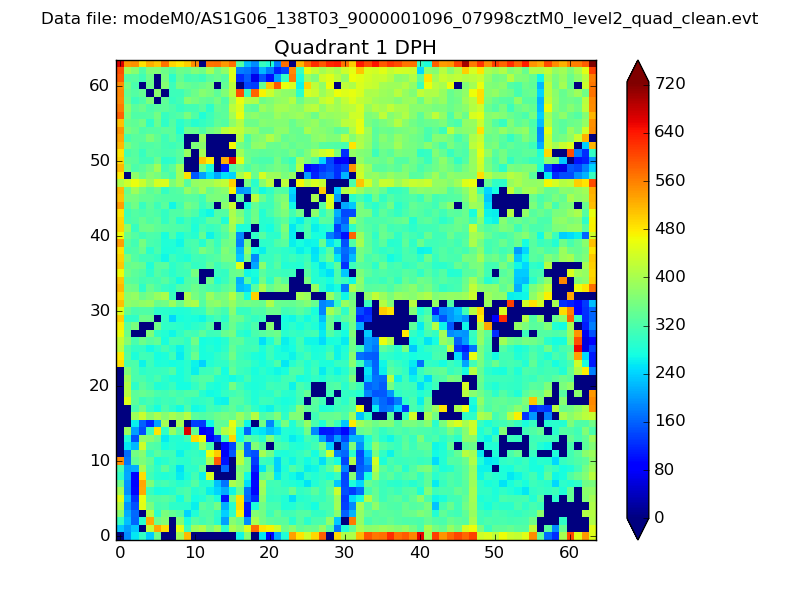
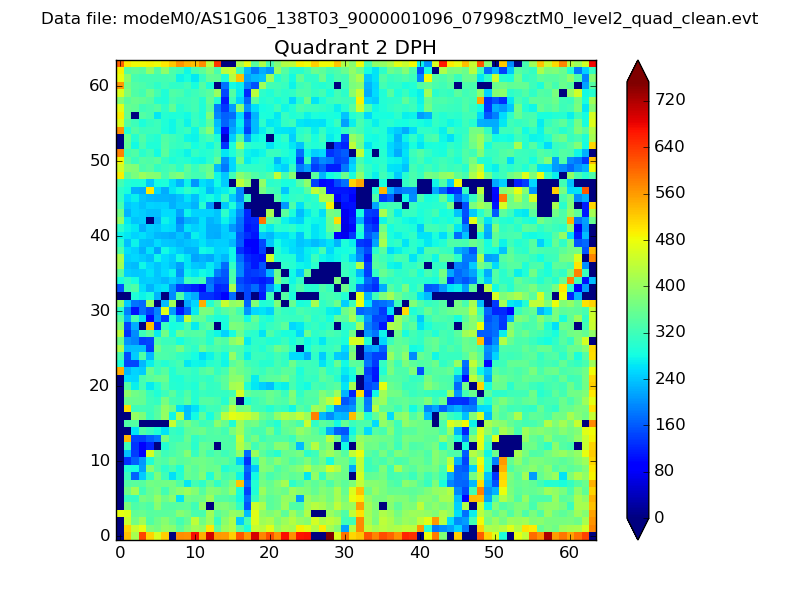
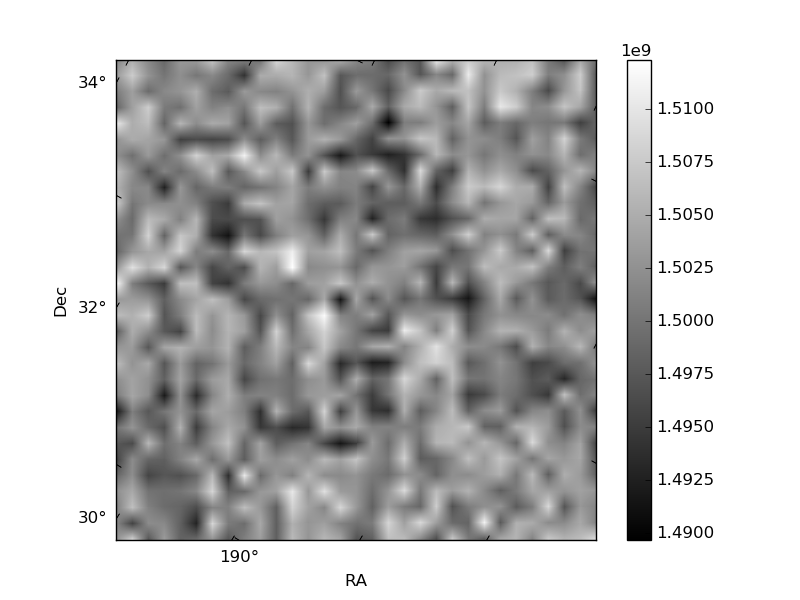
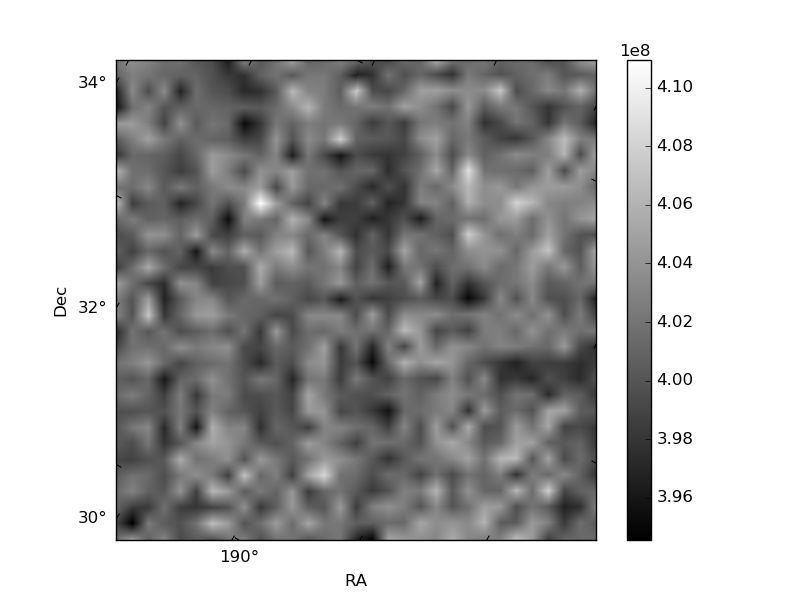
Histogram calculated using DETX and DETY for each event in the final _common_clean file
| Quadrant A | 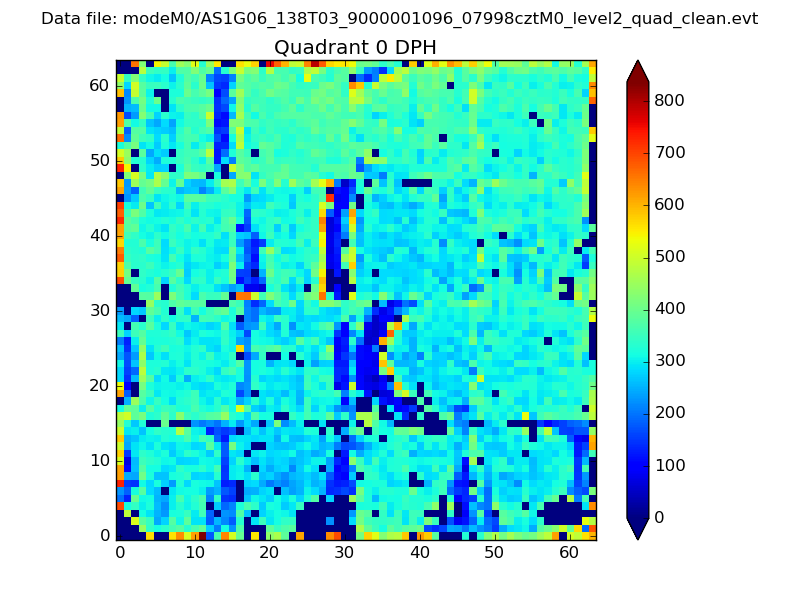 |
 |
Quadrant B |
|---|---|---|---|
| Quadrant D | 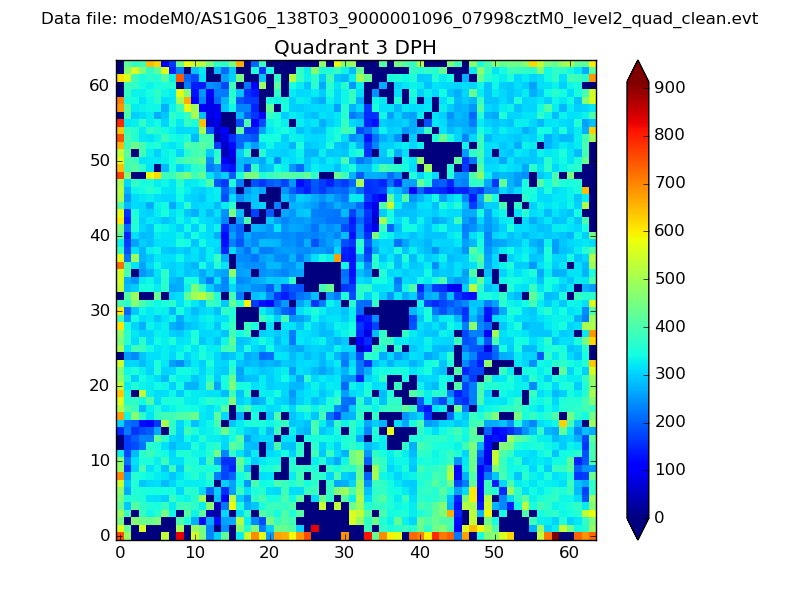 |
 |
Quadrant C |
| Plot type | Count rate plots | Images |
|---|---|---|
| Comparison with Poisson distribution Blue bars denote a histogram of data divided into 1 sec bins. Red curve is a Poisson curve with rate = median count rate of data. |
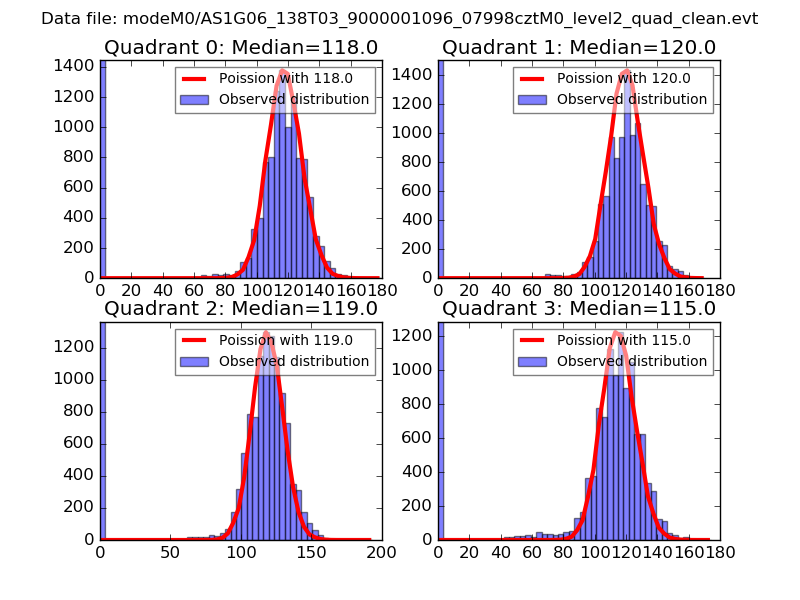 |
 |
| Quadrant-wise count rates Data is divided into 100 sec bins |
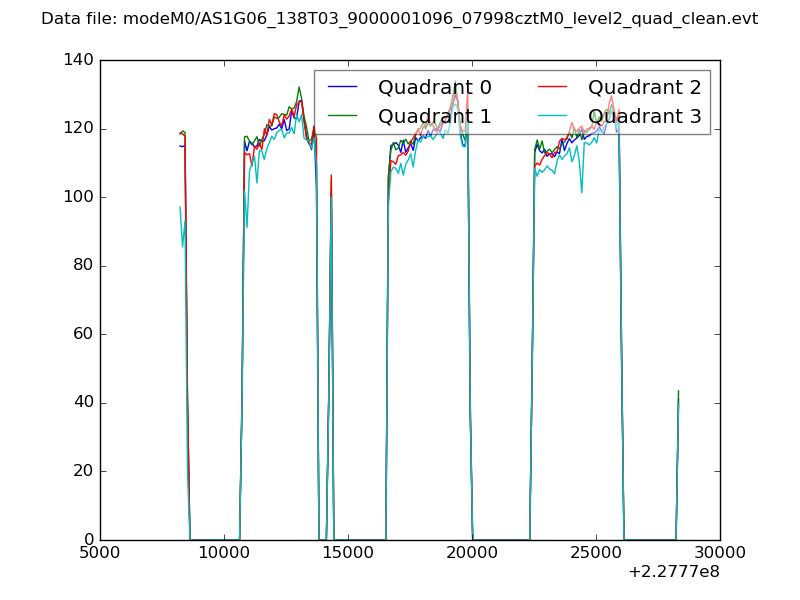 |
|
| Module-wise count rates for Quadrant A Data is divided into 100 sec bins |
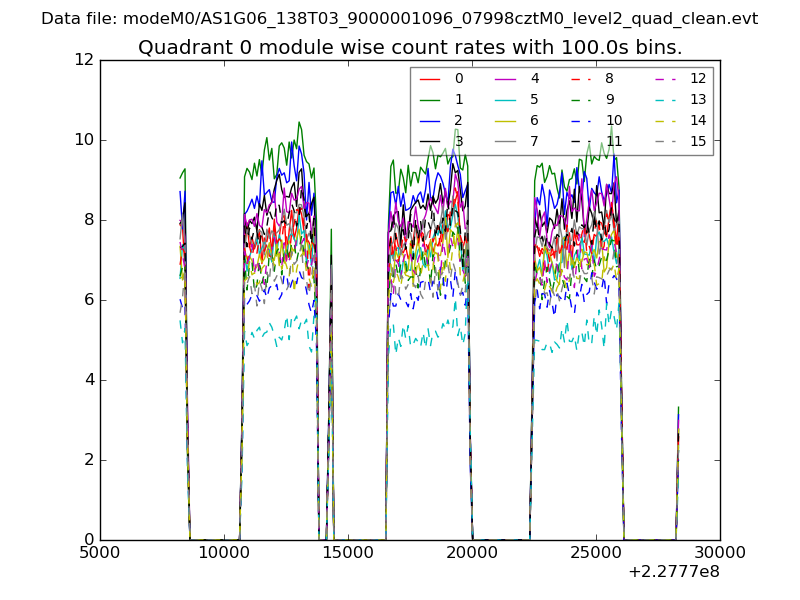 |
 |
| Module-wise count rates for Quadrant B Data is divided into 100 sec bins |
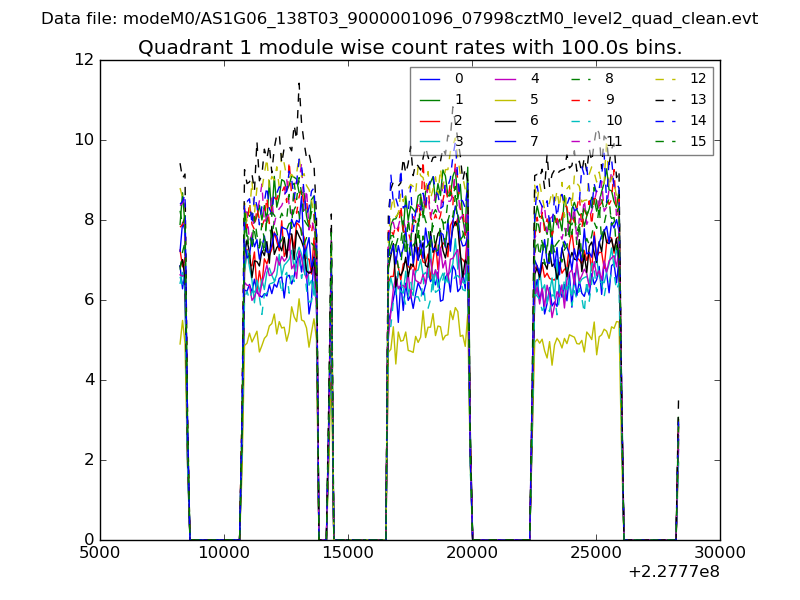 |
 |
| Module-wise count rates for Quadrant C Data is divided into 100 sec bins |
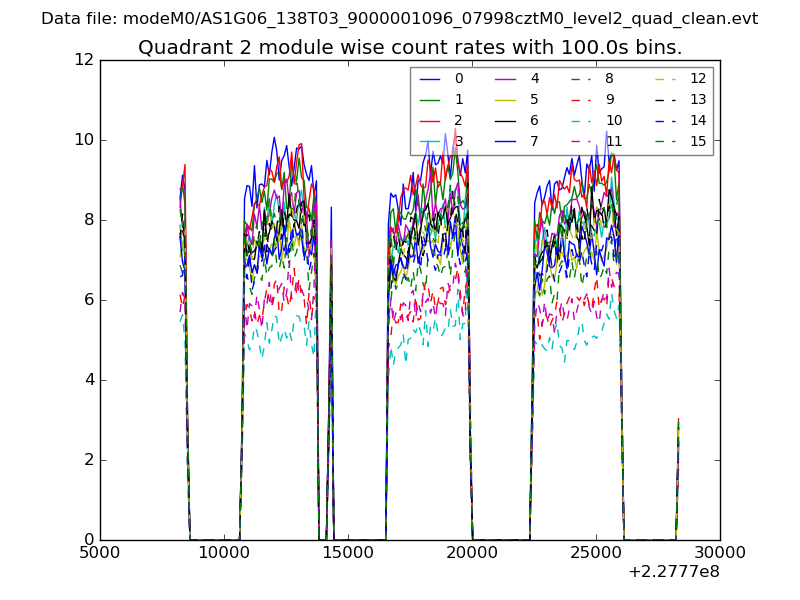 |
 |
| Module-wise count rates for Quadrant D Data is divided into 100 sec bins |
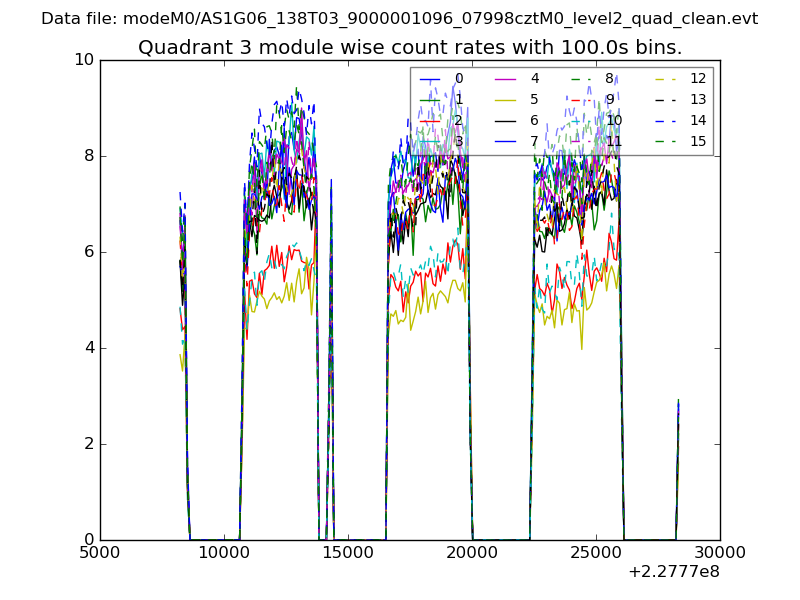 |
 |
| Parameter | Plot |
|---|---|
| CZT HV Monitor | 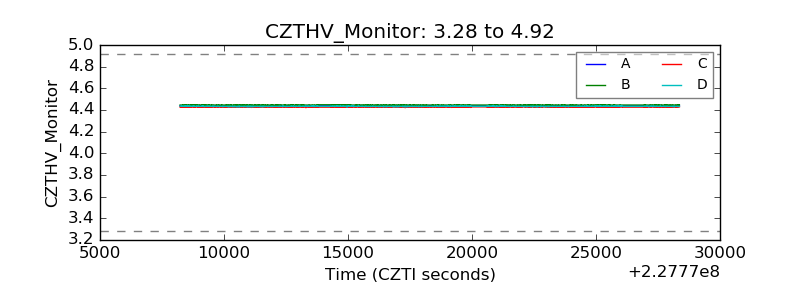 |
| D_VDD | 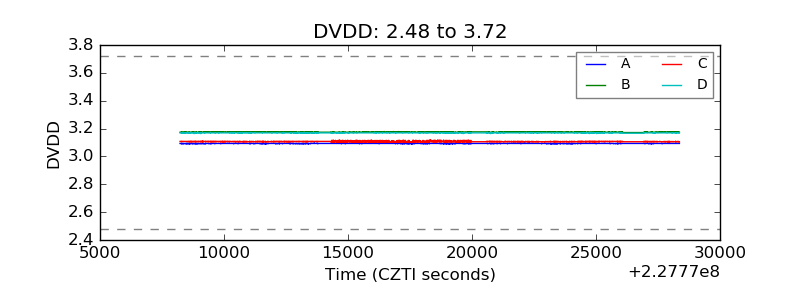 |
| Temperature 1 | 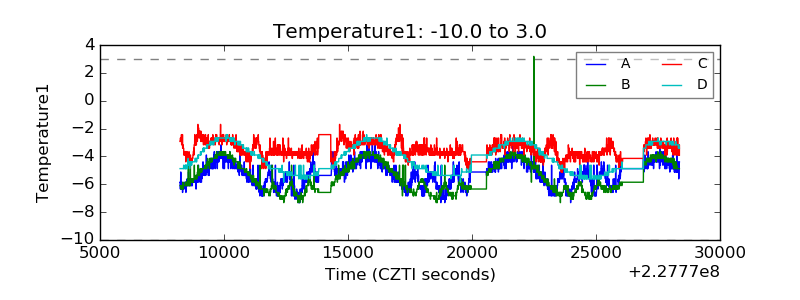 |
| Veto HV Monitor | 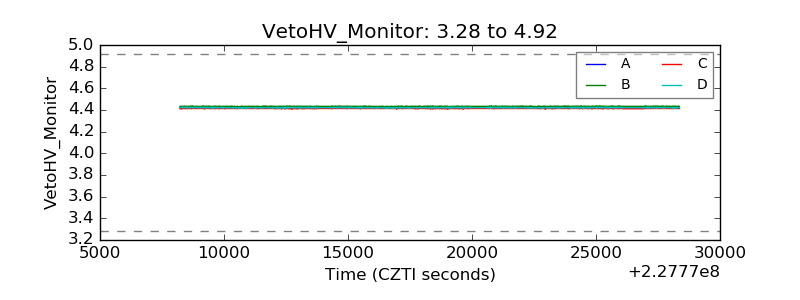 |
| Veto LLD | 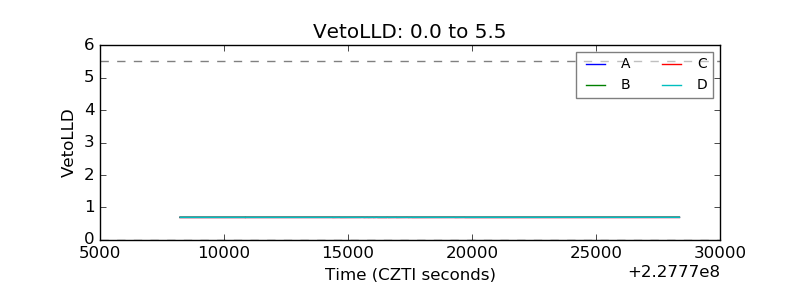 |
| Alpha Counter | 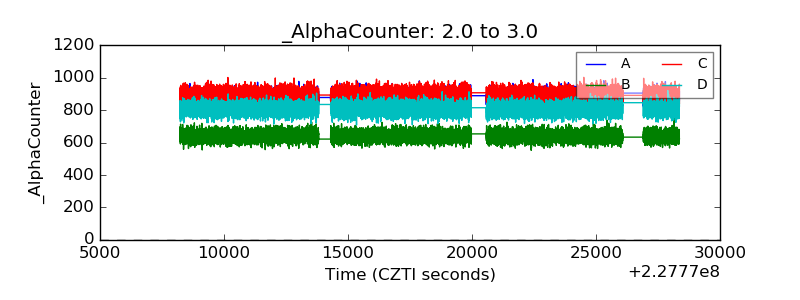 |
| _CPM_Rate | 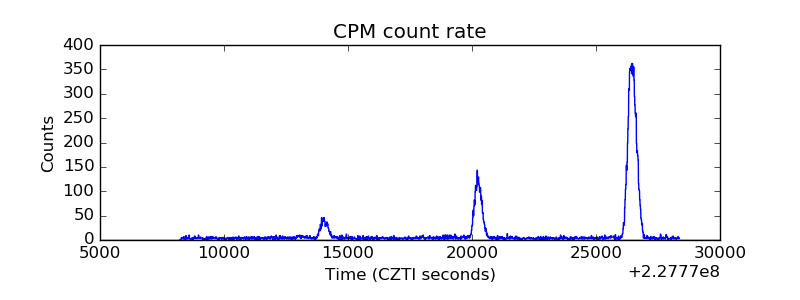 |
| CZT Counter | 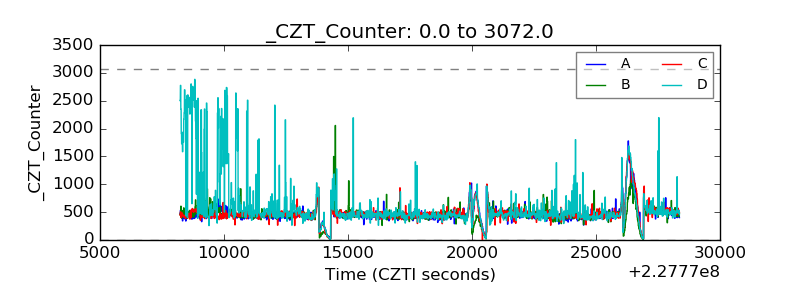 |
| +2.5 Volts monitor |  |
| +5 Volts monitor | 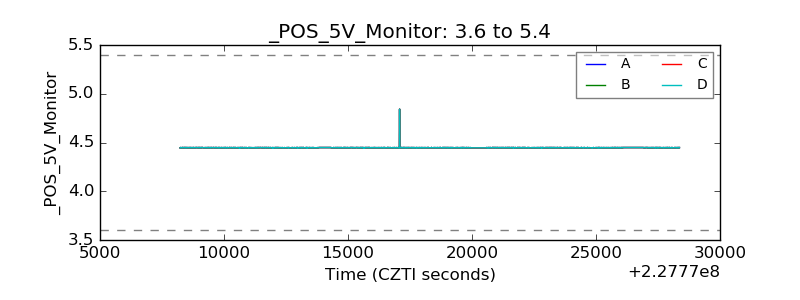 |
| _ROLL_ROT | 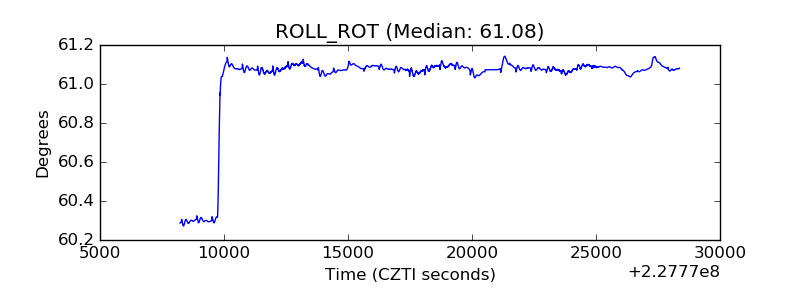 |
| _Roll_DEC | 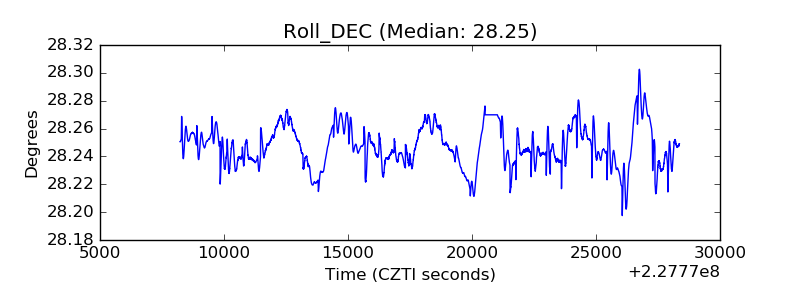 |
| _Roll_RA | 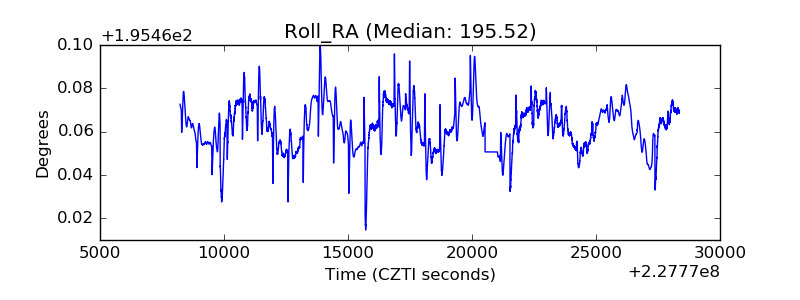 |
| Veto Counter | 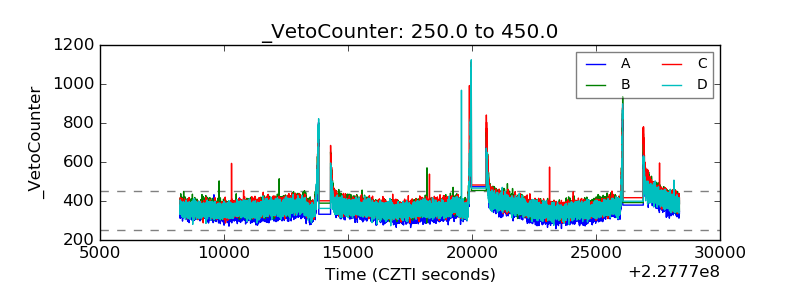 |