| Param | Original file | Final file |
|---|---|---|
| Filename | modeM0/AS1G06_138T03_9000001096_07999cztM0_level2.evt | modeM0/AS1G06_138T03_9000001096_07999cztM0_level2_quad_clean.evt |
| Size (bytes) | 473,889,600 | 84,464,640 |
| Size | 451.9 MB | 80.6 MB |
| Events in quadrant A | 3,324,107 | 515,590 |
| Events in quadrant B | 3,390,917 | 527,396 |
| Events in quadrant C | 3,451,768 | 522,515 |
| Events in quadrant D | 3,709,465 | 504,773 |
| Mode M0 | |||
|---|---|---|---|
| Quadrant | BADHDUFLAG | Total packets | Discarded packets |
| A | 0 | 14553 | 3 |
| B | 0 | 14587 | 2 |
| C | 0 | 14579 | 2 |
| D | 0 | 15805 | 2 |
| Mode SS | |||
|---|---|---|---|
| Quadrant | BADHDUFLAG | Total packets | Discarded packets |
| A | 0 | 142 | 0 |
| B | 0 | 142 | 0 |
| C | 0 | 142 | 0 |
| D | 0 | 142 | 0 |
| Mode M9 | |||
|---|---|---|---|
| Quadrant | BADHDUFLAG | Total packets | Discarded packets |
| A | 0 | 19 | 0 |
| B | 0 | 19 | 0 |
| C | 0 | 19 | 0 |
| D | 0 | 19 | 0 |
| Quadrant | Total seconds | Saturated seconds | Saturation percentage |
|---|---|---|---|
| A | 7005 | 100 | 1.427552% |
| B | 7005 | 104 | 1.484654% |
| C | 7005 | 90 | 1.284797% |
| D | 7005 | 173 | 2.469665% |
Noise dominated data is calculated using 1-second bins in cleaned event files. If a bin has >2000 counts, and if more than 50% of those come from <1% of pixels, then it is considered to be noise-dominated and hence unusable.
| Quadrant | # 1 sec bins | Bins with >0 counts | Bins with >2000 counts | High rate bins dominated by noise | Noise dominated (total time) | Noise dominated (detector-on time) | Marked lightcurve |
|---|---|---|---|---|---|---|---|
| A | 8850 | 7007 | 3 | 3 | 0.03% | 0.04% | 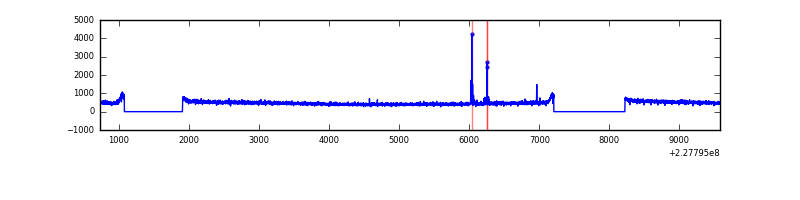 |
| B | 8850 | 7007 | 0 | 0 | 0.00% | 0.00% | 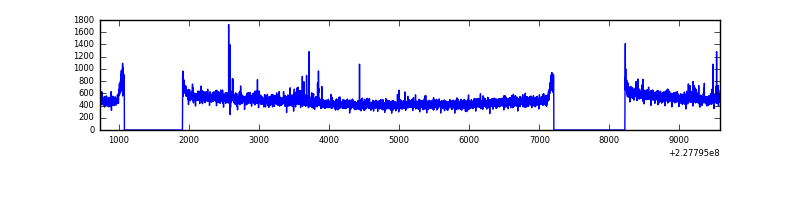 |
| C | 8850 | 7007 | 0 | 0 | 0.00% | 0.00% | 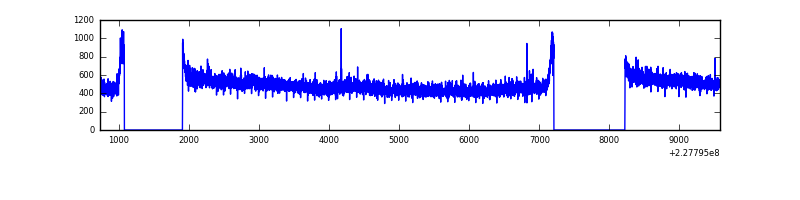 |
| D | 8850 | 7007 | 70 | 70 | 0.79% | 1.00% | 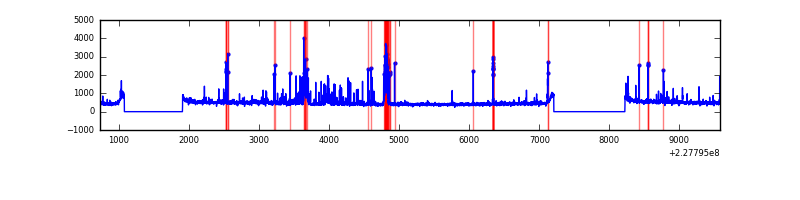 |
Top three noisy pixels from each quadrant. If the there are fewer than three noisy pixels in the level2.evt file, extra rows are filled as -1
| Pixel properties | Quadrant properties | ||||||
|---|---|---|---|---|---|---|---|
| Quadrant | DetID | PixID | Counts | Sigma | Mean | Median | Sigma |
| A | 4 | 2 | 23555 | 129.69 | 855 | 837 | 175.2 |
| A | 0 | 226 | 8103 | 41.48 | 855 | 837 | 175.2 |
| A | 12 | 194 | 7418 | 37.57 | 855 | 837 | 175.2 |
| B | 11 | 51 | 32571 | 188.78 | 861 | 838 | 168.1 |
| B | 12 | 111 | 18672 | 106.1 | 861 | 838 | 168.1 |
| B | 11 | 111 | 15377 | 86.49 | 861 | 838 | 168.1 |
| C | 8 | 208 | 174136 | 886.58 | 838 | 842 | 195.5 |
| C | 13 | 61 | 6272 | 27.78 | 838 | 842 | 195.5 |
| C | 1 | 16 | 3847 | 15.37 | 838 | 842 | 195.5 |
| D | 1 | 52 | 200019 | 998.8 | 833 | 811 | 199.4 |
| D | 11 | 144 | 167301 | 834.76 | 833 | 811 | 199.4 |
| D | 2 | 14 | 145754 | 726.72 | 833 | 811 | 199.4 |
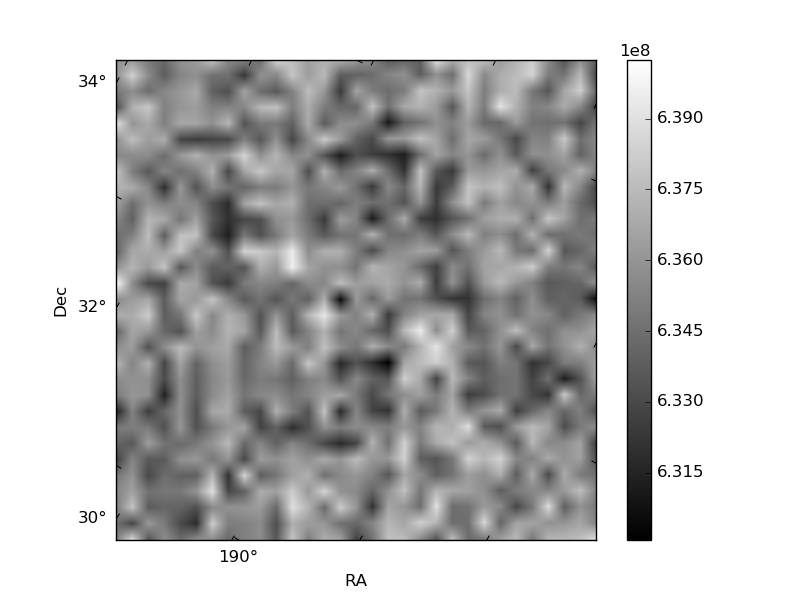
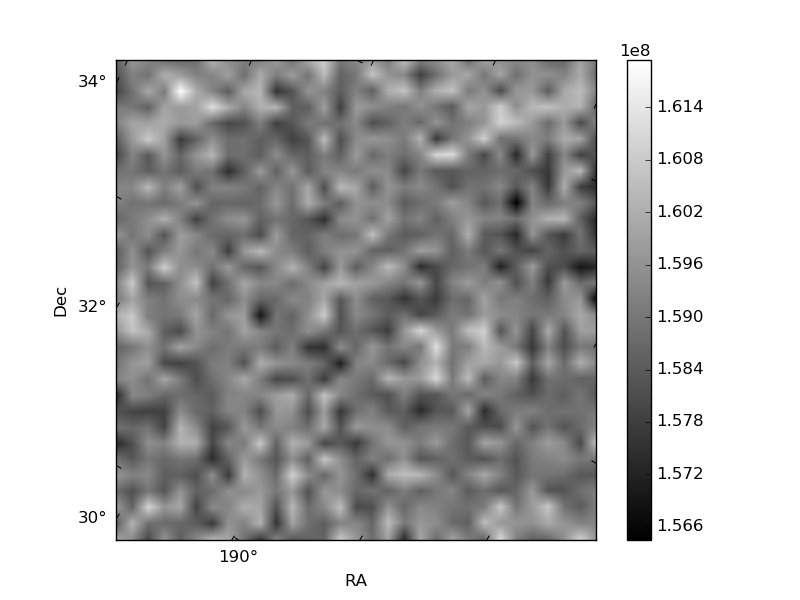
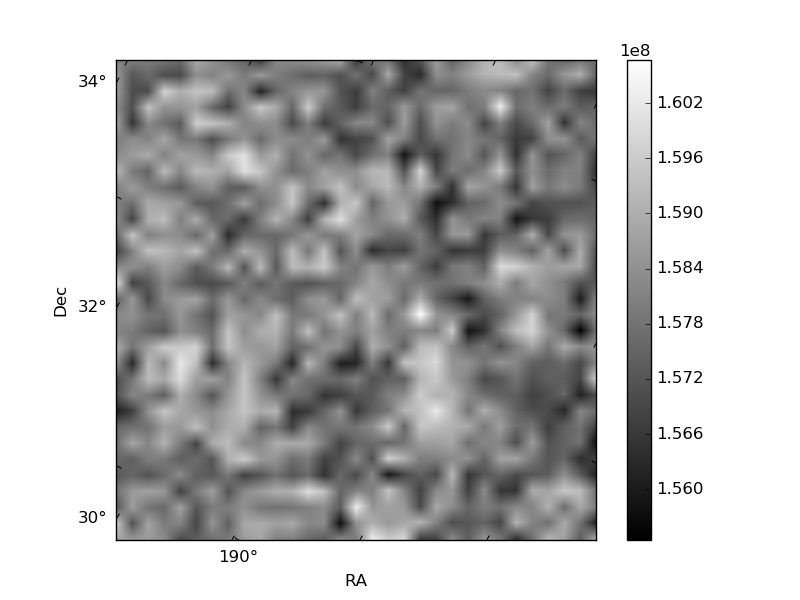
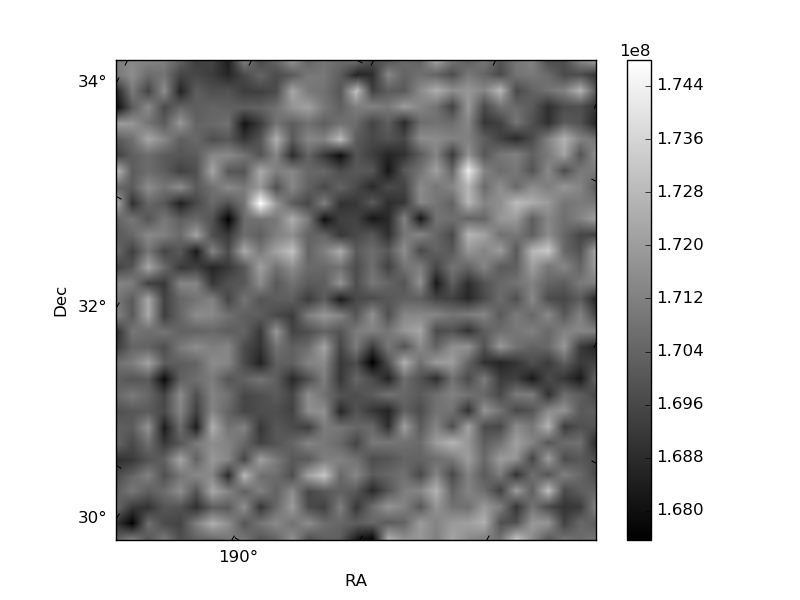
Histogram calculated using DETX and DETY for each event in the final _common_clean file
| Quadrant A | 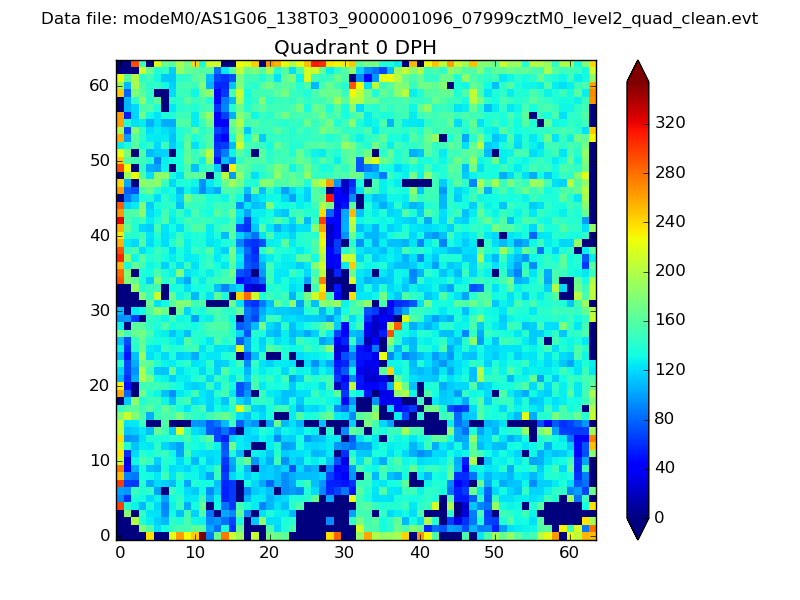 |
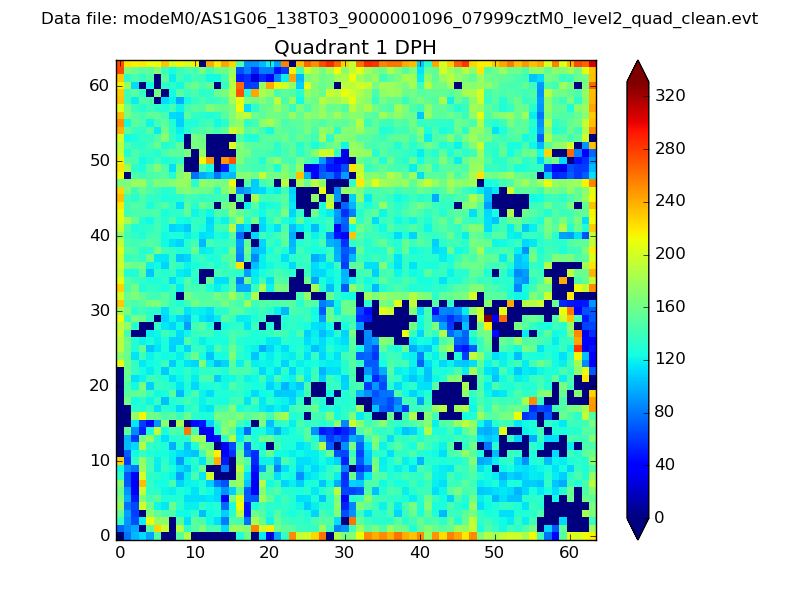 |
Quadrant B |
|---|---|---|---|
| Quadrant D | 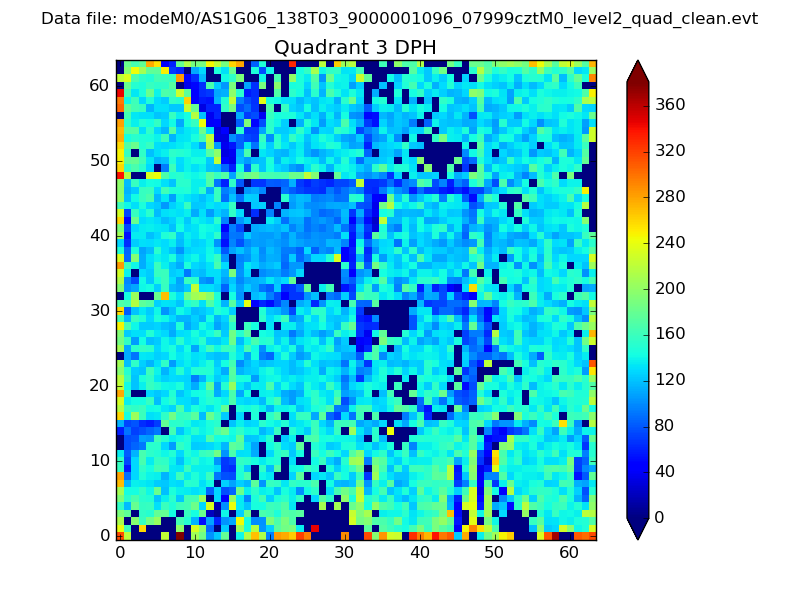 |
 |
Quadrant C |
| Plot type | Count rate plots | Images |
|---|---|---|
| Comparison with Poisson distribution Blue bars denote a histogram of data divided into 1 sec bins. Red curve is a Poisson curve with rate = median count rate of data. |
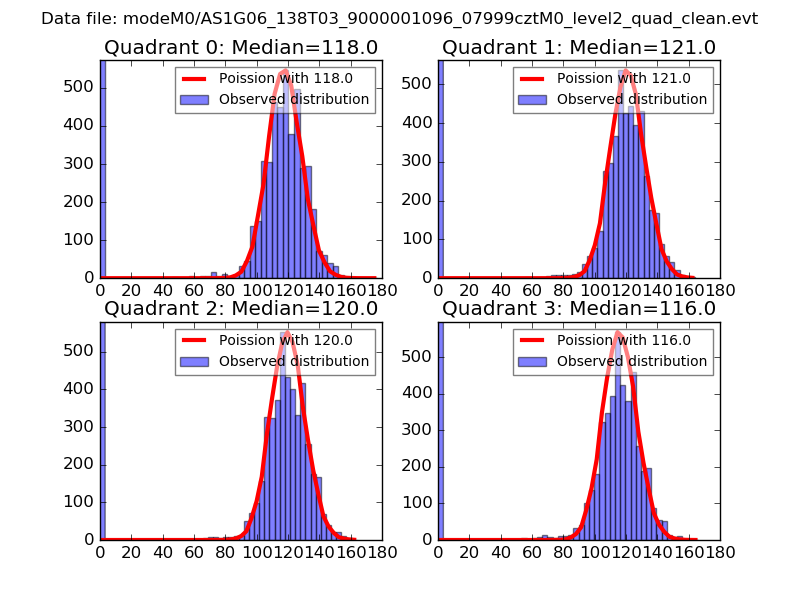 |
 |
| Quadrant-wise count rates Data is divided into 100 sec bins |
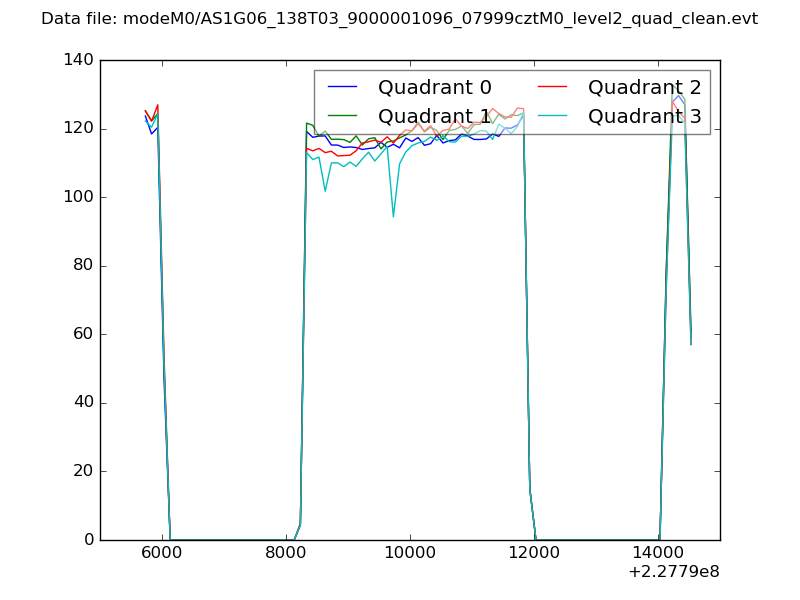 |
|
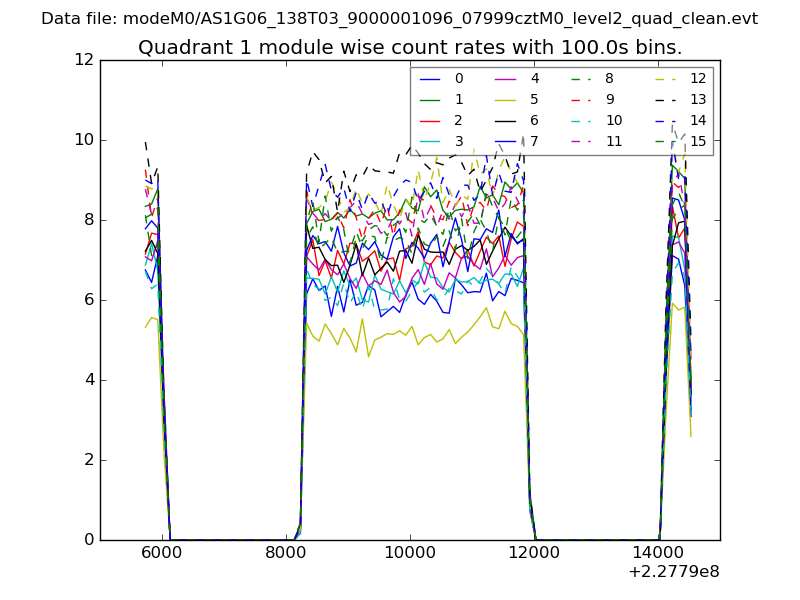
| Module-wise count rates for Quadrant A Data is divided into 100 sec bins |
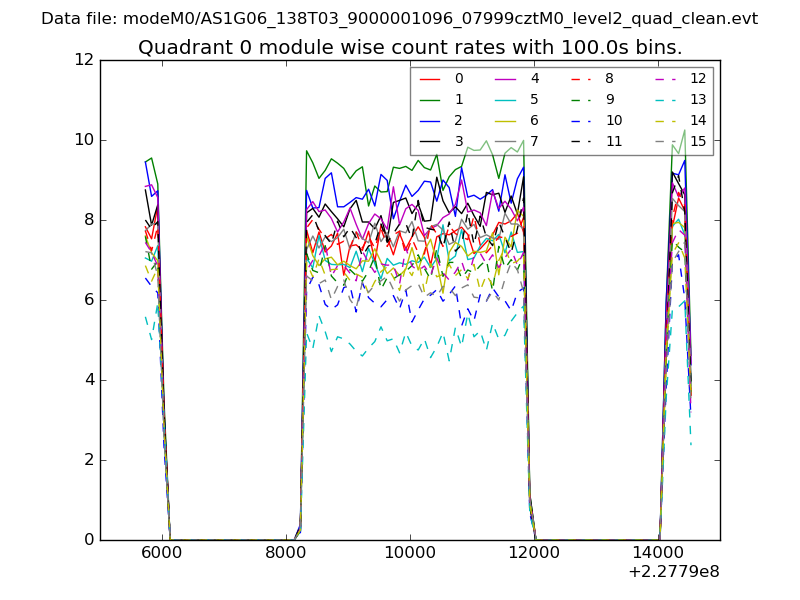 |
 |
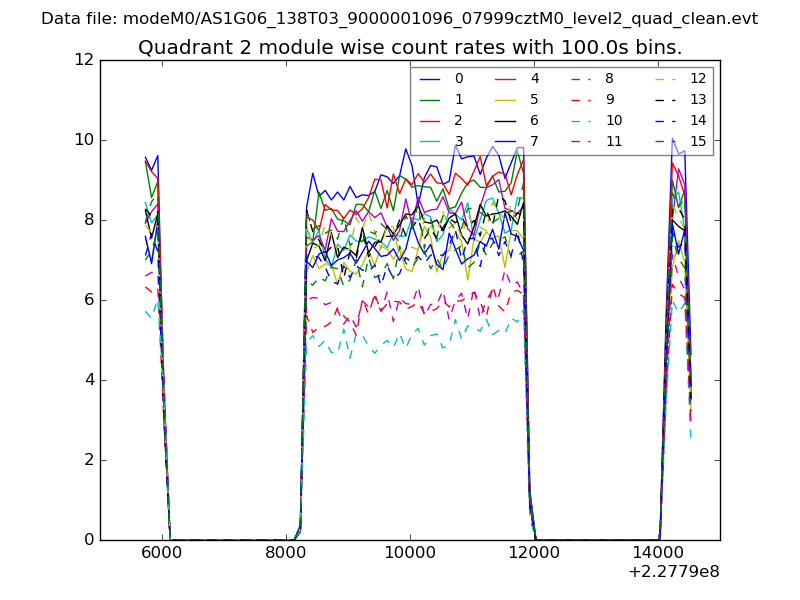
| Module-wise count rates for Quadrant B Data is divided into 100 sec bins |
 |
 |
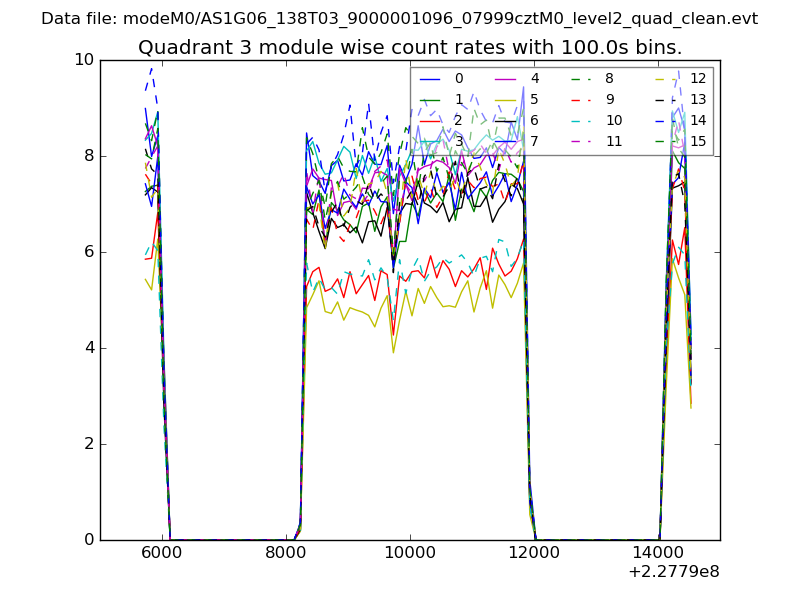
| Module-wise count rates for Quadrant C Data is divided into 100 sec bins |
 |
 |
| Module-wise count rates for Quadrant D Data is divided into 100 sec bins |
 |
 |
| Parameter | Plot |
|---|---|
| CZT HV Monitor | 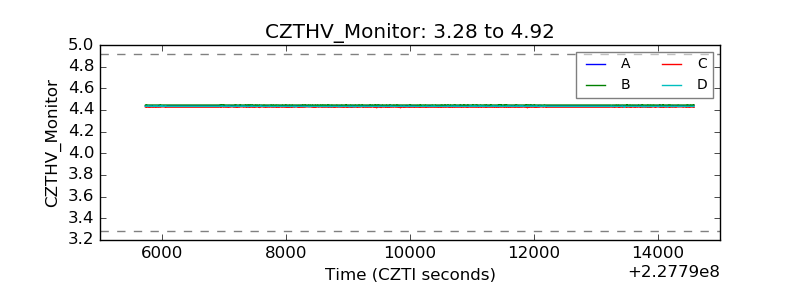 |
| D_VDD | 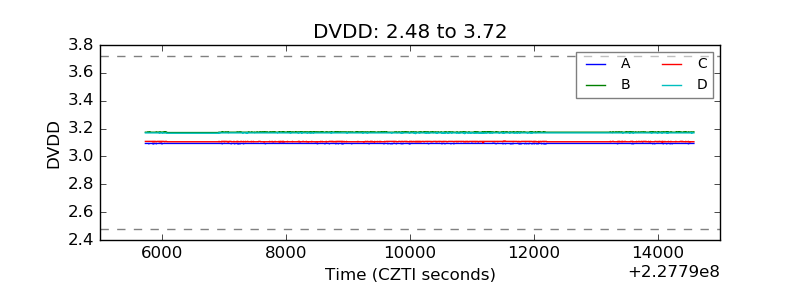 |
| Temperature 1 | 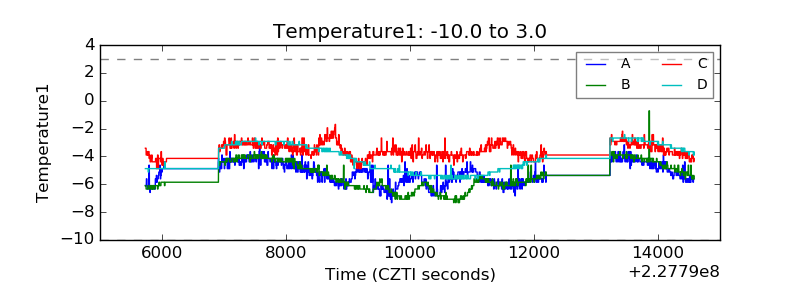 |
| Veto HV Monitor | 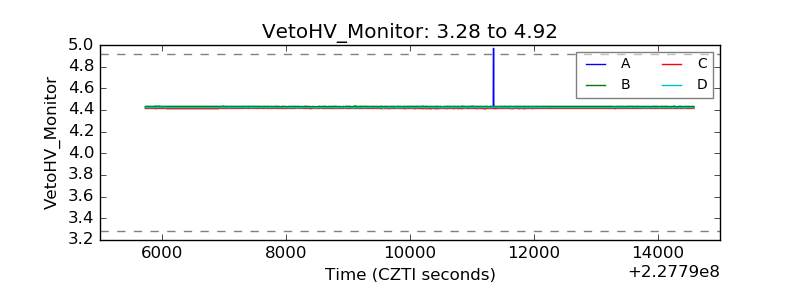 |
| Veto LLD | 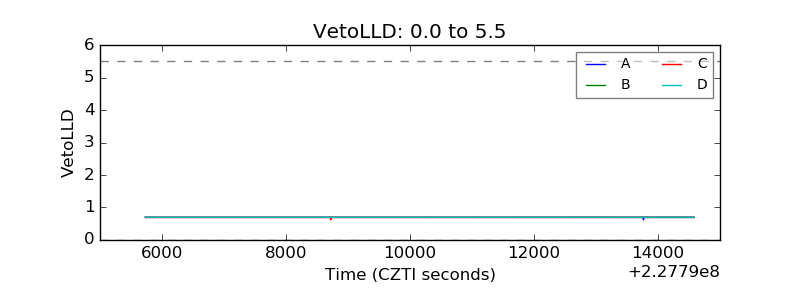 |
| Alpha Counter | 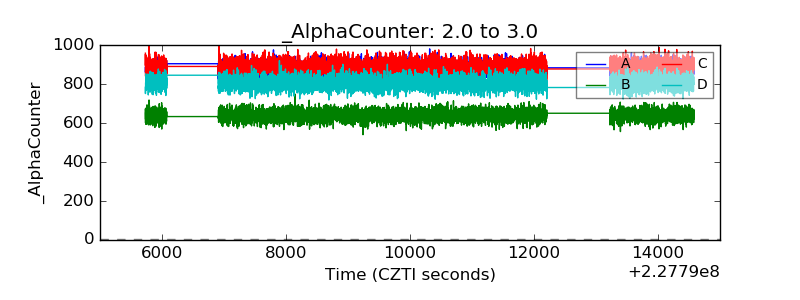 |
| _CPM_Rate | 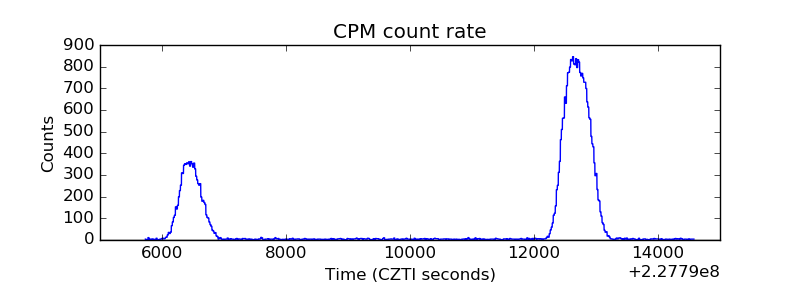 |
| CZT Counter |  |
| +2.5 Volts monitor |  |
| +5 Volts monitor |  |
| _ROLL_ROT | 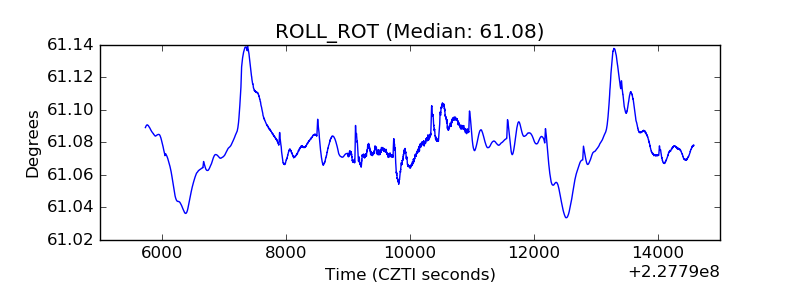 |
| _Roll_DEC | 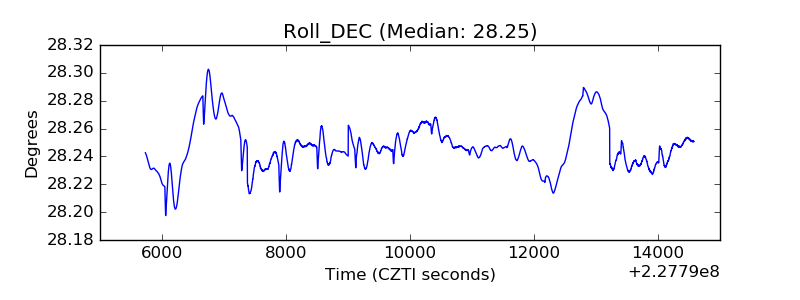 |
| _Roll_RA |  |
| Veto Counter | 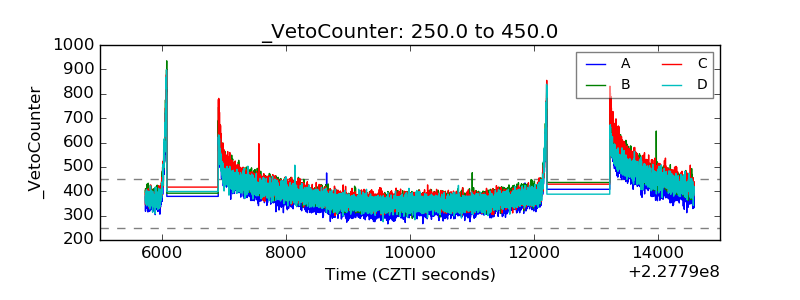 |