| Param | Original file | Final file |
|---|---|---|
| Filename | modeM0/AS1G06_138T03_9000001096_08003cztM0_level2.evt | modeM0/AS1G06_138T03_9000001096_08003cztM0_level2_quad_clean.evt |
| Size (bytes) | 163,575,360 | 31,933,440 |
| Size | 156.0 MB | 30.5 MB |
| Events in quadrant A | 1,034,578 | 205,485 |
| Events in quadrant B | 1,078,171 | 214,817 |
| Events in quadrant C | 1,063,173 | 212,887 |
| Events in quadrant D | 1,643,895 | 192,279 |
| Mode M0 | |||
|---|---|---|---|
| Quadrant | BADHDUFLAG | Total packets | Discarded packets |
| A | 0 | 4261 | 1 |
| B | 0 | 4403 | 1 |
| C | 0 | 4357 | 1 |
| D | 0 | 6211 | 1 |
| Mode SS | |||
|---|---|---|---|
| Quadrant | BADHDUFLAG | Total packets | Discarded packets |
| A | 0 | 42 | 0 |
| B | 0 | 42 | 0 |
| C | 0 | 42 | 0 |
| D | 0 | 42 | 0 |
| Mode M9 | |||
|---|---|---|---|
| Quadrant | BADHDUFLAG | Total packets | Discarded packets |
| A | 0 | 12 | 0 |
| B | 0 | 12 | 0 |
| C | 0 | 12 | 0 |
| D | 0 | 12 | 0 |
| Quadrant | Total seconds | Saturated seconds | Saturation percentage |
|---|---|---|---|
| A | 1932 | 26 | 1.345756% |
| B | 1932 | 34 | 1.759834% |
| C | 1932 | 23 | 1.190476% |
| D | 1932 | 165 | 8.540373% |
Noise dominated data is calculated using 1-second bins in cleaned event files. If a bin has >2000 counts, and if more than 50% of those come from <1% of pixels, then it is considered to be noise-dominated and hence unusable.
| Quadrant | # 1 sec bins | Bins with >0 counts | Bins with >2000 counts | High rate bins dominated by noise | Noise dominated (total time) | Noise dominated (detector-on time) | Marked lightcurve |
|---|---|---|---|---|---|---|---|
| A | 3202 | 1933 | 0 | 0 | 0.00% | 0.00% | 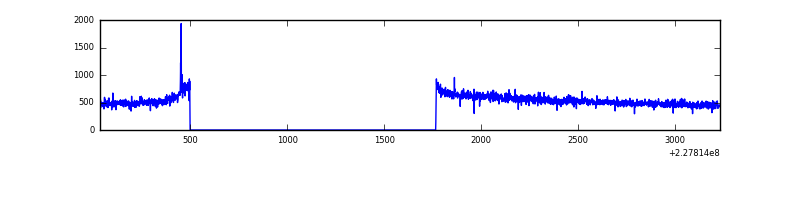 |
| B | 3202 | 1933 | 0 | 0 | 0.00% | 0.00% | 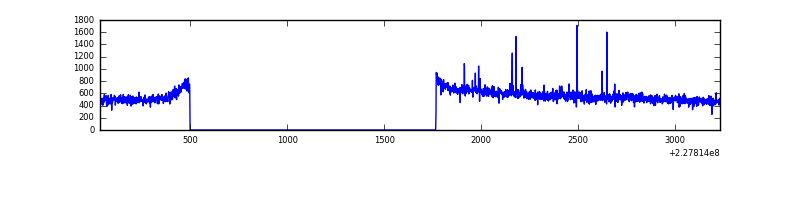 |
| C | 3202 | 1933 | 0 | 0 | 0.00% | 0.00% | 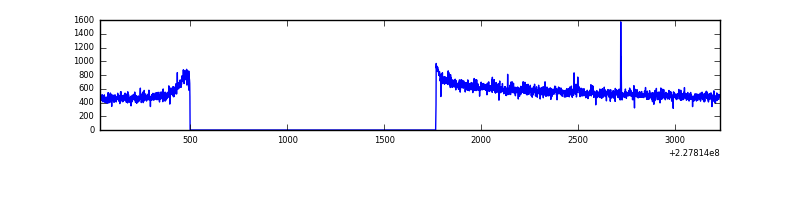 |
| D | 3202 | 1933 | 107 | 107 | 3.34% | 5.54% | 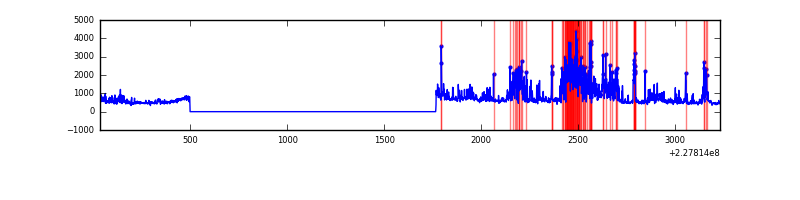 |
Top three noisy pixels from each quadrant. If the there are fewer than three noisy pixels in the level2.evt file, extra rows are filled as -1
| Pixel properties | Quadrant properties | ||||||
|---|---|---|---|---|---|---|---|
| Quadrant | DetID | PixID | Counts | Sigma | Mean | Median | Sigma |
| A | 15 | 234 | 4677 | 79.48 | 267 | 261 | 55.6 |
| A | 0 | 226 | 2437 | 39.17 | 267 | 261 | 55.6 |
| A | 12 | 194 | 2293 | 36.57 | 267 | 261 | 55.6 |
| B | 5 | 255 | 9637 | 177.38 | 271 | 265 | 52.8 |
| B | 11 | 51 | 7859 | 143.73 | 271 | 265 | 52.8 |
| B | 4 | 173 | 7704 | 140.8 | 271 | 265 | 52.8 |
| C | 1 | 16 | 5997 | 90.03 | 269 | 271 | 63.6 |
| C | 12 | 4 | 4828 | 71.65 | 269 | 271 | 63.6 |
| C | 13 | 61 | 2066 | 28.22 | 269 | 271 | 63.6 |
| D | 11 | 144 | 341517 | 5415.74 | 260 | 253 | 63.0 |
| D | 1 | 52 | 232751 | 3689.66 | 260 | 253 | 63.0 |
| D | 2 | 14 | 24098 | 378.41 | 260 | 253 | 63.0 |
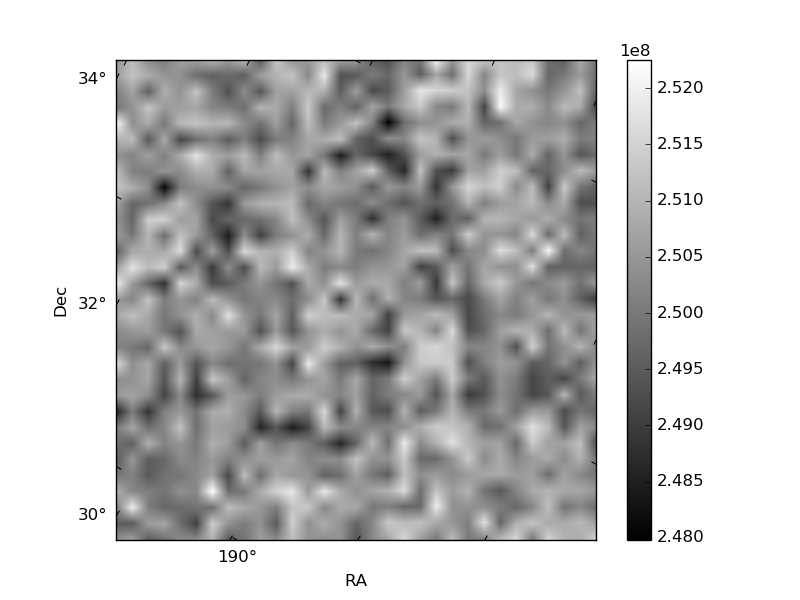
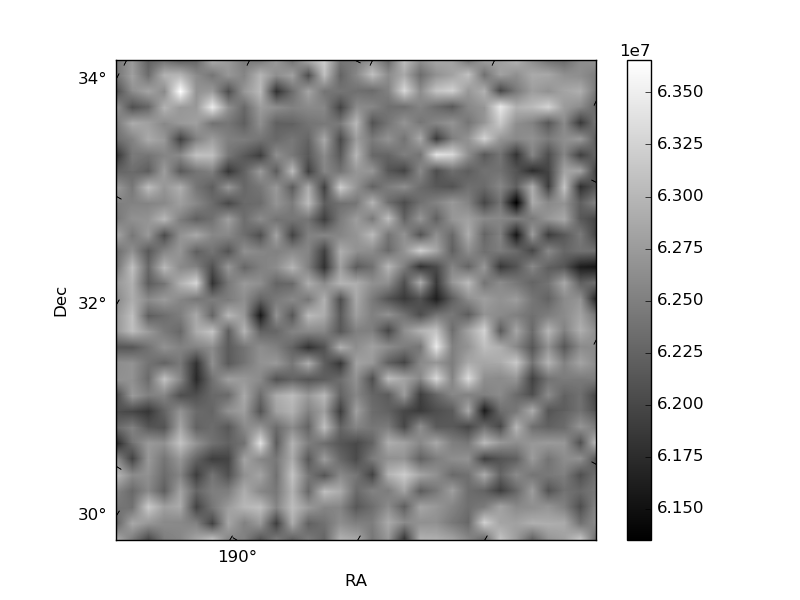
Histogram calculated using DETX and DETY for each event in the final _common_clean file
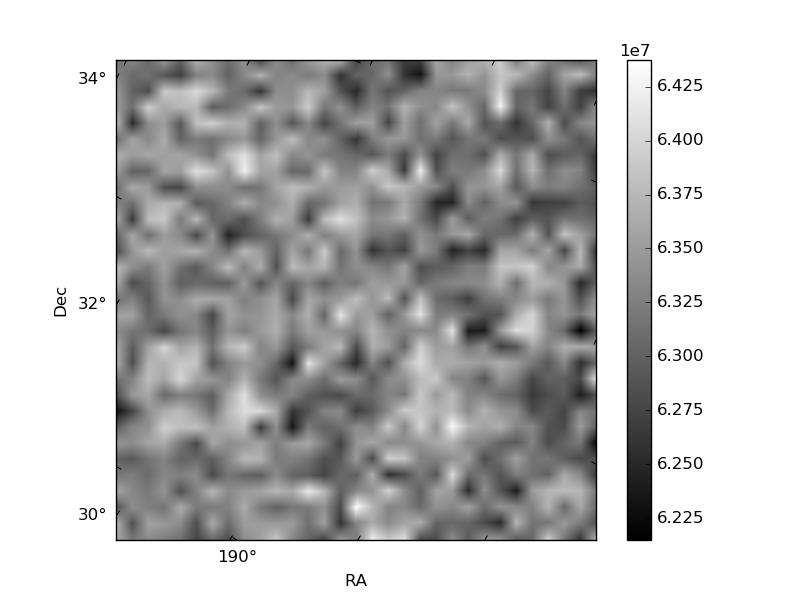
| Quadrant A | 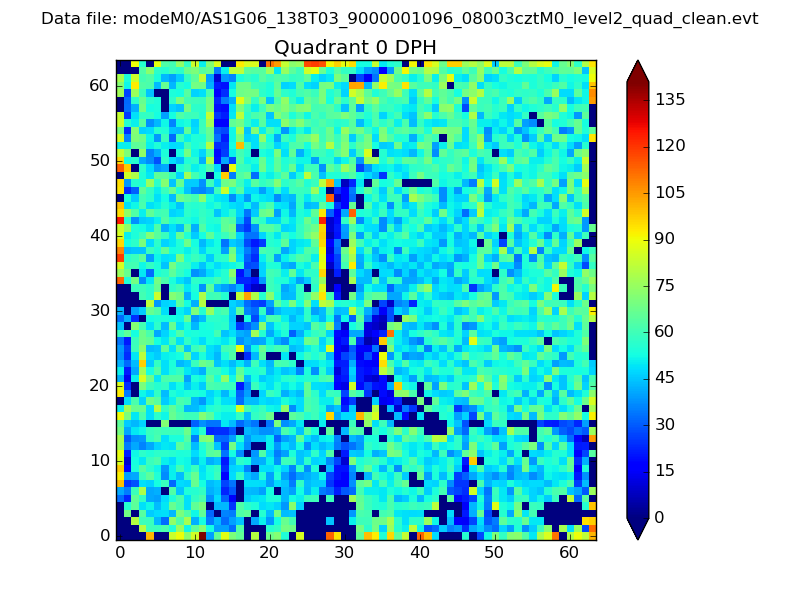 |
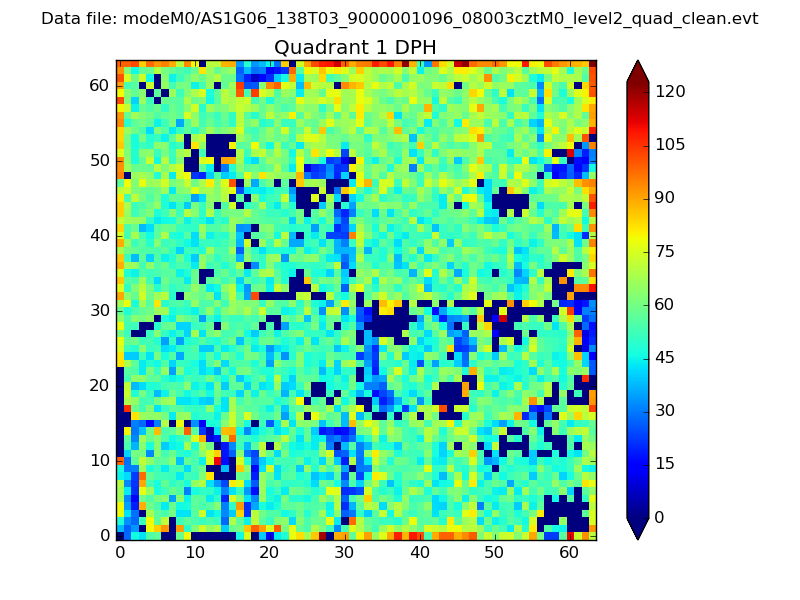 |
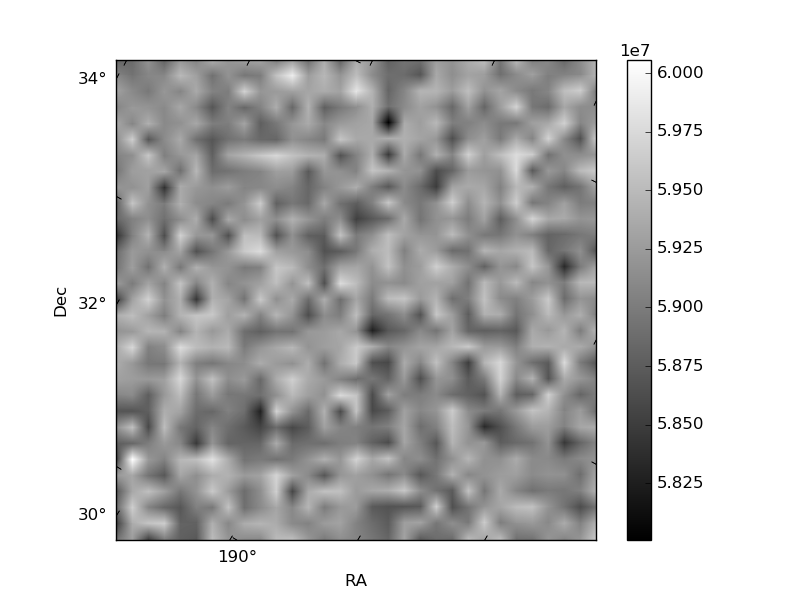
Quadrant B |
|---|---|---|---|
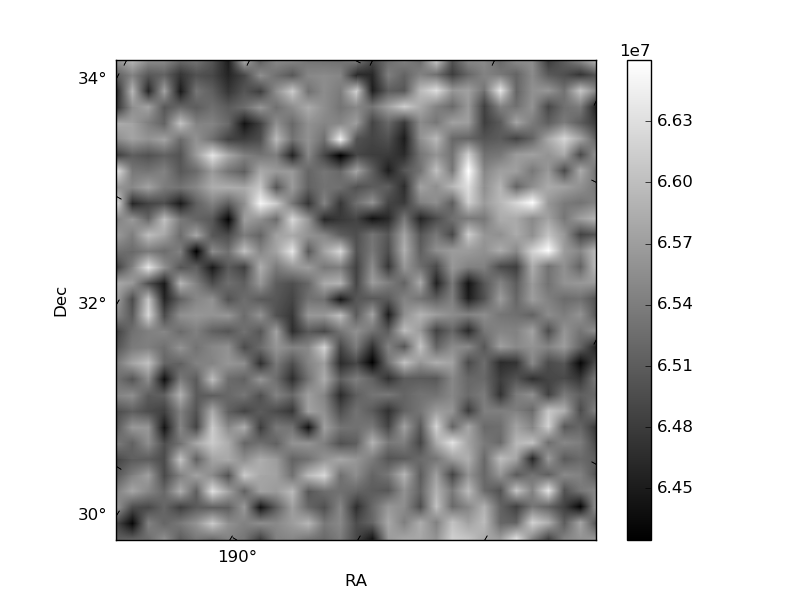
| Quadrant D | 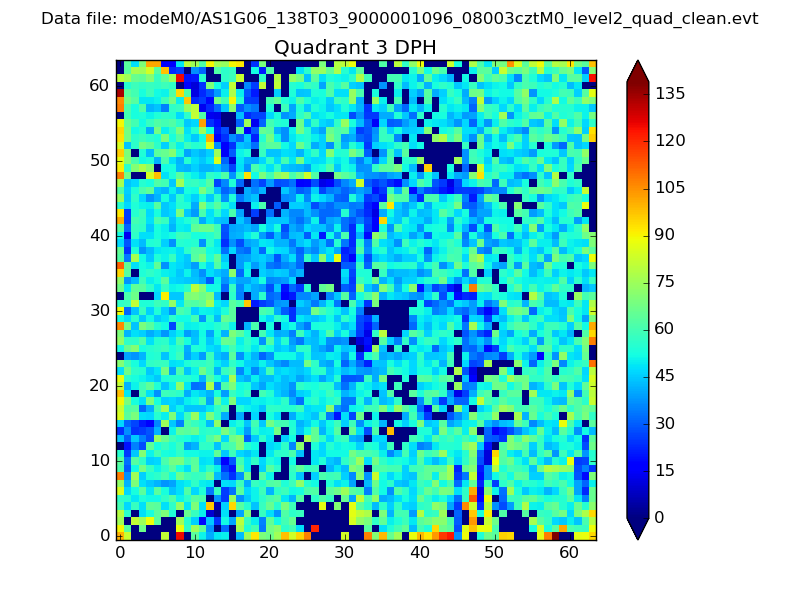 |
 |
Quadrant C |
| Plot type | Count rate plots | Images |
|---|---|---|
| Comparison with Poisson distribution Blue bars denote a histogram of data divided into 1 sec bins. Red curve is a Poisson curve with rate = median count rate of data. |
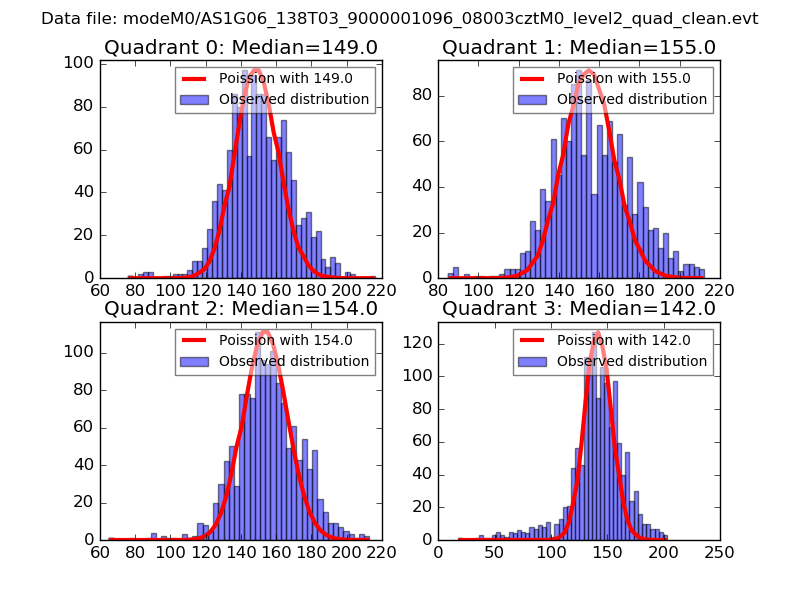 |
 |
| Quadrant-wise count rates Data is divided into 100 sec bins |
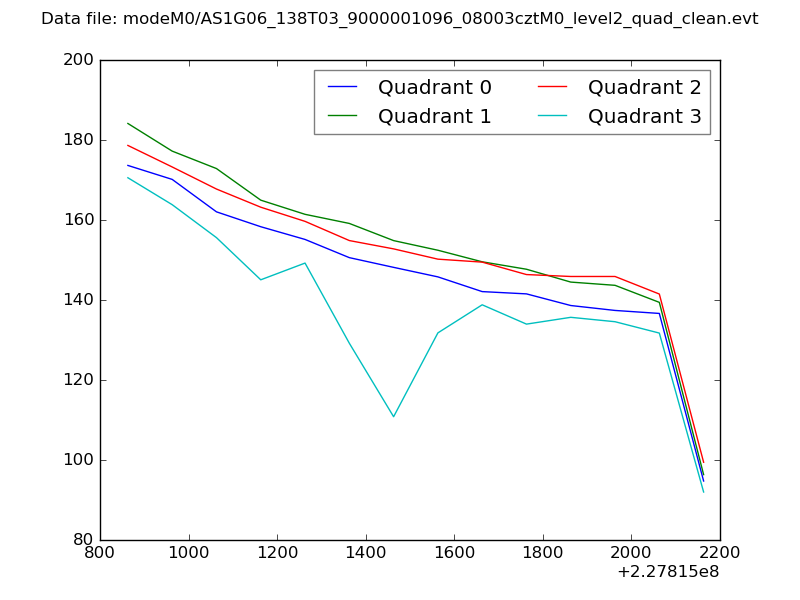 |
|
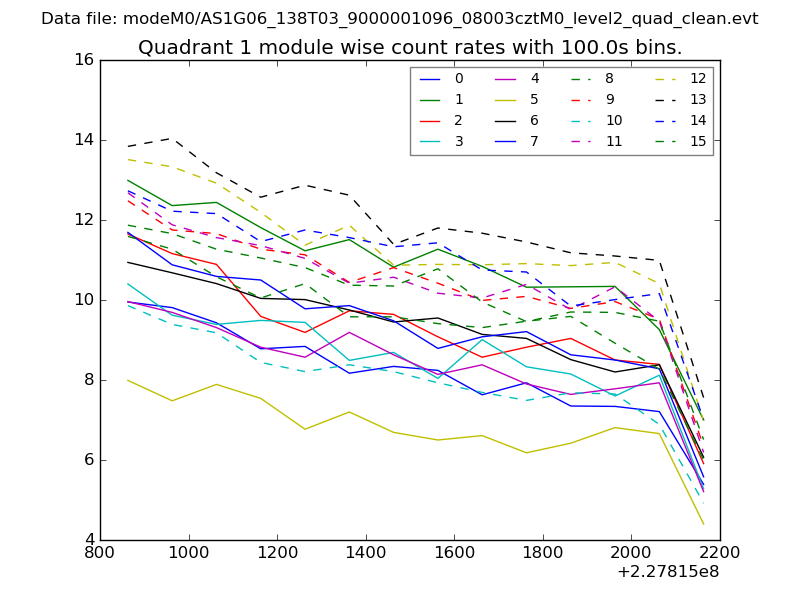
| Module-wise count rates for Quadrant A Data is divided into 100 sec bins |
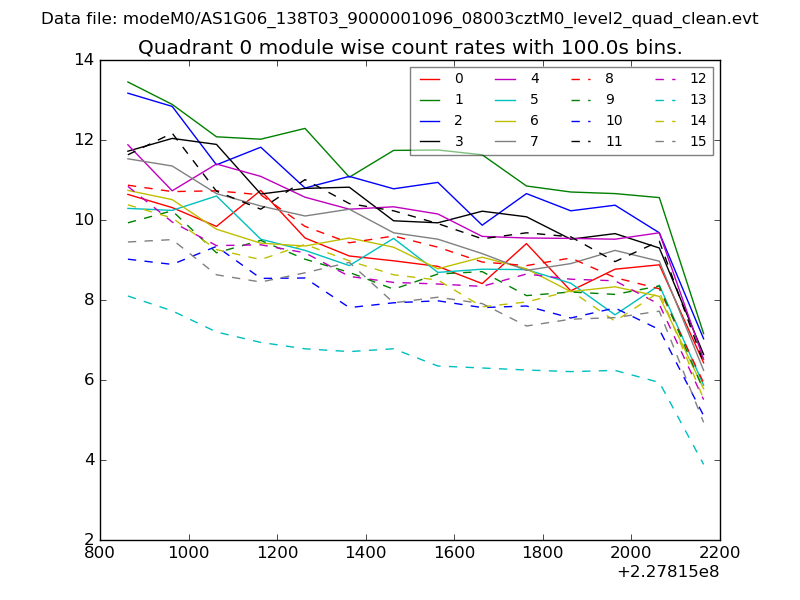 |
 |
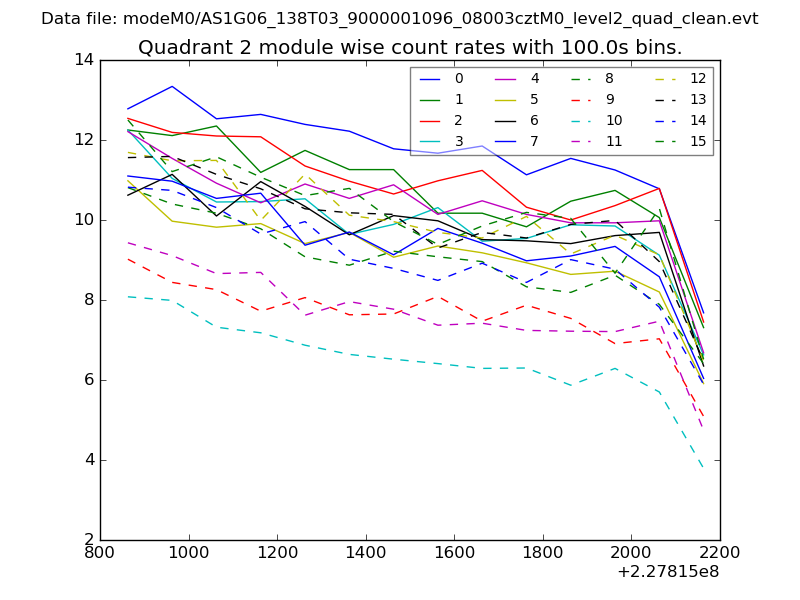
| Module-wise count rates for Quadrant B Data is divided into 100 sec bins |
 |
 |
| Module-wise count rates for Quadrant C Data is divided into 100 sec bins |
 |
 |
| Module-wise count rates for Quadrant D Data is divided into 100 sec bins |
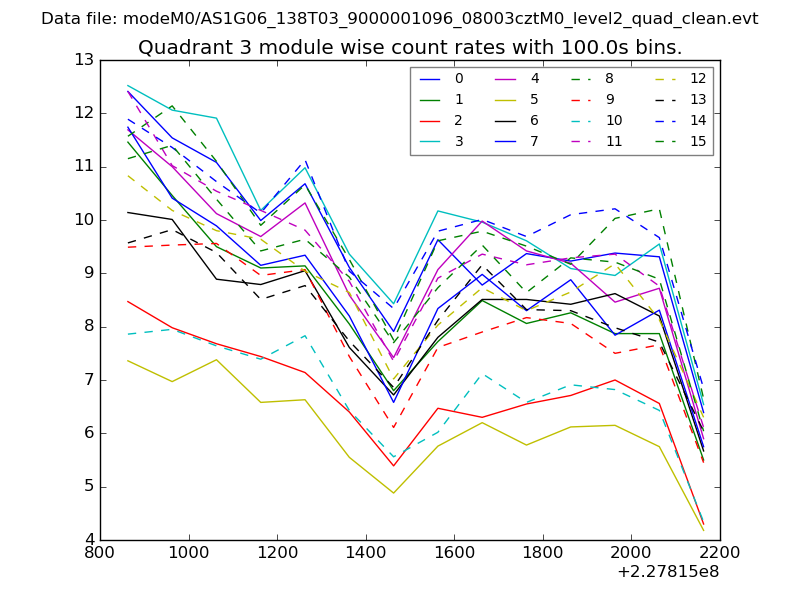 |
 |
| Parameter | Plot |
|---|---|
| CZT HV Monitor | 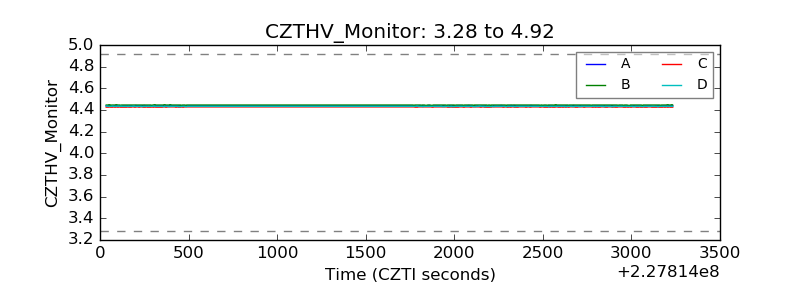 |
| D_VDD | 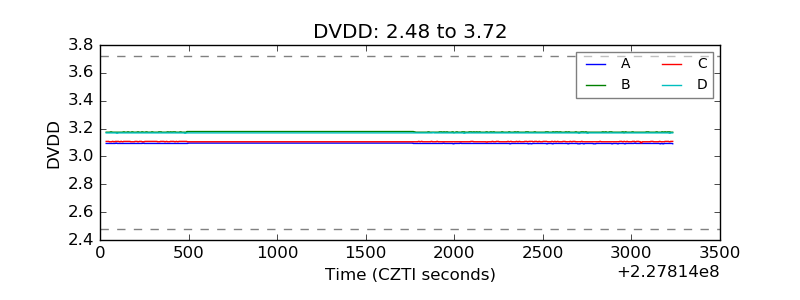 |
| Temperature 1 | 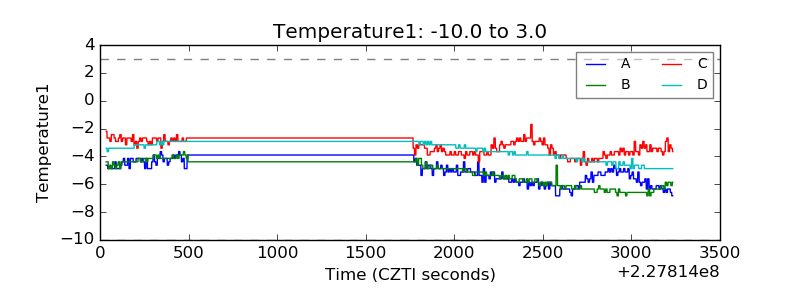 |
| Veto HV Monitor | 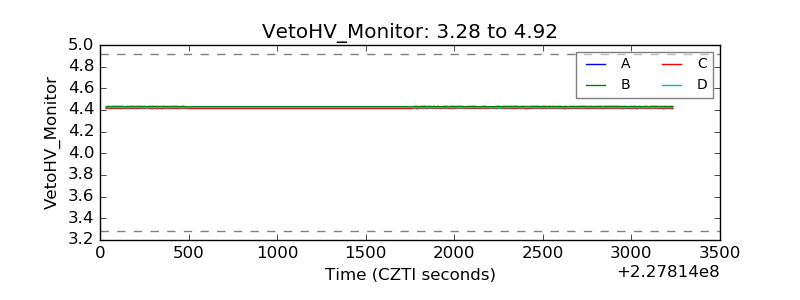 |
| Veto LLD | 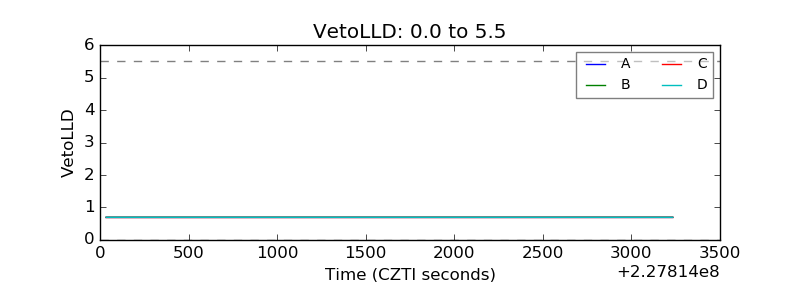 |
| Alpha Counter | 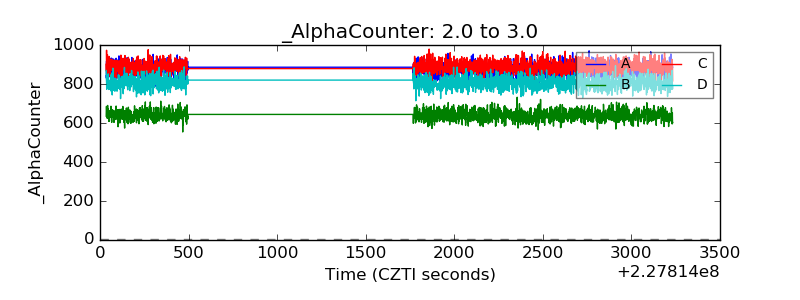 |
| _CPM_Rate | 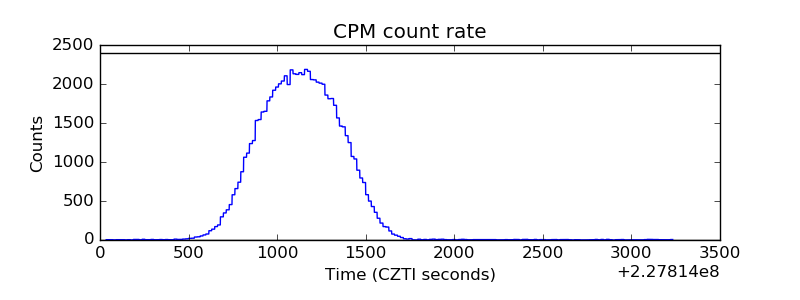 |
| CZT Counter |  |
| +2.5 Volts monitor |  |
| +5 Volts monitor |  |
| _ROLL_ROT | 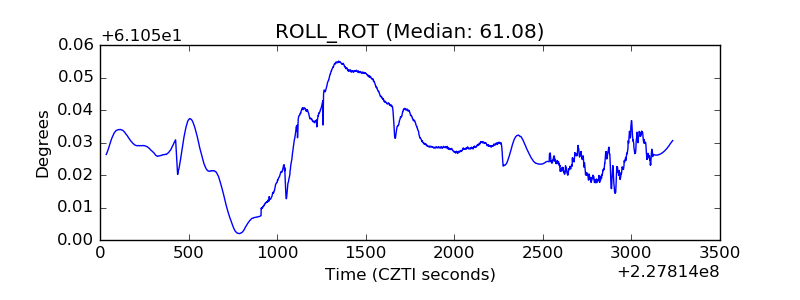 |
| _Roll_DEC | 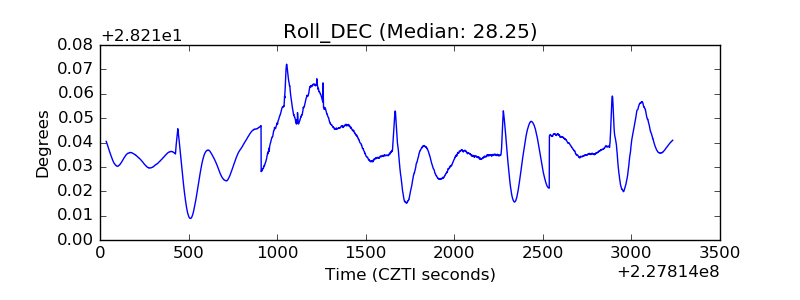 |
| _Roll_RA | 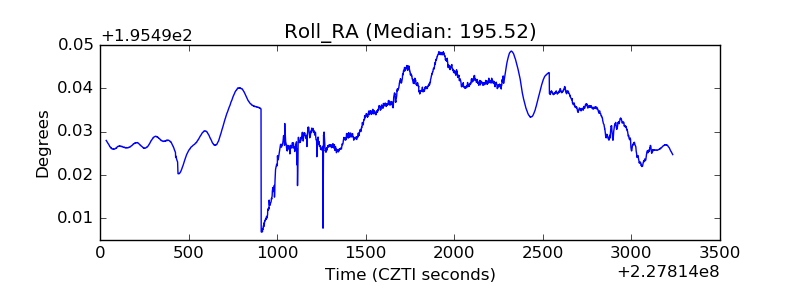 |
| Veto Counter | 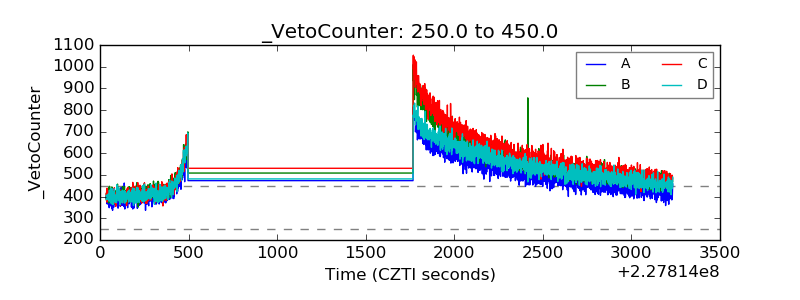 |