| Param | Original file | Final file |
|---|---|---|
| Filename | modeM0/AS1G06_154T01_9000001100cztM0_level2.fits | modeM0/AS1G06_154T01_9000001100cztM0_level2_quad_clean.evt |
| Size (bytes) | 489,320,640 | 483,914,880 |
| Size | 466.7 MB | 461.5 MB |
| Events in quadrant A | 2,914,806 | 2,831,433 |
| Events in quadrant B | 2,837,880 | 2,865,413 |
| Events in quadrant C | 2,921,528 | 2,767,210 |
| Events in quadrant D | 2,486,766 | 2,534,305 |
| Mode M9 | |||
|---|---|---|---|
| Quadrant | BADHDUFLAG | Total packets | Discarded packets |
| A | 0 | 56 | 0 |
| B | 0 | 56 | 0 |
| C | 0 | 56 | 0 |
| D | 0 | 56 | 0 |
| Mode SS | |||
|---|---|---|---|
| Quadrant | BADHDUFLAG | Total packets | Discarded packets |
| A | 0 | 1080 | 0 |
| B | 0 | 1080 | 0 |
| C | 0 | 1076 | 0 |
| D | 0 | 1080 | 0 |
| Mode M0 | |||
|---|---|---|---|
| Quadrant | BADHDUFLAG | Total packets | Discarded packets |
| A | 0 | 109809 | 0 |
| B | 0 | 111103 | 0 |
| C | 0 | 109337 | 0 |
| D | 0 | 129940 | 0 |
| Quadrant | Total seconds | Saturated seconds | Saturation percentage |
|---|---|---|---|
| A | 53334 | 843 | 1.580605% |
| B | 53309 | 931 | 1.746422% |
| C | 53324 | 500 | 0.937664% |
| D | 53310 | 1925 | 3.610955% |
Noise dominated data is calculated using 1-second bins in cleaned event files. If a bin has >2000 counts, and if more than 50% of those come from <1% of pixels, then it is considered to be noise-dominated and hence unusable.
| Quadrant | # 1 sec bins | Bins with >0 counts | Bins with >2000 counts | High rate bins dominated by noise | Noise dominated (total time) | Noise dominated (detector-on time) | Marked lightcurve |
|---|---|---|---|---|---|---|---|
| A | 59482 | 53162 | 0 | 0 | 0.00% | 0.00% | 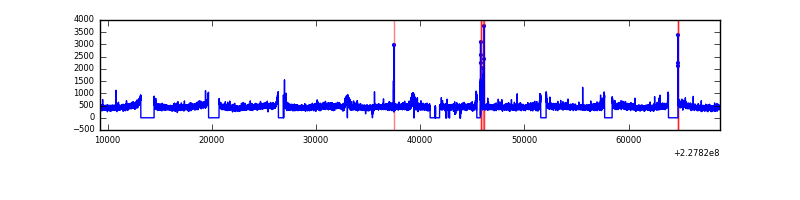 |
| B | 59482 | 53153 | 0 | 0 | 0.00% | 0.00% |  |
| C | 59482 | 53167 | 0 | 0 | 0.00% | 0.00% |  |
| D | 59482 | 53118 | 0 | 0 | 0.00% | 0.00% |  |
Top three noisy pixels from each quadrant. If the there are fewer than three noisy pixels in the level2.evt file, extra rows are filled as -1
| Pixel properties | Quadrant properties | ||||||
|---|---|---|---|---|---|---|---|
| Quadrant | DetID | PixID | Counts | Sigma | Mean | Median | Sigma |
| A | 0 | 29 | 2846 | 10.9 | 756 | 702 | 196.7 |
| A | 7 | 110 | 2369 | 8.47 | 756 | 702 | 196.7 |
| A | 0 | 30 | 2222 | 7.73 | 756 | 702 | 196.7 |
| B | 2 | 9 | 2516 | 11.8 | 747 | 705 | 153.4 |
| B | 2 | 8 | 1961 | 8.19 | 747 | 705 | 153.4 |
| B | 3 | 17 | 1905 | 7.82 | 747 | 705 | 153.4 |
| C | 12 | 241 | 2132 | 6.91 | 771 | 709 | 205.8 |
| C | 1 | 80 | 2073 | 6.63 | 771 | 709 | 205.8 |
| C | 1 | 81 | 2028 | 6.41 | 771 | 709 | 205.8 |
| D | 3 | 14 | 1927 | 6.85 | 705 | 639 | 188.2 |
| D | 3 | 31 | 1812 | 6.23 | 705 | 639 | 188.2 |
| D | 6 | 231 | 1807 | 6.21 | 705 | 639 | 188.2 |
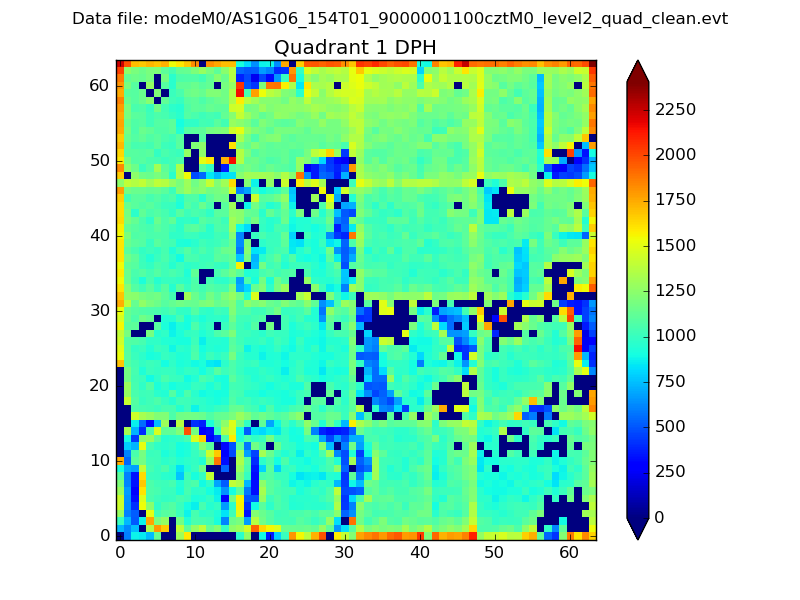
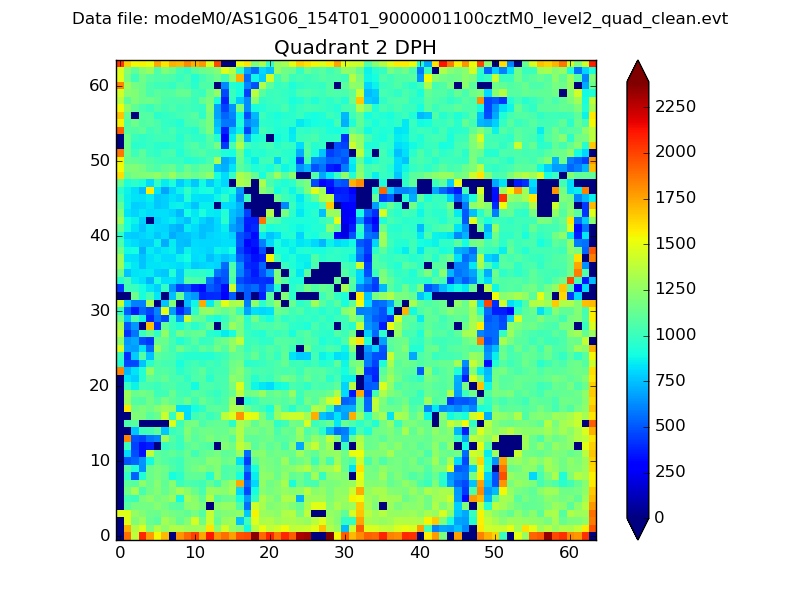
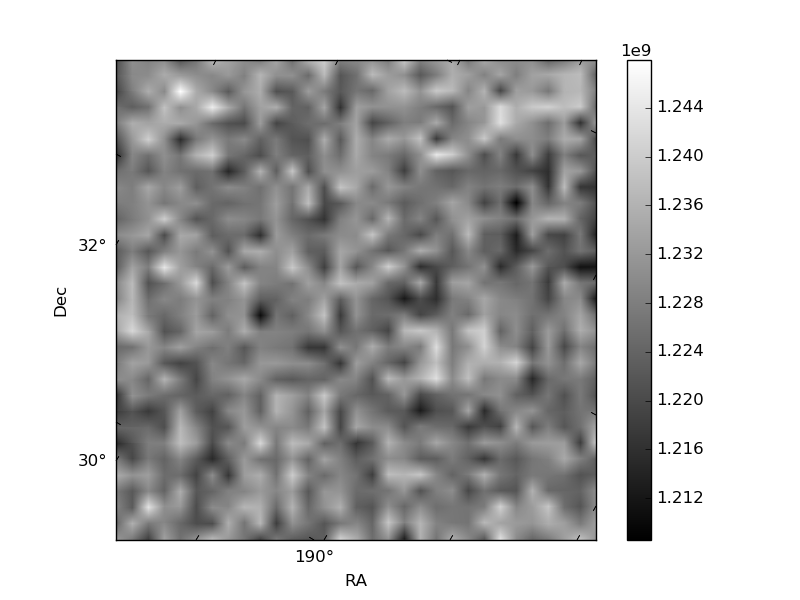
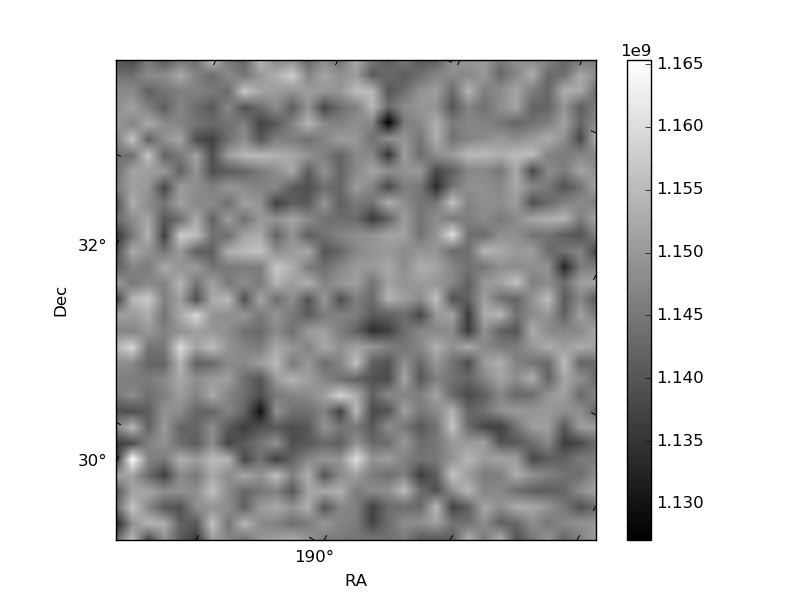
Histogram calculated using DETX and DETY for each event in the final _common_clean file
| Quadrant A |  |
 |
Quadrant B |
|---|---|---|---|
| Quadrant D | 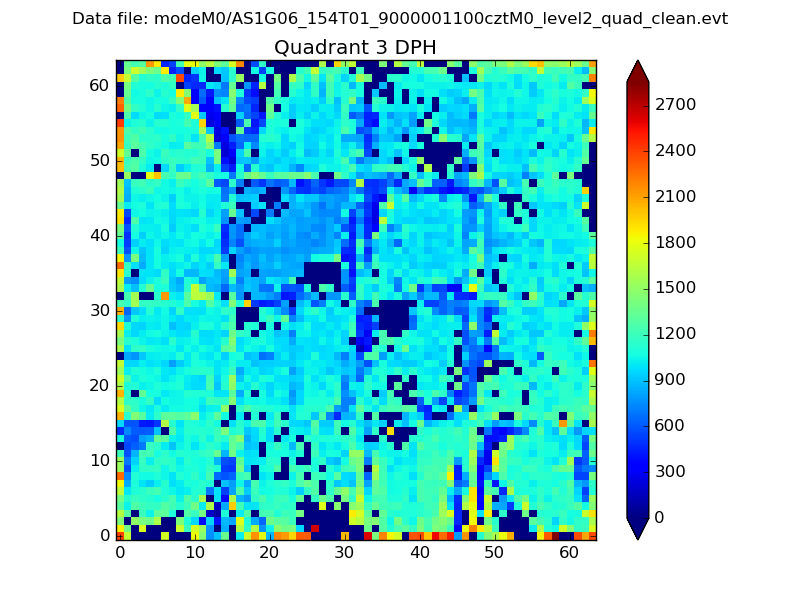 |
 |
Quadrant C |
| Plot type | Count rate plots | Images |
|---|---|---|
| Comparison with Poisson distribution Blue bars denote a histogram of data divided into 1 sec bins. Red curve is a Poisson curve with rate = median count rate of data. |
 |
 |
| Quadrant-wise count rates Data is divided into 100 sec bins |
 |
|
| Module-wise count rates for Quadrant A Data is divided into 100 sec bins |
 |
 |
| Module-wise count rates for Quadrant B Data is divided into 100 sec bins |
 |
 |
| Module-wise count rates for Quadrant C Data is divided into 100 sec bins |
 |
 |
| Module-wise count rates for Quadrant D Data is divided into 100 sec bins |
 |
 |
| Parameter | Plot |
|---|---|
| CZT HV Monitor |  |
| D_VDD | 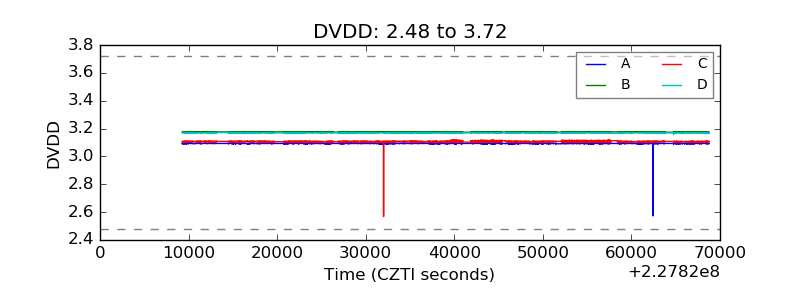 |
| Temperature 1 | 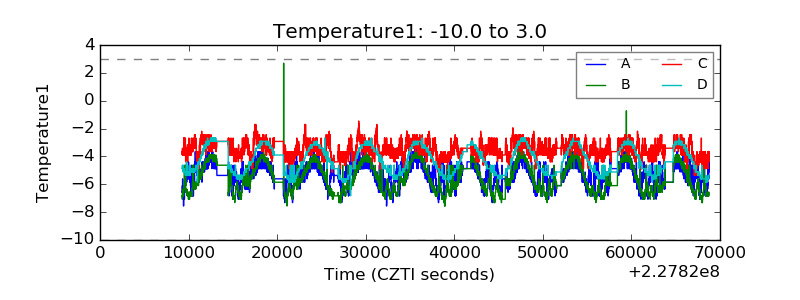 |
| Veto HV Monitor |  |
| Veto LLD |  |
| Alpha Counter |  |
| _CPM_Rate |  |
| CZT Counter |  |
| +2.5 Volts monitor |  |
| +5 Volts monitor |  |
| _ROLL_ROT | 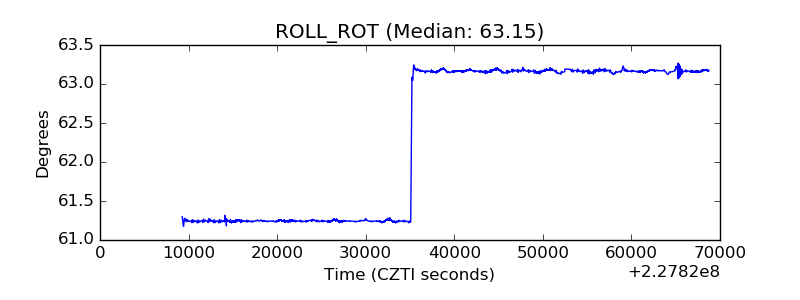 |
| _Roll_DEC |  |
| _Roll_RA |  |
| Veto Counter |  |