| Param | Original file | Final file |
|---|---|---|
| Filename | modeM0/AS1G06_154T01_9000001100_08005cztM0_level2.evt | modeM0/AS1G06_154T01_9000001100_08005cztM0_level2_quad_clean.evt |
| Size (bytes) | 359,677,440 | 67,798,080 |
| Size | 343.0 MB | 64.7 MB |
| Events in quadrant A | 2,429,261 | 416,392 |
| Events in quadrant B | 2,580,024 | 428,551 |
| Events in quadrant C | 2,442,765 | 432,079 |
| Events in quadrant D | 3,078,817 | 403,830 |
| Mode M9 | |||
|---|---|---|---|
| Quadrant | BADHDUFLAG | Total packets | Discarded packets |
| A | 0 | 13 | 0 |
| B | 0 | 13 | 0 |
| C | 0 | 13 | 0 |
| D | 0 | 13 | 0 |
| Mode SS | |||
|---|---|---|---|
| Quadrant | BADHDUFLAG | Total packets | Discarded packets |
| A | 0 | 108 | 0 |
| B | 0 | 108 | 0 |
| C | 0 | 108 | 0 |
| D | 0 | 108 | 0 |
| Mode M0 | |||
|---|---|---|---|
| Quadrant | BADHDUFLAG | Total packets | Discarded packets |
| A | 0 | 10949 | 2 |
| B | 0 | 11237 | 1 |
| C | 0 | 10949 | 1 |
| D | 0 | 12861 | 1 |
| Quadrant | Total seconds | Saturated seconds | Saturation percentage |
|---|---|---|---|
| A | 5313 | 18 | 0.338792% |
| B | 5313 | 46 | 0.865801% |
| C | 5313 | 12 | 0.225861% |
| D | 5313 | 138 | 2.597403% |
Noise dominated data is calculated using 1-second bins in cleaned event files. If a bin has >2000 counts, and if more than 50% of those come from <1% of pixels, then it is considered to be noise-dominated and hence unusable.
| Quadrant | # 1 sec bins | Bins with >0 counts | Bins with >2000 counts | High rate bins dominated by noise | Noise dominated (total time) | Noise dominated (detector-on time) | Marked lightcurve |
|---|---|---|---|---|---|---|---|
| A | 6593 | 5314 | 0 | 0 | 0.00% | 0.00% | 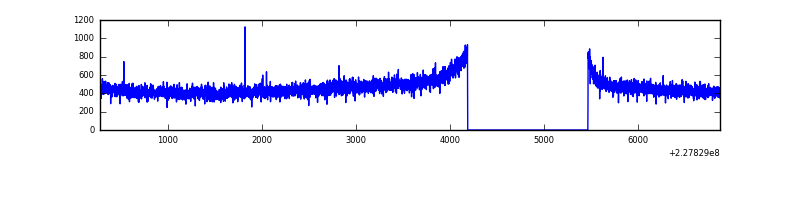 |
| B | 6593 | 5314 | 11 | 11 | 0.17% | 0.21% | 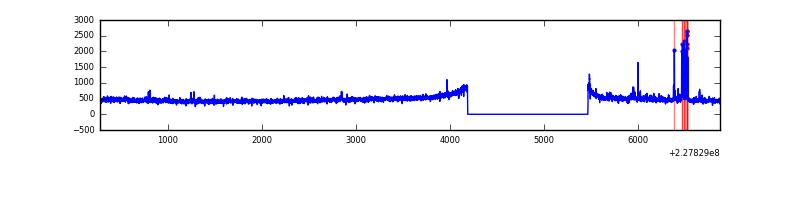 |
| C | 6593 | 5314 | 0 | 0 | 0.00% | 0.00% |  |
| D | 6593 | 5314 | 100 | 100 | 1.52% | 1.88% | 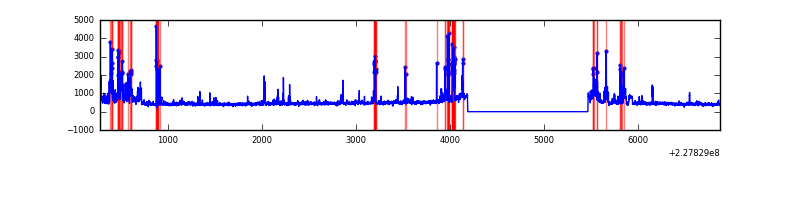 |
Top three noisy pixels from each quadrant. If the there are fewer than three noisy pixels in the level2.evt file, extra rows are filled as -1
| Pixel properties | Quadrant properties | ||||||
|---|---|---|---|---|---|---|---|
| Quadrant | DetID | PixID | Counts | Sigma | Mean | Median | Sigma |
| A | 0 | 226 | 5843 | 40.64 | 629 | 616 | 128.6 |
| A | 12 | 194 | 5276 | 36.24 | 629 | 616 | 128.6 |
| A | 13 | 14 | 4293 | 28.59 | 629 | 616 | 128.6 |
| B | 5 | 255 | 68776 | 562.95 | 637 | 623 | 121.1 |
| B | 5 | 250 | 25489 | 205.4 | 637 | 623 | 121.1 |
| B | 12 | 111 | 13525 | 106.57 | 637 | 623 | 121.1 |
| C | 1 | 16 | 11608 | 75.82 | 622 | 626 | 144.8 |
| C | 13 | 61 | 4892 | 29.45 | 622 | 626 | 144.8 |
| C | 14 | 67 | 2696 | 14.29 | 622 | 626 | 144.8 |
| D | 11 | 144 | 206742 | 1371.45 | 609 | 590 | 150.3 |
| D | 2 | 14 | 201855 | 1338.94 | 609 | 590 | 150.3 |
| D | 1 | 52 | 162475 | 1076.96 | 609 | 590 | 150.3 |
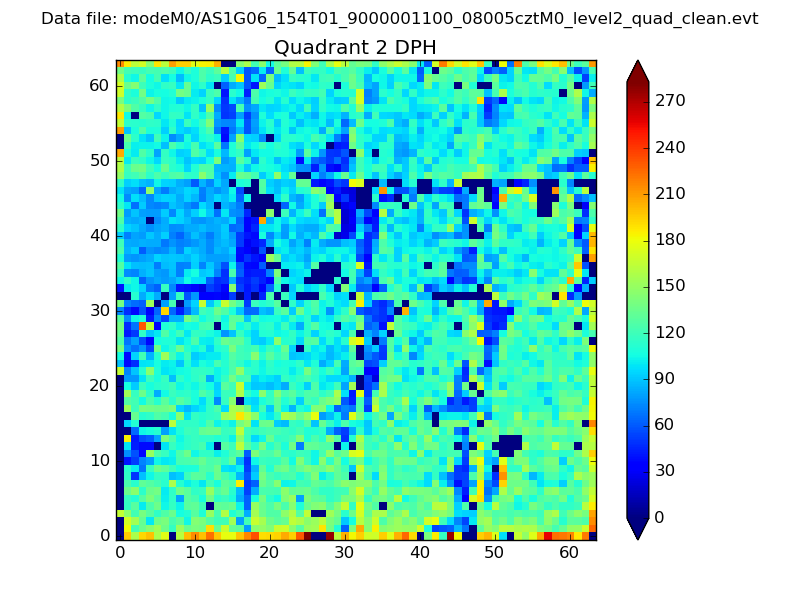
Histogram calculated using DETX and DETY for each event in the final _common_clean file
| Quadrant A |  |
 |
Quadrant B |
|---|---|---|---|
| Quadrant D |  |
 |
Quadrant C |
| Plot type | Count rate plots | Images |
|---|---|---|
| Comparison with Poisson distribution Blue bars denote a histogram of data divided into 1 sec bins. Red curve is a Poisson curve with rate = median count rate of data. |
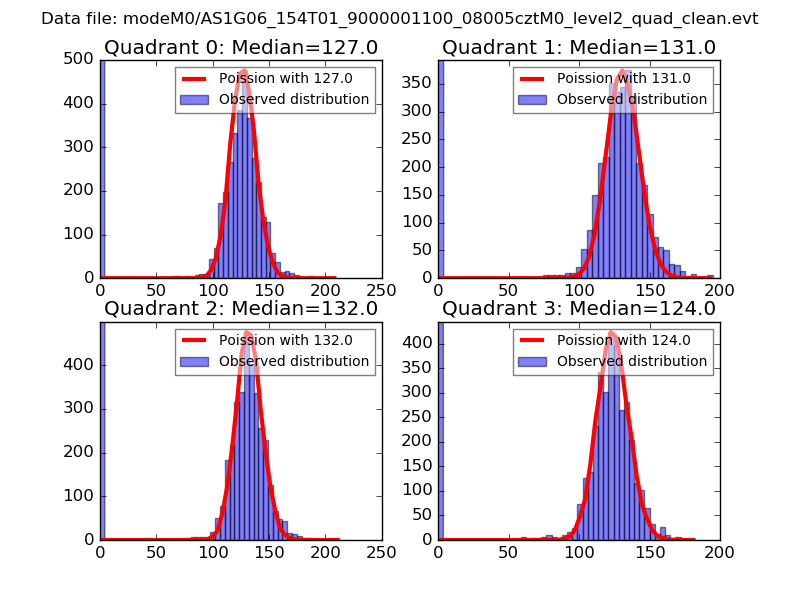 |
 |
| Quadrant-wise count rates Data is divided into 100 sec bins |
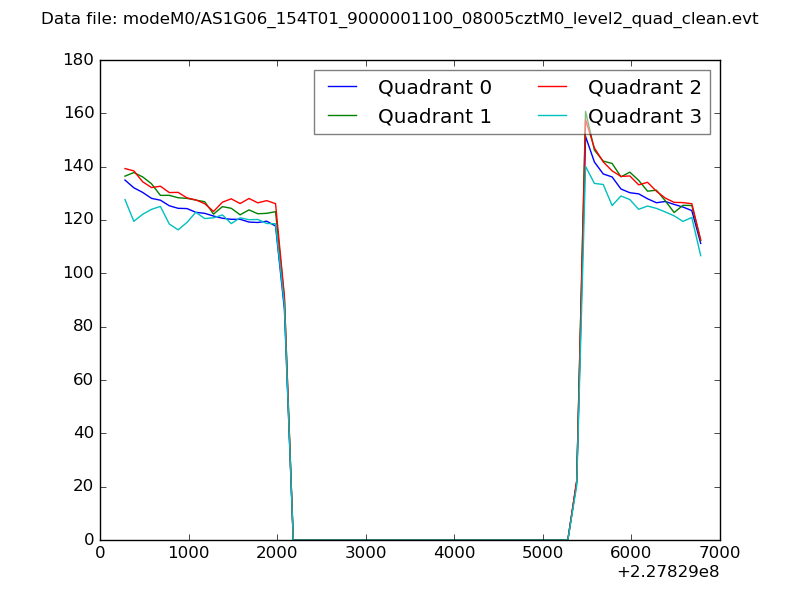 |
|
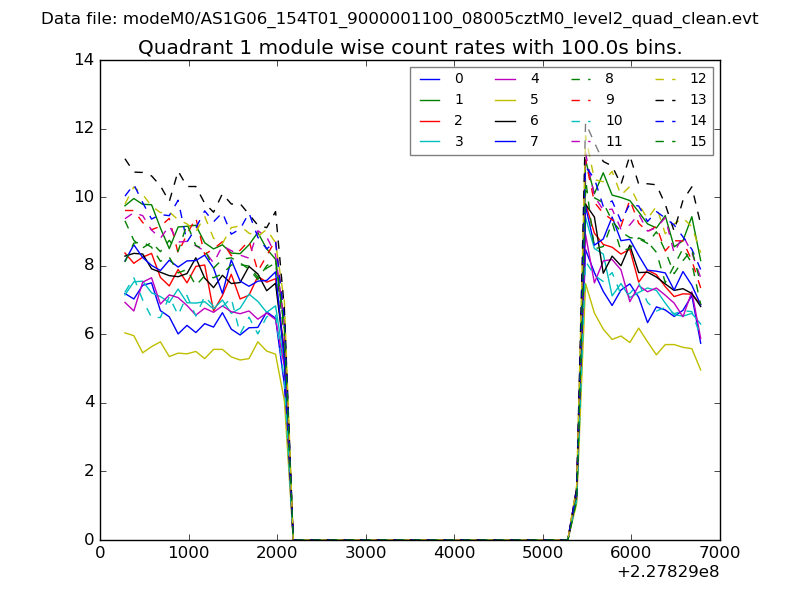
| Module-wise count rates for Quadrant A Data is divided into 100 sec bins |
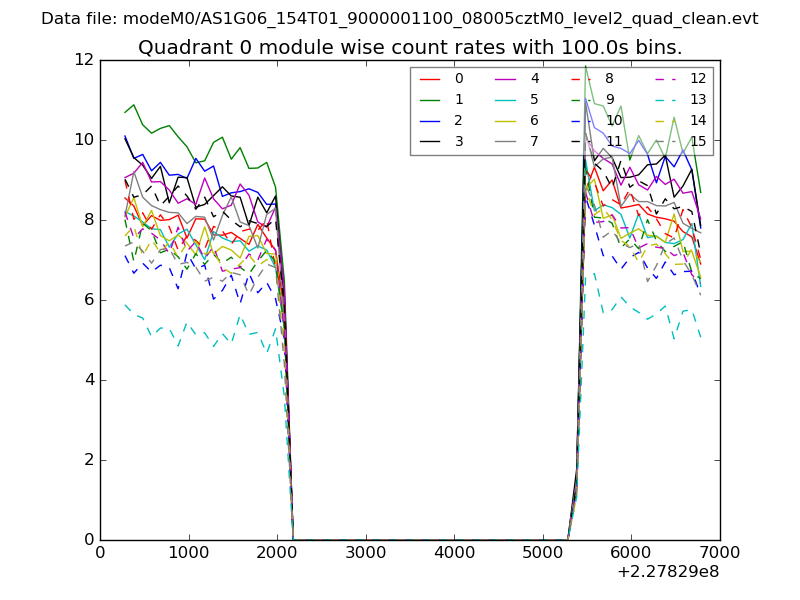 |
 |
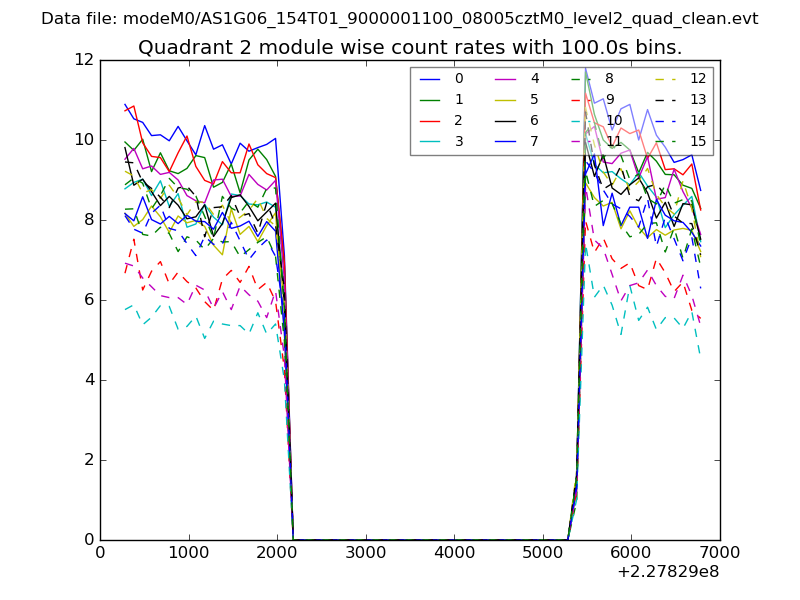
| Module-wise count rates for Quadrant B Data is divided into 100 sec bins |
 |
 |
| Module-wise count rates for Quadrant C Data is divided into 100 sec bins |
 |
 |
| Module-wise count rates for Quadrant D Data is divided into 100 sec bins |
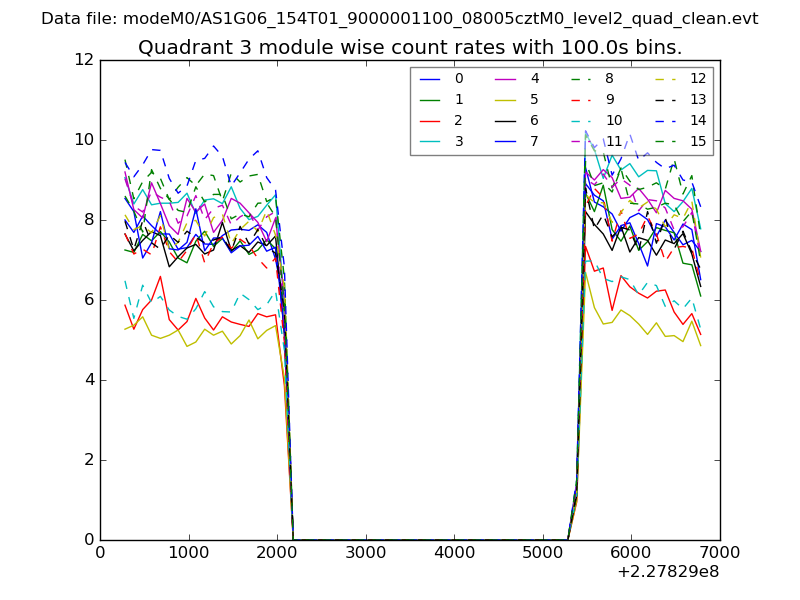 |
 |
| Parameter | Plot |
|---|---|
| CZT HV Monitor | 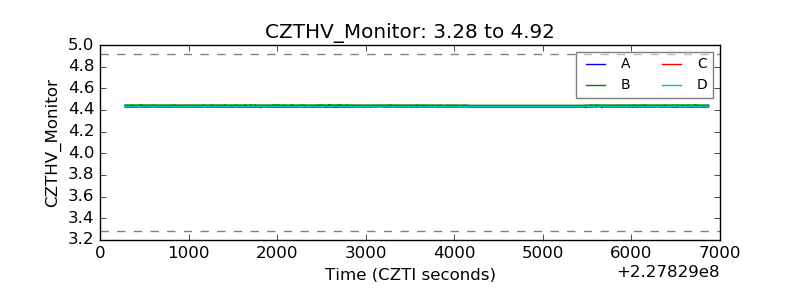 |
| D_VDD | 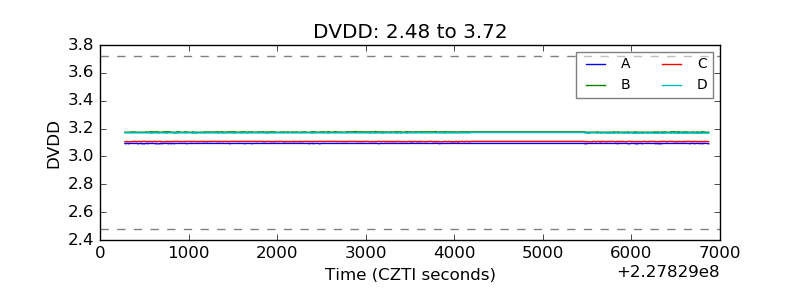 |
| Temperature 1 | 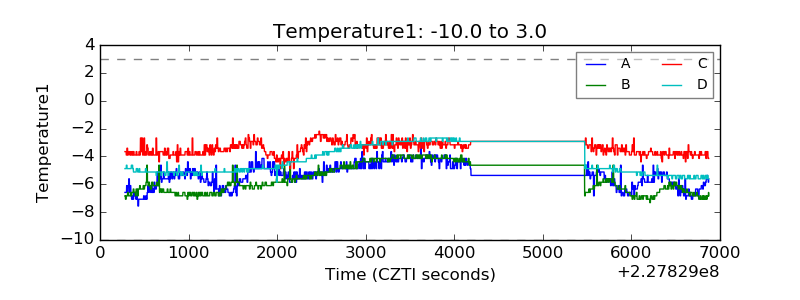 |
| Veto HV Monitor | 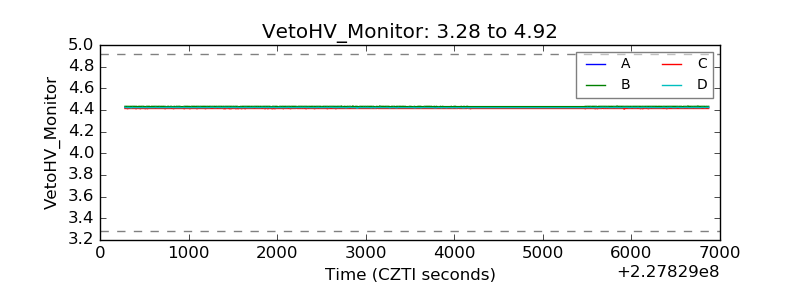 |
| Veto LLD | 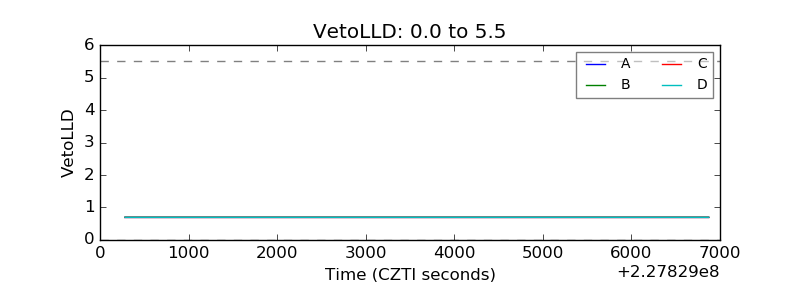 |
| Alpha Counter | 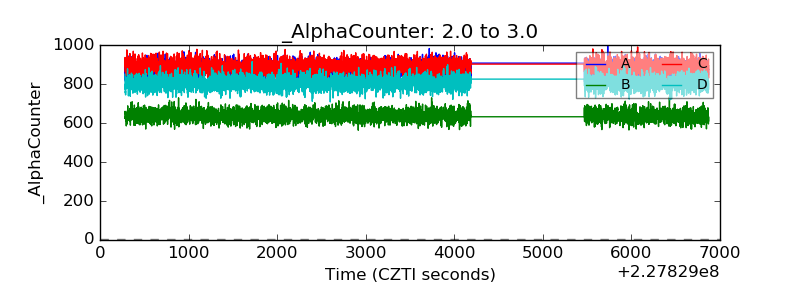 |
| _CPM_Rate | 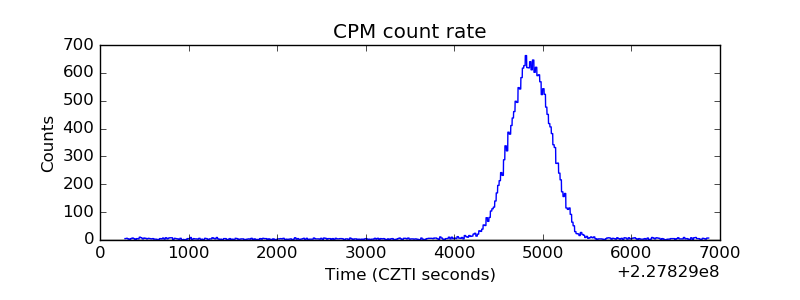 |
| CZT Counter | 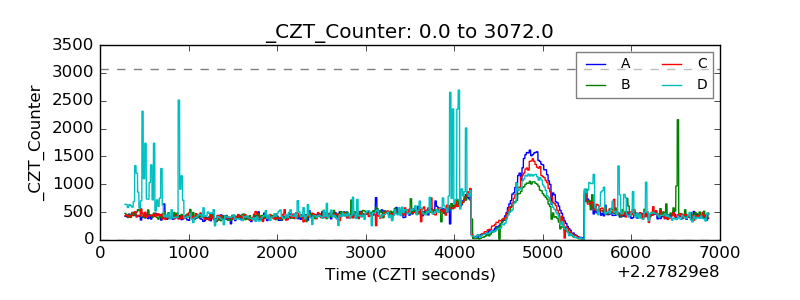 |
| +2.5 Volts monitor |  |
| +5 Volts monitor |  |
| _ROLL_ROT | 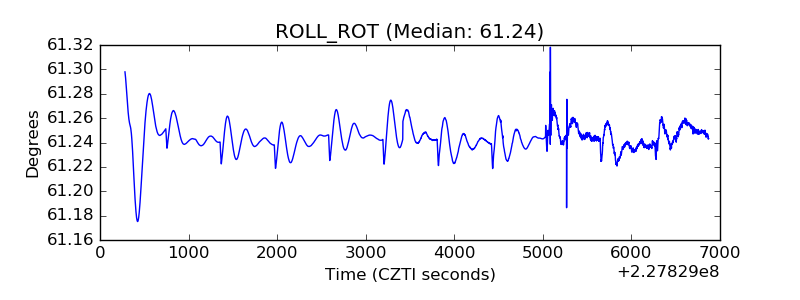 |
| _Roll_DEC | 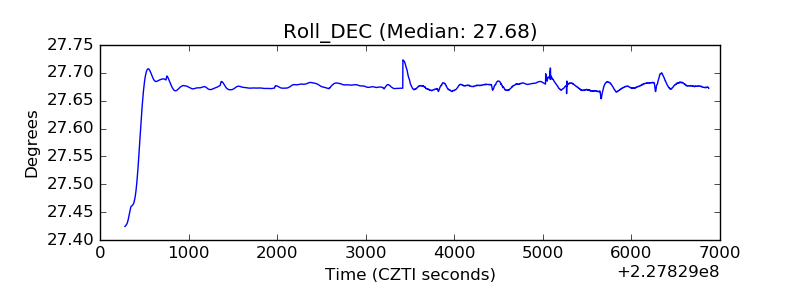 |
| _Roll_RA | 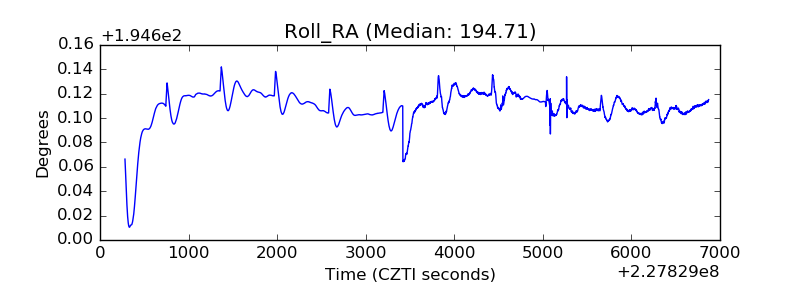 |
| Veto Counter | 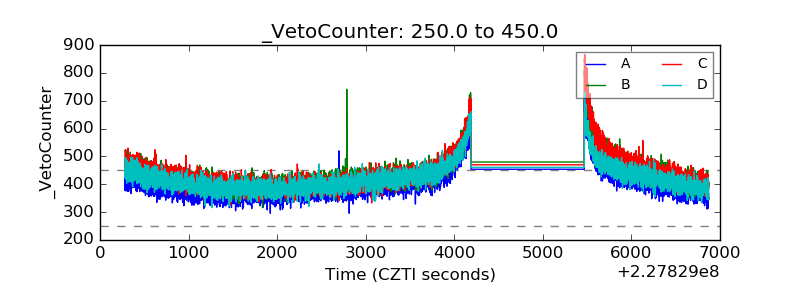 |