| Param | Original file | Final file |
|---|---|---|
| Filename | modeM0/AS1G06_154T01_9000001100_08006cztM0_level2.evt | modeM0/AS1G06_154T01_9000001100_08006cztM0_level2_quad_clean.evt |
| Size (bytes) | 441,031,680 | 88,202,880 |
| Size | 420.6 MB | 84.1 MB |
| Events in quadrant A | 3,011,509 | 549,267 |
| Events in quadrant B | 3,373,760 | 564,910 |
| Events in quadrant C | 3,029,897 | 566,320 |
| Events in quadrant D | 3,493,555 | 531,180 |
| Mode M9 | |||
|---|---|---|---|
| Quadrant | BADHDUFLAG | Total packets | Discarded packets |
| A | 0 | 15 | 0 |
| B | 0 | 15 | 0 |
| C | 0 | 15 | 0 |
| D | 0 | 16 | 0 |
| Mode SS | |||
|---|---|---|---|
| Quadrant | BADHDUFLAG | Total packets | Discarded packets |
| A | 0 | 132 | 0 |
| B | 0 | 132 | 0 |
| C | 0 | 132 | 0 |
| D | 0 | 132 | 0 |
| Mode M0 | |||
|---|---|---|---|
| Quadrant | BADHDUFLAG | Total packets | Discarded packets |
| A | 0 | 13554 | 3 |
| B | 0 | 14425 | 2 |
| C | 0 | 13605 | 2 |
| D | 0 | 15115 | 2 |
| Quadrant | Total seconds | Saturated seconds | Saturation percentage |
|---|---|---|---|
| A | 6594 | 18 | 0.272975% |
| B | 6594 | 75 | 1.137398% |
| C | 6594 | 9 | 0.136488% |
| D | 6594 | 127 | 1.925993% |
Noise dominated data is calculated using 1-second bins in cleaned event files. If a bin has >2000 counts, and if more than 50% of those come from <1% of pixels, then it is considered to be noise-dominated and hence unusable.
| Quadrant | # 1 sec bins | Bins with >0 counts | Bins with >2000 counts | High rate bins dominated by noise | Noise dominated (total time) | Noise dominated (detector-on time) | Marked lightcurve |
|---|---|---|---|---|---|---|---|
| A | 7599 | 6595 | 0 | 0 | 0.00% | 0.00% | 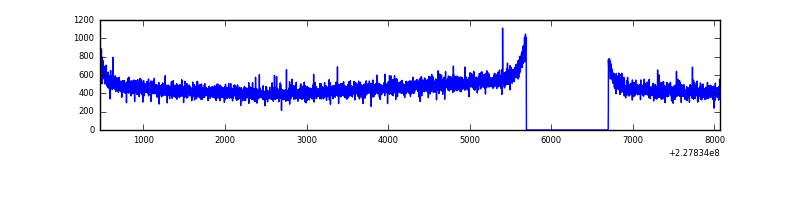 |
| B | 7599 | 6595 | 40 | 40 | 0.53% | 0.61% | 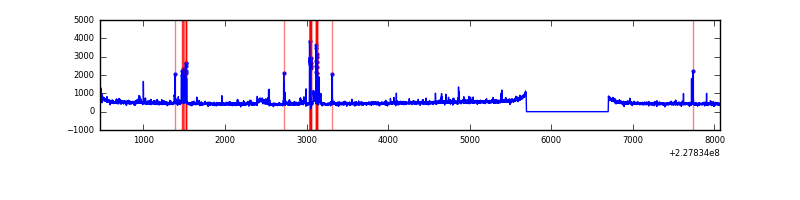 |
| C | 7599 | 6595 | 0 | 0 | 0.00% | 0.00% | 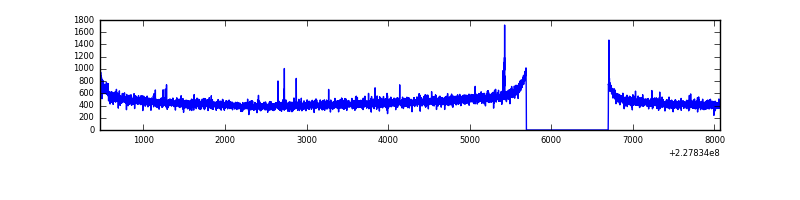 |
| D | 7599 | 6595 | 90 | 90 | 1.18% | 1.36% | 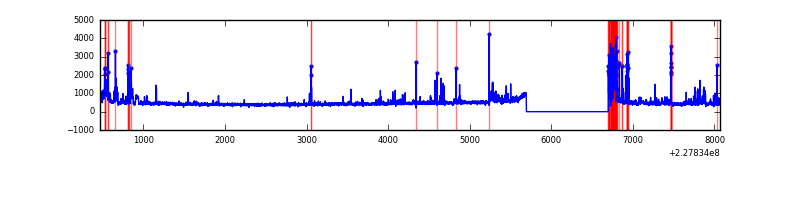 |
Top three noisy pixels from each quadrant. If the there are fewer than three noisy pixels in the level2.evt file, extra rows are filled as -1
| Pixel properties | Quadrant properties | ||||||
|---|---|---|---|---|---|---|---|
| Quadrant | DetID | PixID | Counts | Sigma | Mean | Median | Sigma |
| A | 0 | 226 | 7130 | 40.1 | 781 | 765 | 158.7 |
| A | 13 | 14 | 6858 | 38.39 | 781 | 765 | 158.7 |
| A | 12 | 194 | 6497 | 36.12 | 781 | 765 | 158.7 |
| B | 5 | 250 | 174266 | 1145.55 | 787 | 769 | 151.5 |
| B | 5 | 255 | 104994 | 688.17 | 787 | 769 | 151.5 |
| B | 11 | 51 | 18936 | 119.95 | 787 | 769 | 151.5 |
| C | 1 | 16 | 14309 | 75.31 | 769 | 772 | 179.7 |
| C | 12 | 4 | 8130 | 40.94 | 769 | 772 | 179.7 |
| C | 13 | 61 | 5972 | 28.93 | 769 | 772 | 179.7 |
| D | 1 | 52 | 431653 | 2347.99 | 751 | 734 | 183.5 |
| D | 2 | 14 | 132403 | 717.44 | 751 | 734 | 183.5 |
| D | 11 | 144 | 51877 | 278.67 | 751 | 734 | 183.5 |
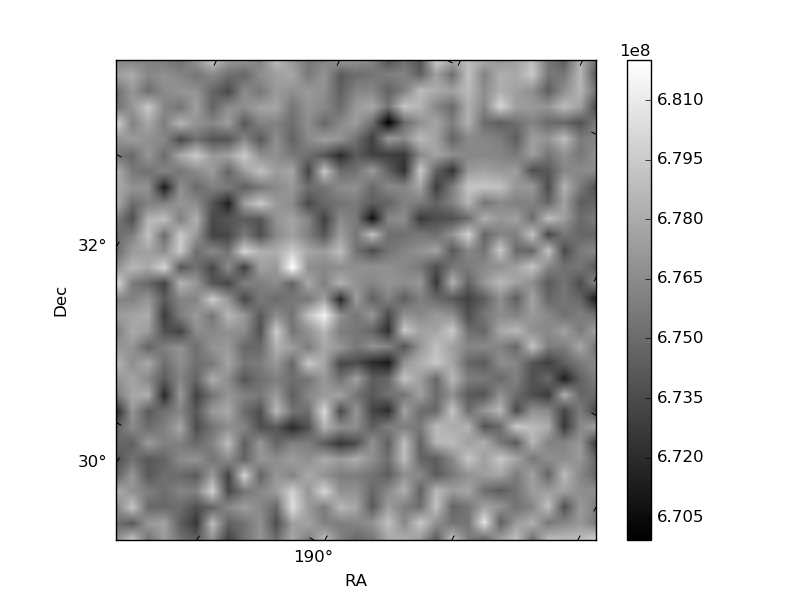
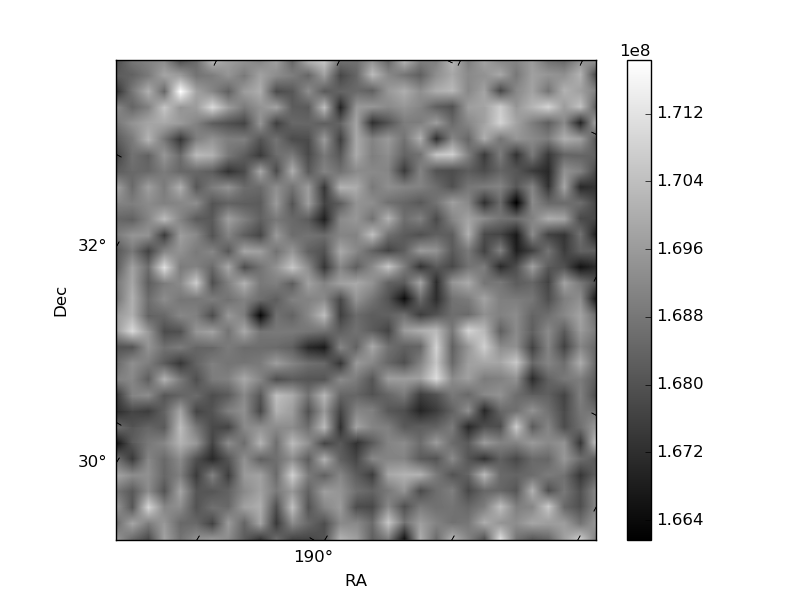
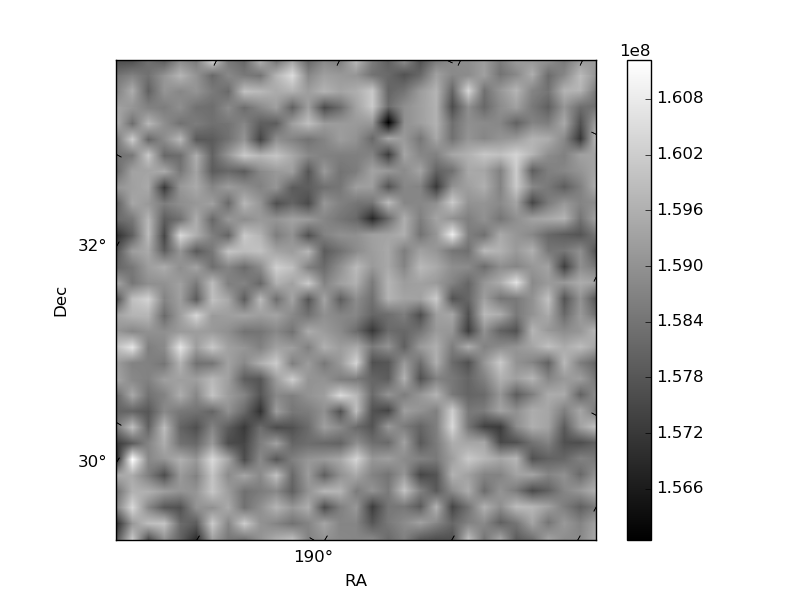
Histogram calculated using DETX and DETY for each event in the final _common_clean file
| Quadrant A | 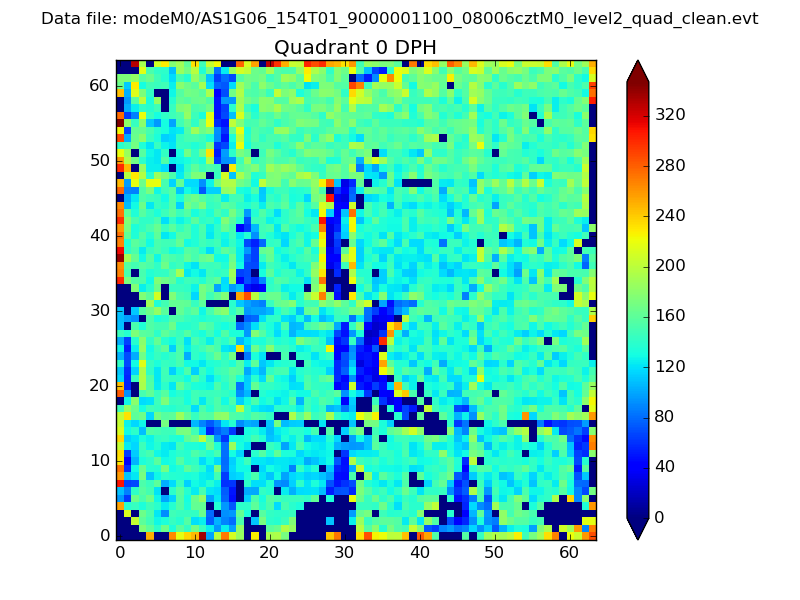 |
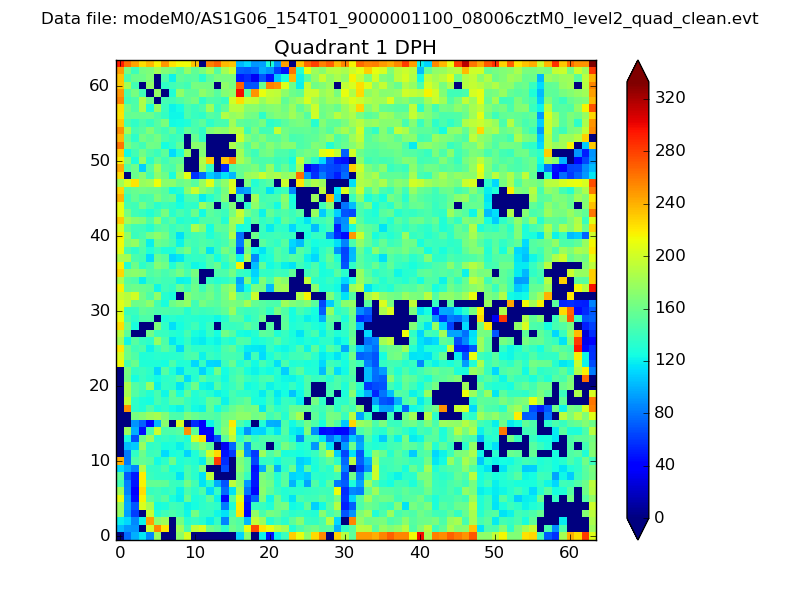 |
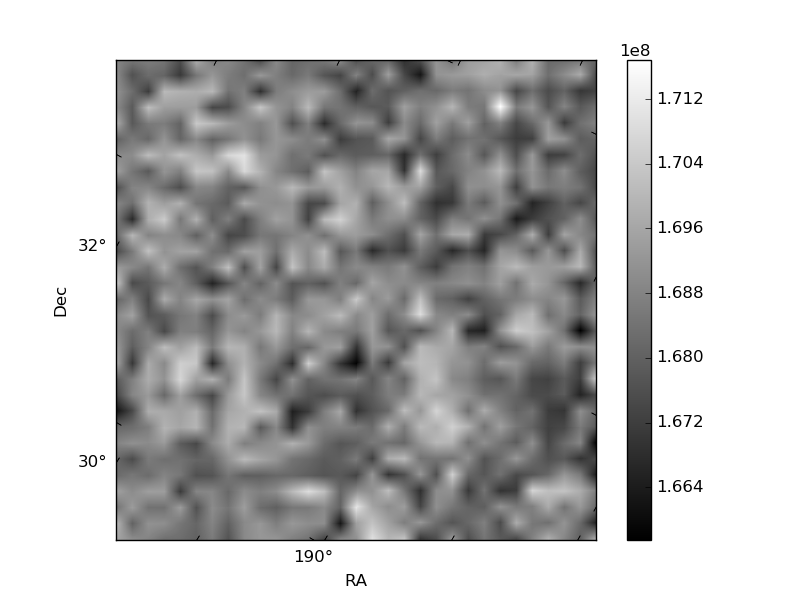
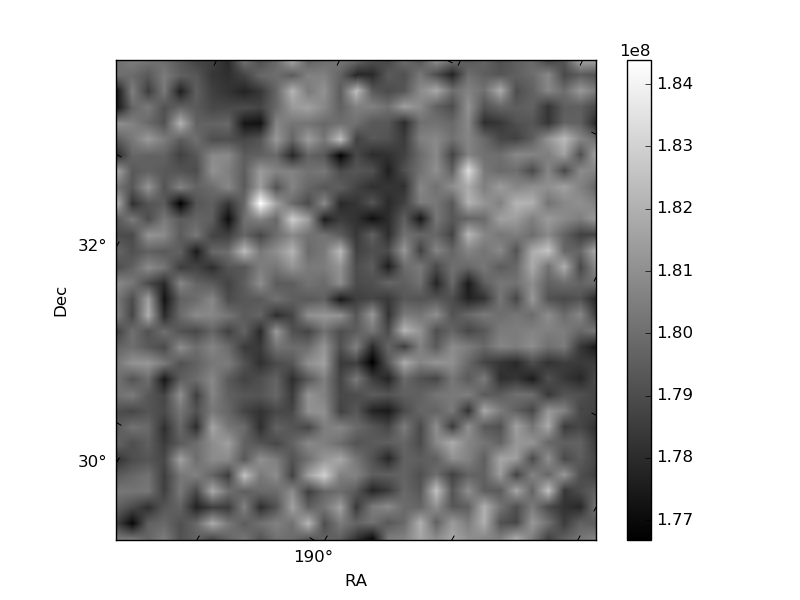
Quadrant B |
|---|---|---|---|
| Quadrant D | 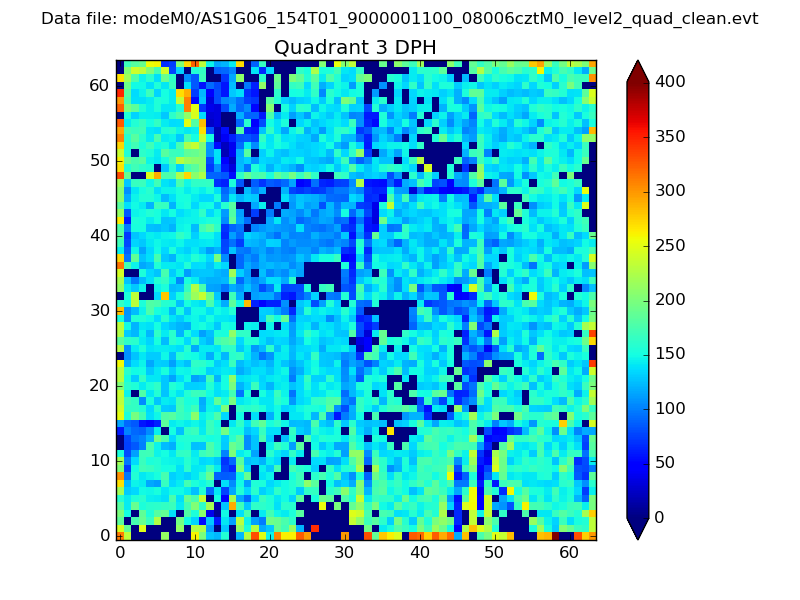 |
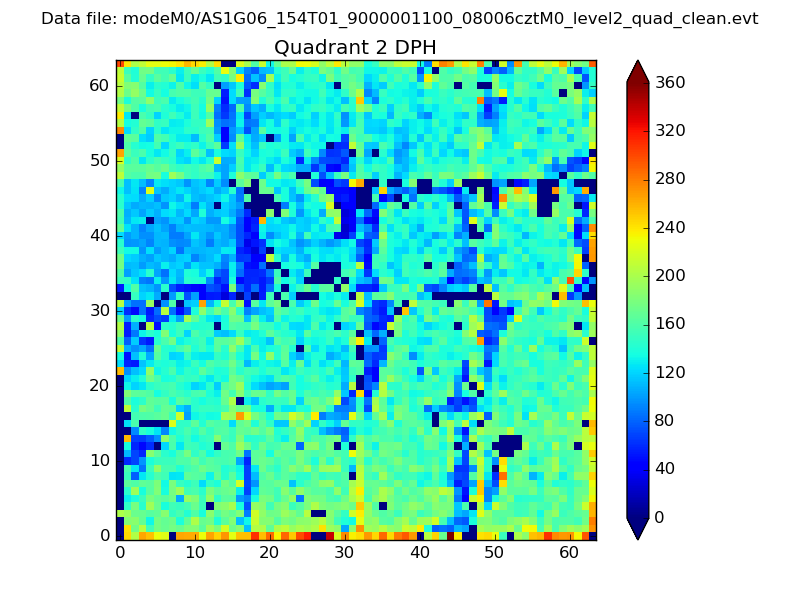 |
Quadrant C |
| Plot type | Count rate plots | Images |
|---|---|---|
| Comparison with Poisson distribution Blue bars denote a histogram of data divided into 1 sec bins. Red curve is a Poisson curve with rate = median count rate of data. |
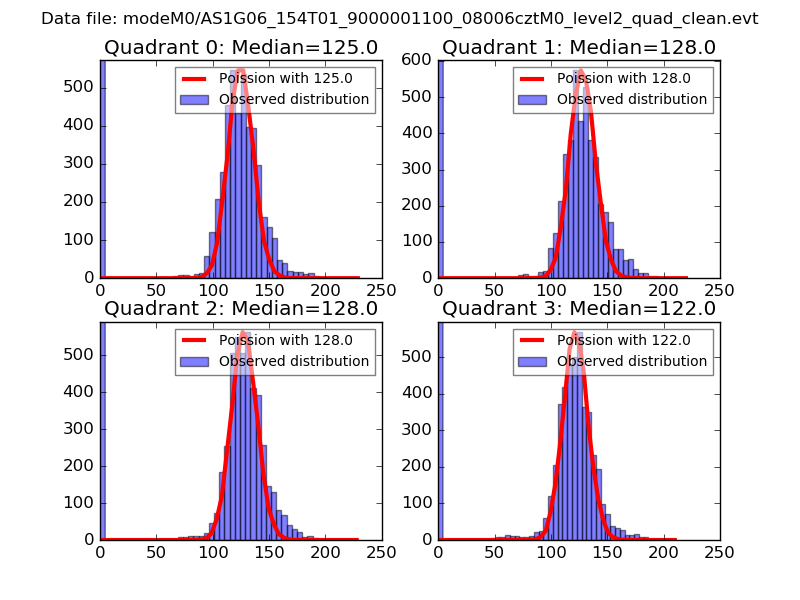 |
 |
| Quadrant-wise count rates Data is divided into 100 sec bins |
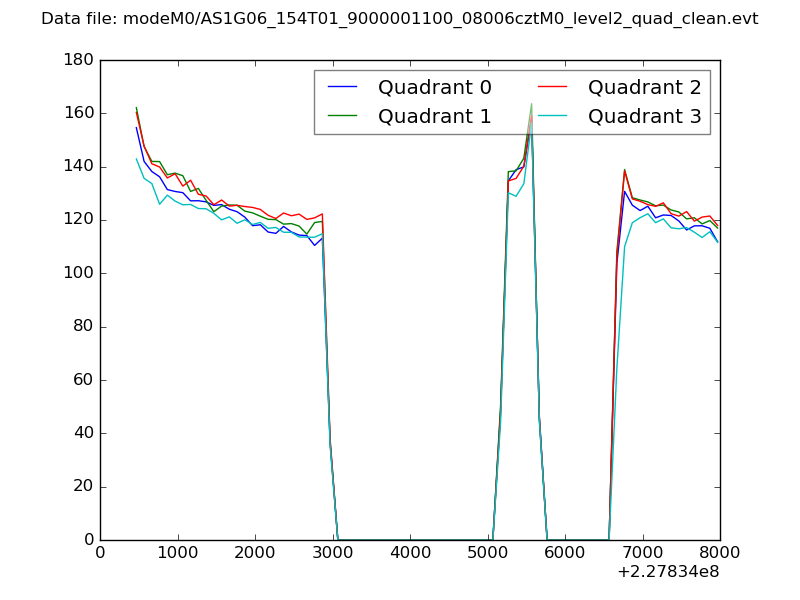 |
|
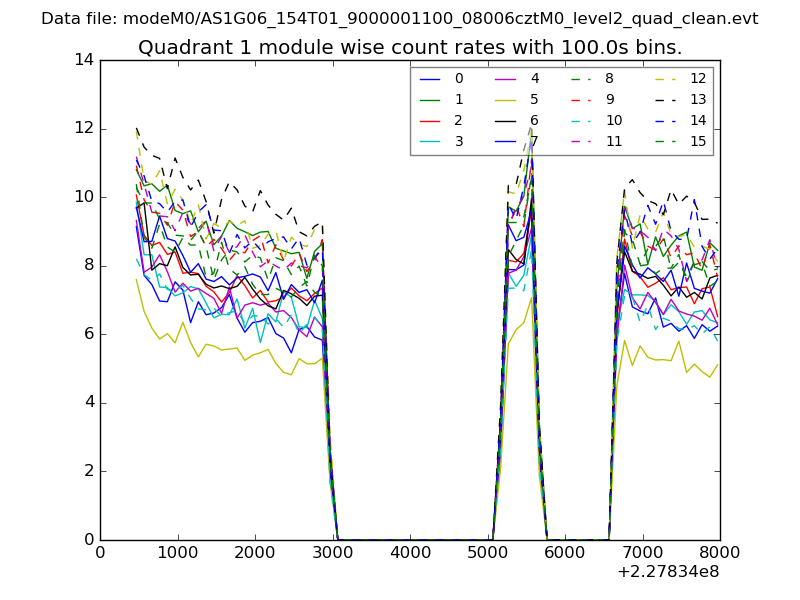
| Module-wise count rates for Quadrant A Data is divided into 100 sec bins |
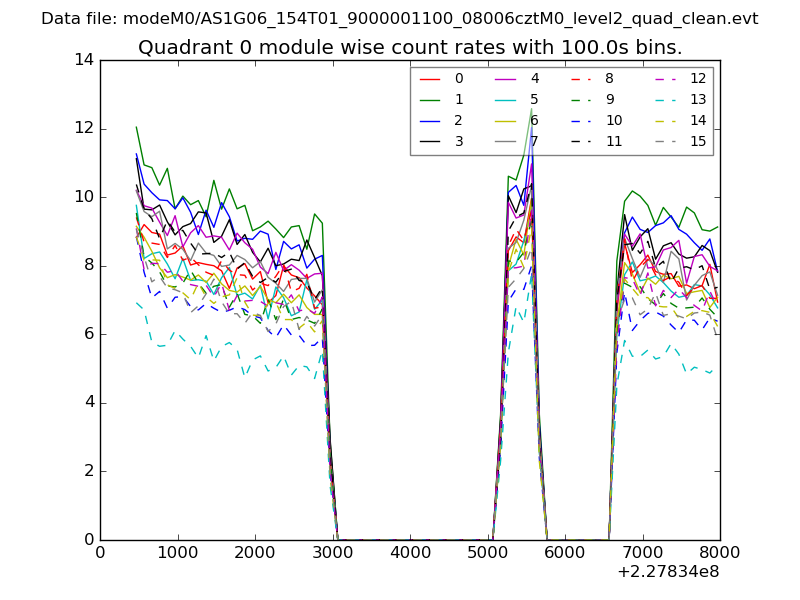 |
 |
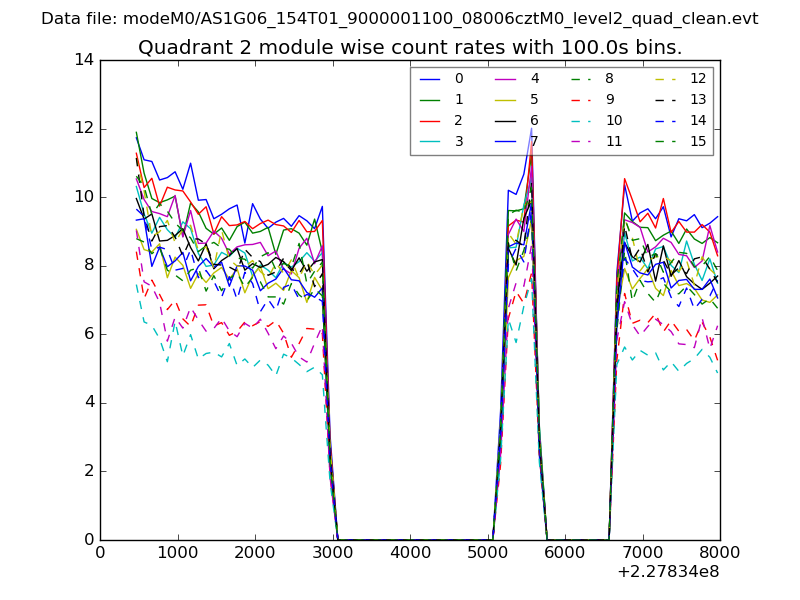
| Module-wise count rates for Quadrant B Data is divided into 100 sec bins |
 |
 |
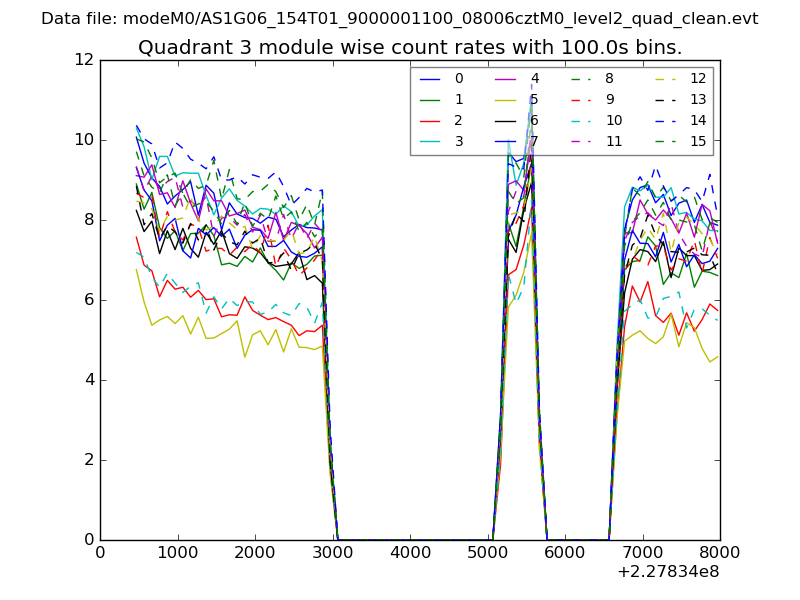
| Module-wise count rates for Quadrant C Data is divided into 100 sec bins |
 |
 |
| Module-wise count rates for Quadrant D Data is divided into 100 sec bins |
 |
 |
| Parameter | Plot |
|---|---|
| CZT HV Monitor | 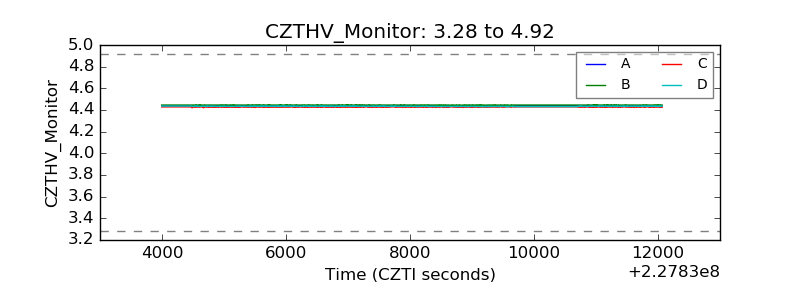 |
| D_VDD | 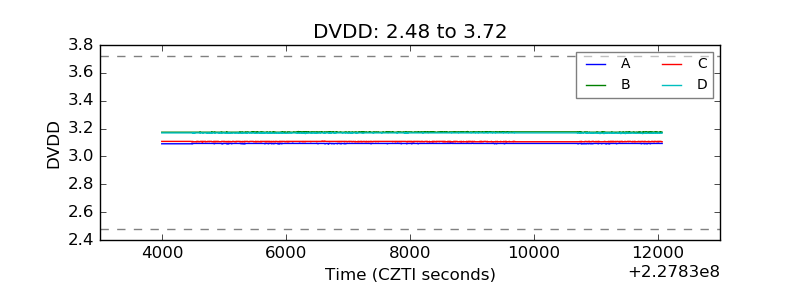 |
| Temperature 1 | 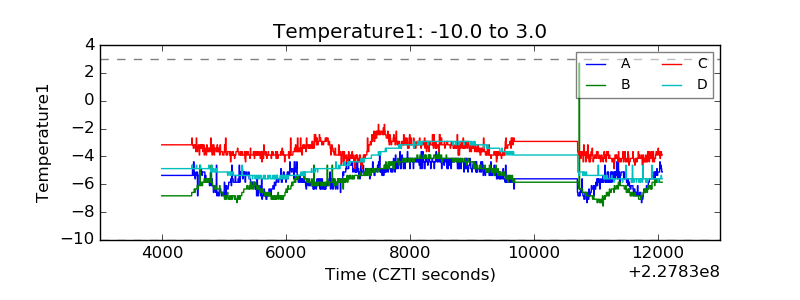 |
| Veto HV Monitor | 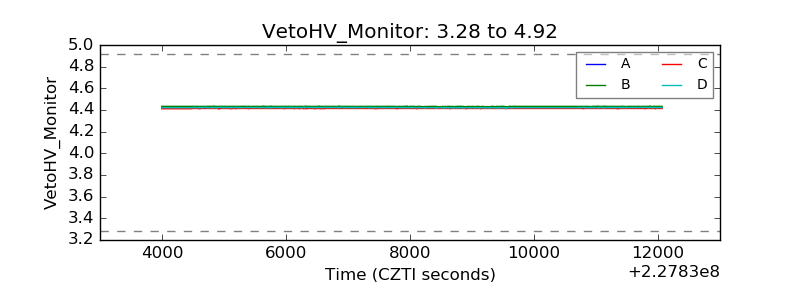 |
| Veto LLD | 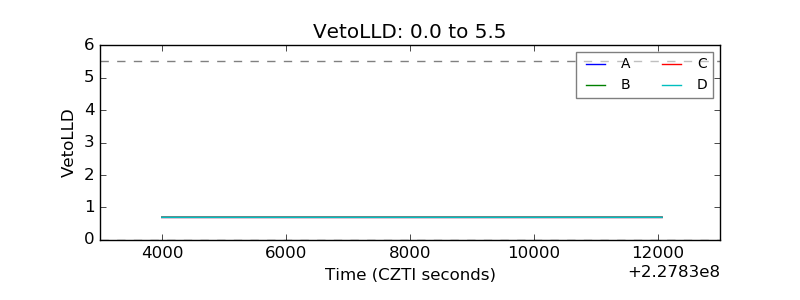 |
| Alpha Counter | 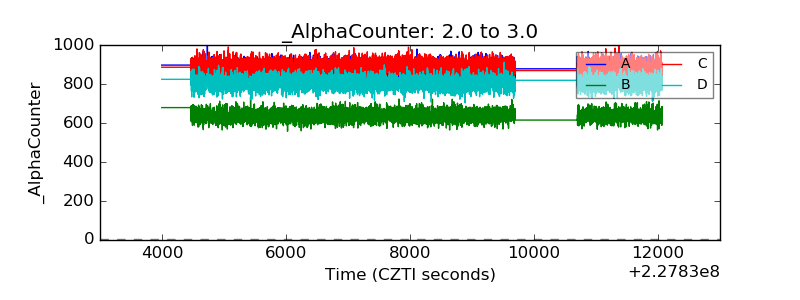 |
| _CPM_Rate | 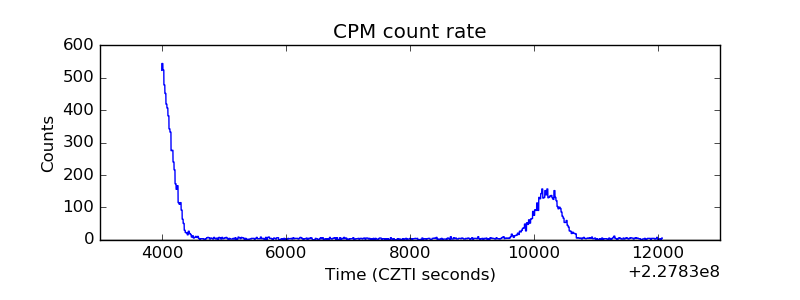 |
| CZT Counter | 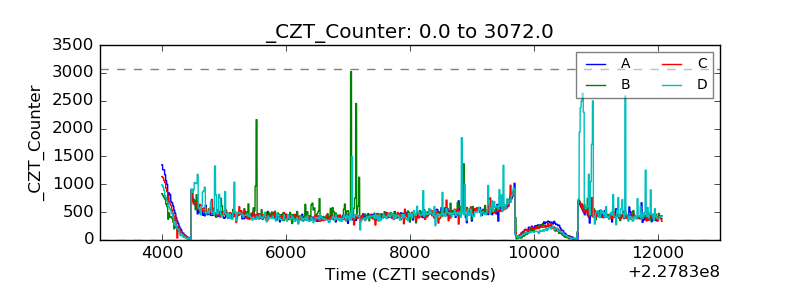 |
| +2.5 Volts monitor |  |
| +5 Volts monitor | 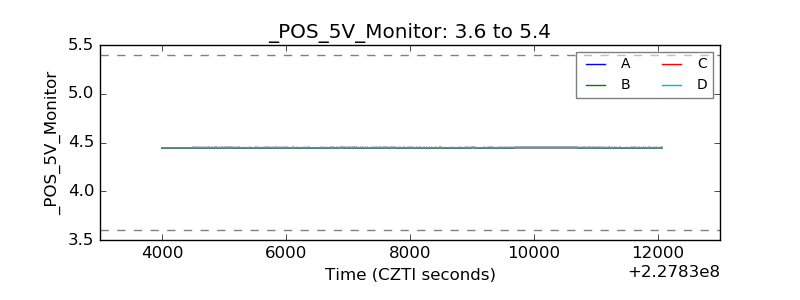 |
| _ROLL_ROT | 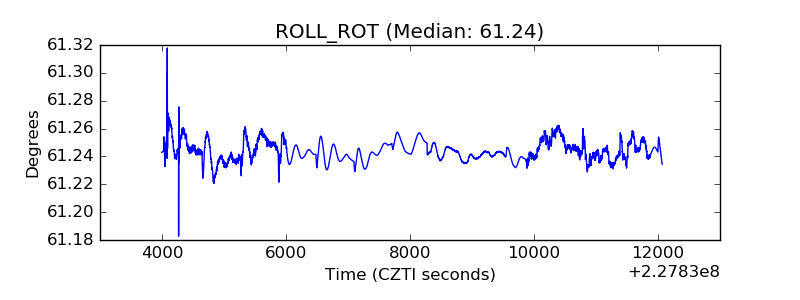 |
| _Roll_DEC | 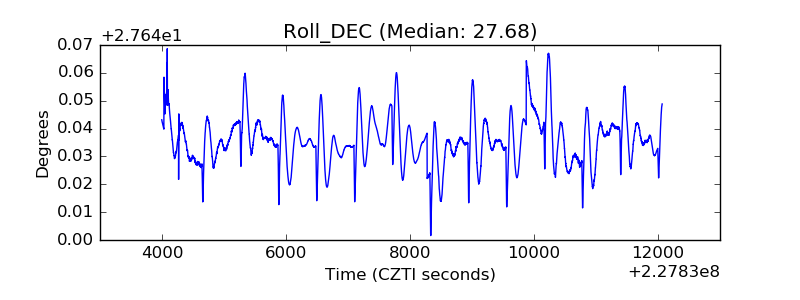 |
| _Roll_RA | 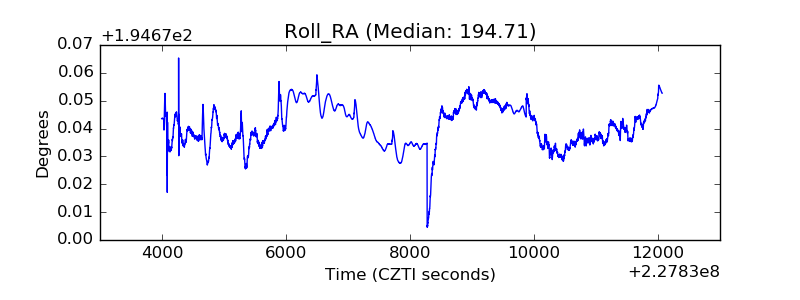 |
| Veto Counter | 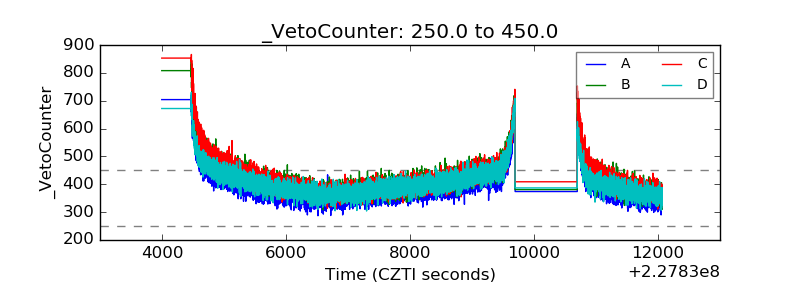 |