| Param | Original file | Final file |
|---|---|---|
| Filename | modeM0/AS1G06_154T01_9000001100_08007cztM0_level2.evt | modeM0/AS1G06_154T01_9000001100_08007cztM0_level2_quad_clean.evt |
| Size (bytes) | 486,014,400 | 96,076,800 |
| Size | 463.5 MB | 91.6 MB |
| Events in quadrant A | 3,255,269 | 598,153 |
| Events in quadrant B | 3,412,984 | 615,307 |
| Events in quadrant C | 3,248,357 | 616,155 |
| Events in quadrant D | 4,316,443 | 581,982 |
| Mode M9 | |||
|---|---|---|---|
| Quadrant | BADHDUFLAG | Total packets | Discarded packets |
| A | 0 | 14 | 0 |
| B | 0 | 14 | 0 |
| C | 0 | 14 | 0 |
| D | 0 | 15 | 0 |
| Mode SS | |||
|---|---|---|---|
| Quadrant | BADHDUFLAG | Total packets | Discarded packets |
| A | 0 | 144 | 0 |
| B | 0 | 144 | 0 |
| C | 0 | 144 | 0 |
| D | 0 | 144 | 0 |
| Mode M0 | |||
|---|---|---|---|
| Quadrant | BADHDUFLAG | Total packets | Discarded packets |
| A | 0 | 14704 | 3 |
| B | 0 | 14973 | 2 |
| C | 0 | 14736 | 2 |
| D | 0 | 17850 | 2 |
| Quadrant | Total seconds | Saturated seconds | Saturation percentage |
|---|---|---|---|
| A | 7161 | 86 | 1.200950% |
| B | 7161 | 129 | 1.801424% |
| C | 7161 | 59 | 0.823907% |
| D | 7161 | 207 | 2.890658% |
Noise dominated data is calculated using 1-second bins in cleaned event files. If a bin has >2000 counts, and if more than 50% of those come from <1% of pixels, then it is considered to be noise-dominated and hence unusable.
| Quadrant | # 1 sec bins | Bins with >0 counts | Bins with >2000 counts | High rate bins dominated by noise | Noise dominated (total time) | Noise dominated (detector-on time) | Marked lightcurve |
|---|---|---|---|---|---|---|---|
| A | 7651 | 7163 | 0 | 0 | 0.00% | 0.00% | 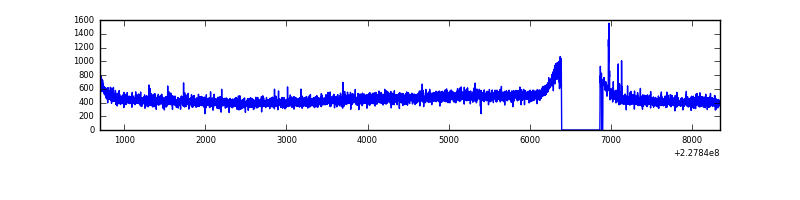 |
| B | 7651 | 7163 | 2 | 2 | 0.03% | 0.03% | 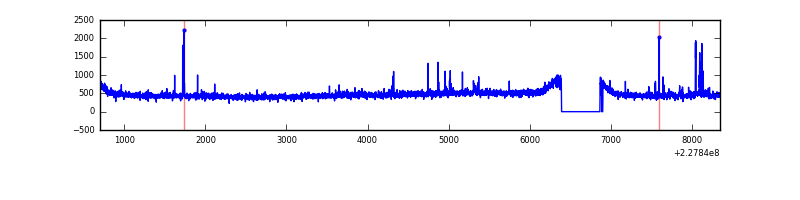 |
| C | 7651 | 7163 | 0 | 0 | 0.00% | 0.00% | 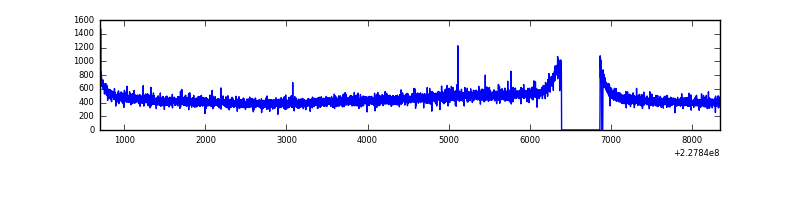 |
| D | 7651 | 7163 | 113 | 113 | 1.48% | 1.58% | 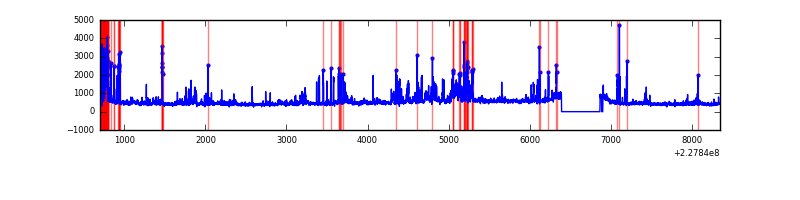 |
Top three noisy pixels from each quadrant. If the there are fewer than three noisy pixels in the level2.evt file, extra rows are filled as -1
| Pixel properties | Quadrant properties | ||||||
|---|---|---|---|---|---|---|---|
| Quadrant | DetID | PixID | Counts | Sigma | Mean | Median | Sigma |
| A | 15 | 234 | 11884 | 64.34 | 839 | 821 | 171.9 |
| A | 13 | 251 | 10323 | 55.26 | 839 | 821 | 171.9 |
| A | 0 | 226 | 7810 | 40.65 | 839 | 821 | 171.9 |
| B | 5 | 250 | 59168 | 355.22 | 849 | 827 | 164.2 |
| B | 5 | 255 | 34635 | 205.84 | 849 | 827 | 164.2 |
| B | 12 | 111 | 19014 | 110.73 | 849 | 827 | 164.2 |
| C | 1 | 16 | 6827 | 30.95 | 828 | 830 | 193.7 |
| C | 13 | 61 | 6293 | 28.2 | 828 | 830 | 193.7 |
| C | 12 | 4 | 6110 | 27.25 | 828 | 830 | 193.7 |
| D | 1 | 52 | 639999 | 3248.21 | 810 | 788 | 196.8 |
| D | 1 | 83 | 314985 | 1596.62 | 810 | 788 | 196.8 |
| D | 2 | 14 | 120924 | 610.48 | 810 | 788 | 196.8 |
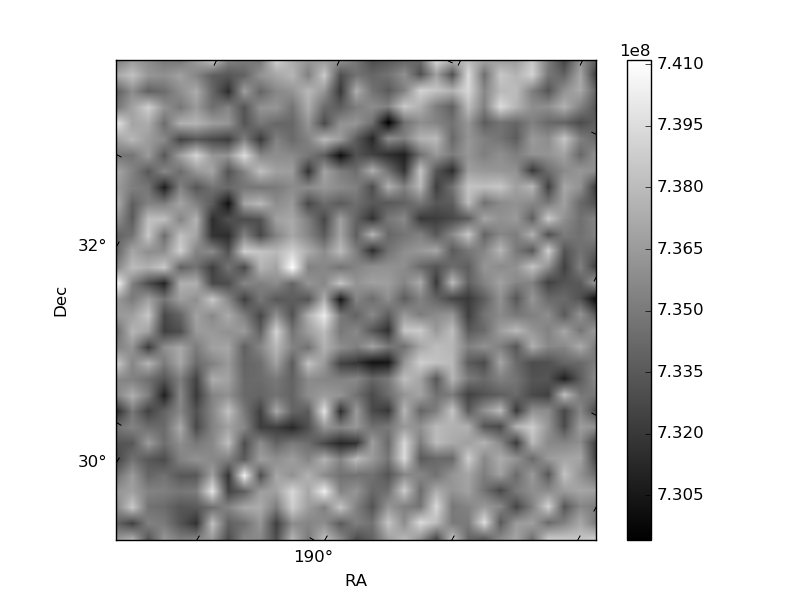
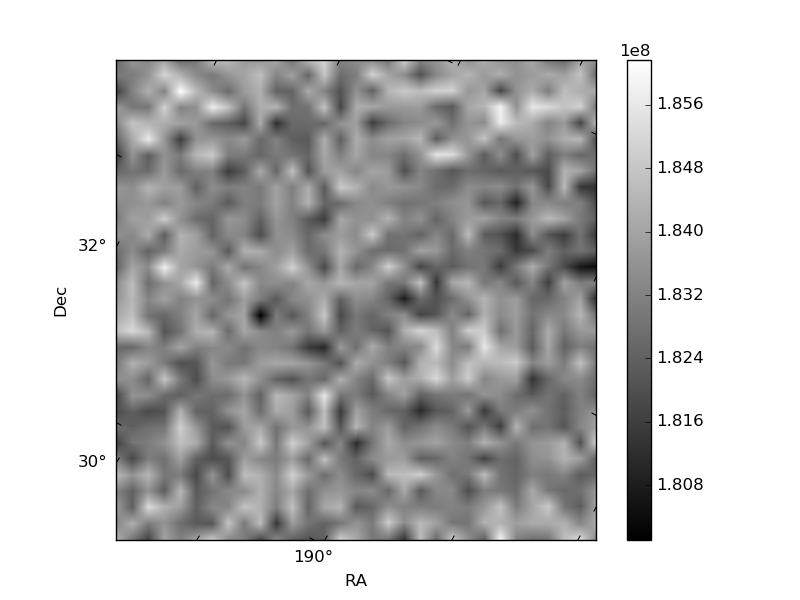
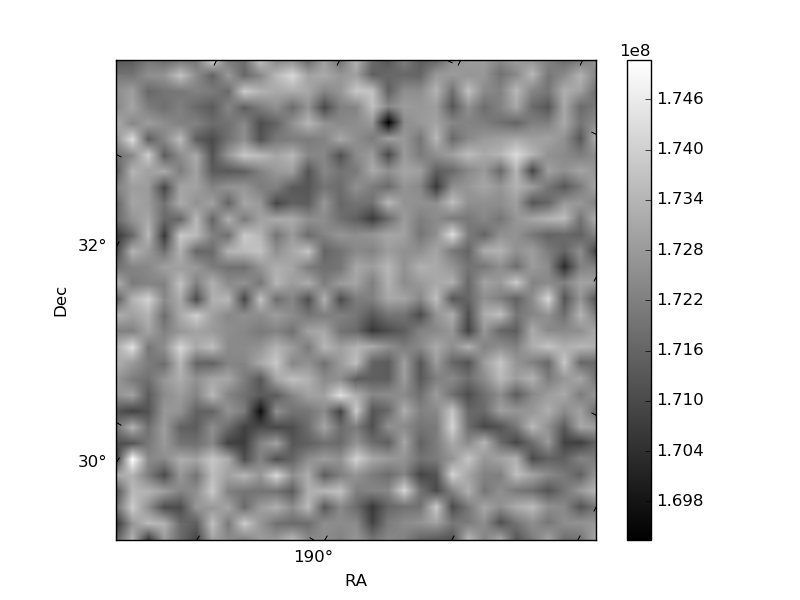
Histogram calculated using DETX and DETY for each event in the final _common_clean file
| Quadrant A | 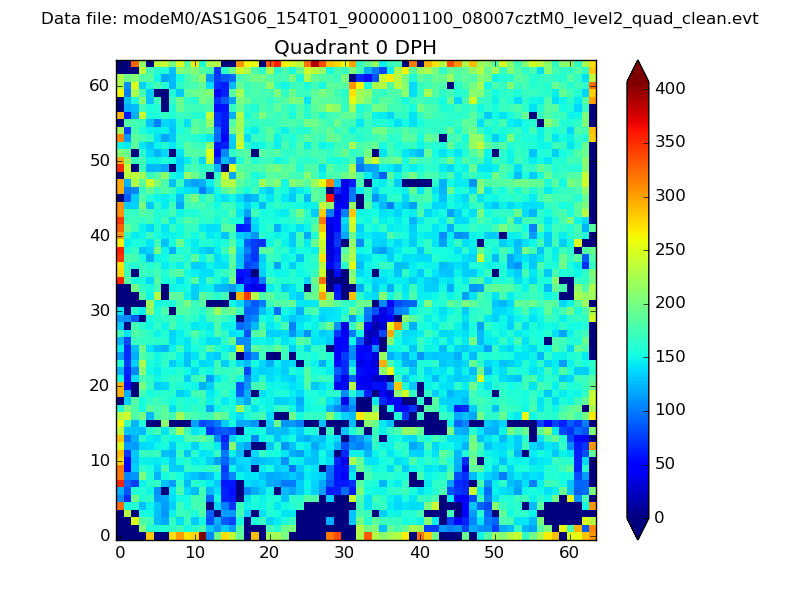 |
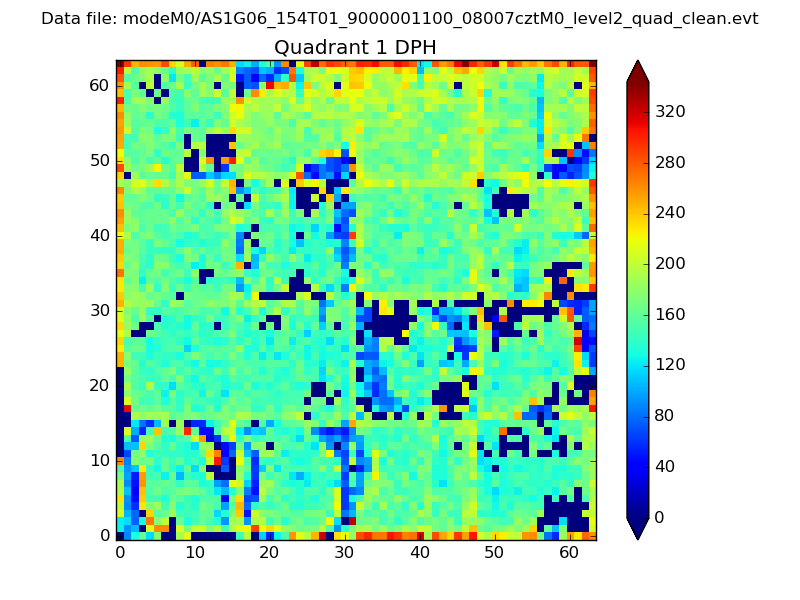 |
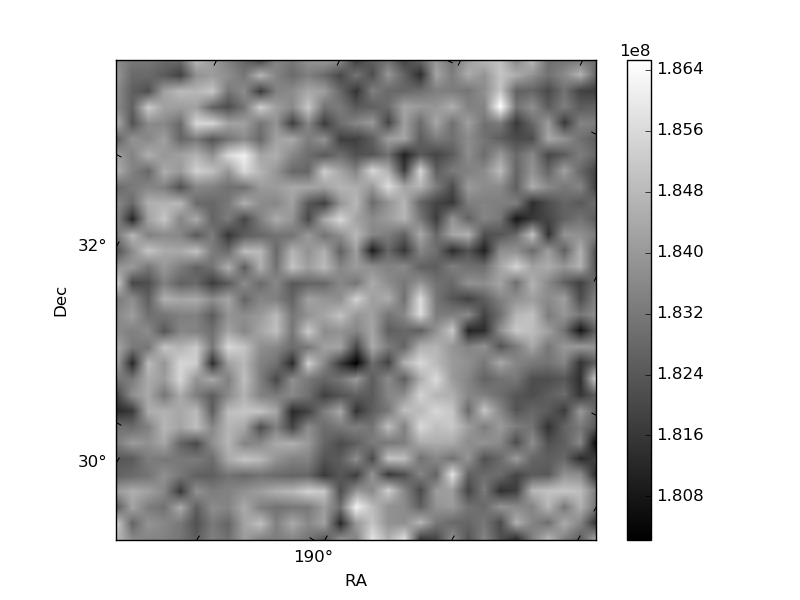
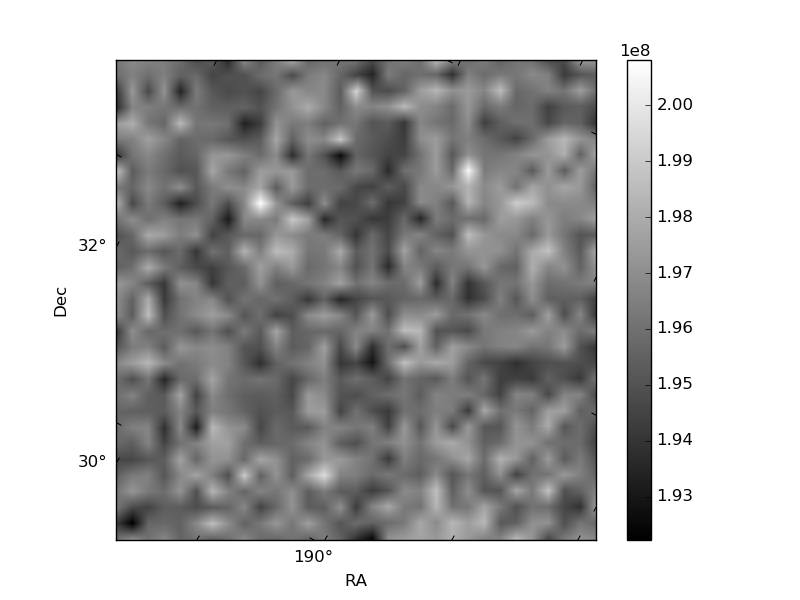
Quadrant B |
|---|---|---|---|
| Quadrant D | 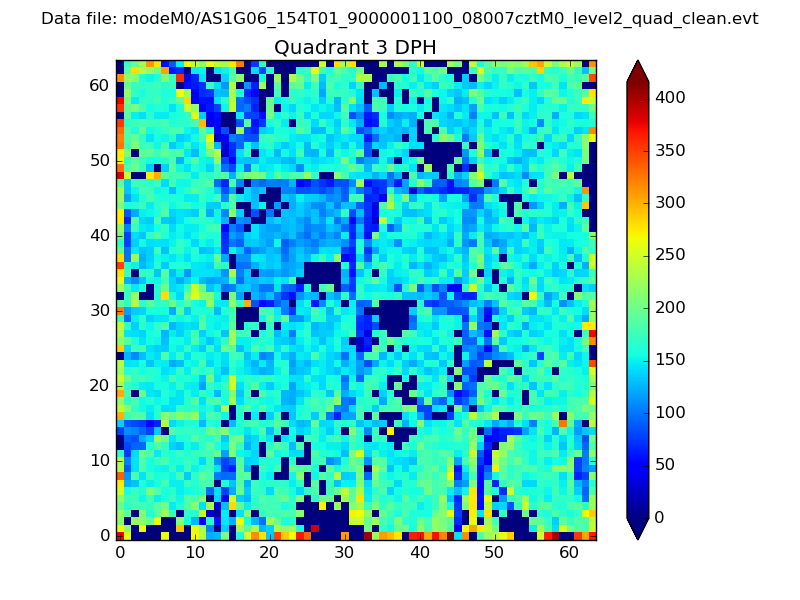 |
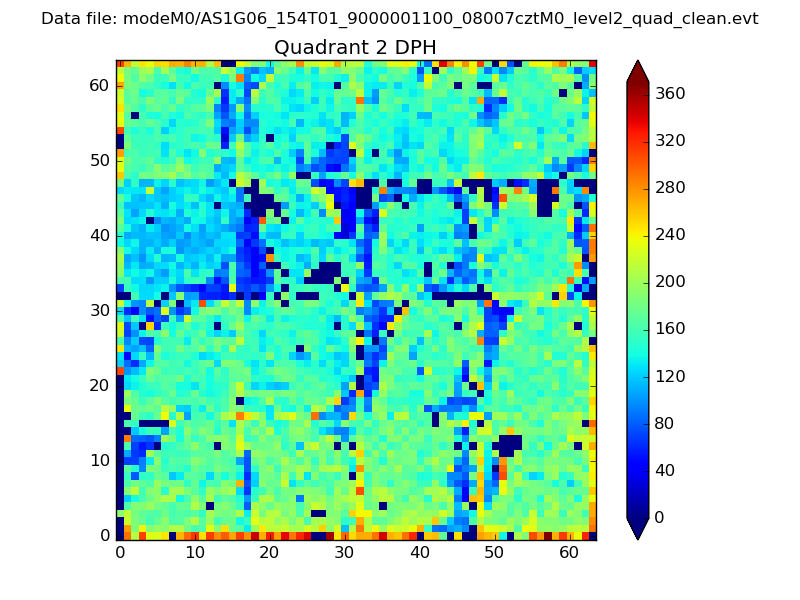 |
Quadrant C |
| Plot type | Count rate plots | Images |
|---|---|---|
| Comparison with Poisson distribution Blue bars denote a histogram of data divided into 1 sec bins. Red curve is a Poisson curve with rate = median count rate of data. |
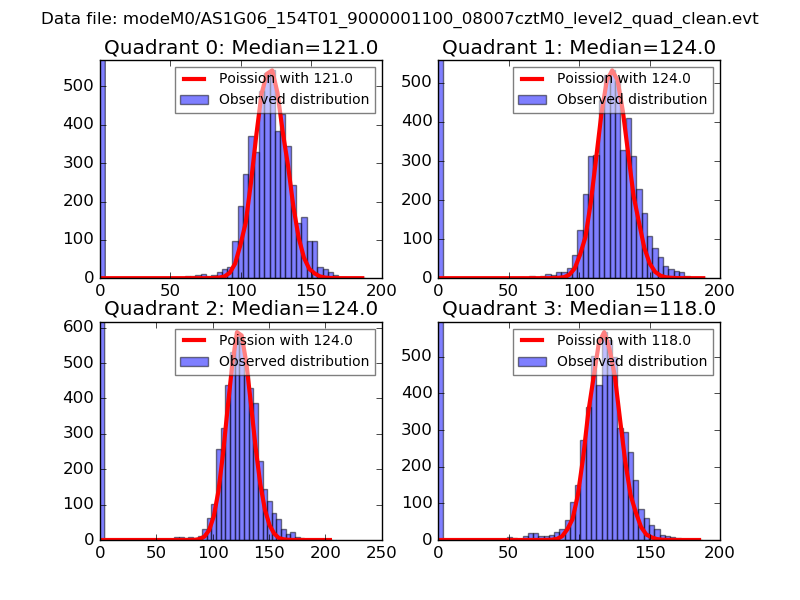 |
 |
| Quadrant-wise count rates Data is divided into 100 sec bins |
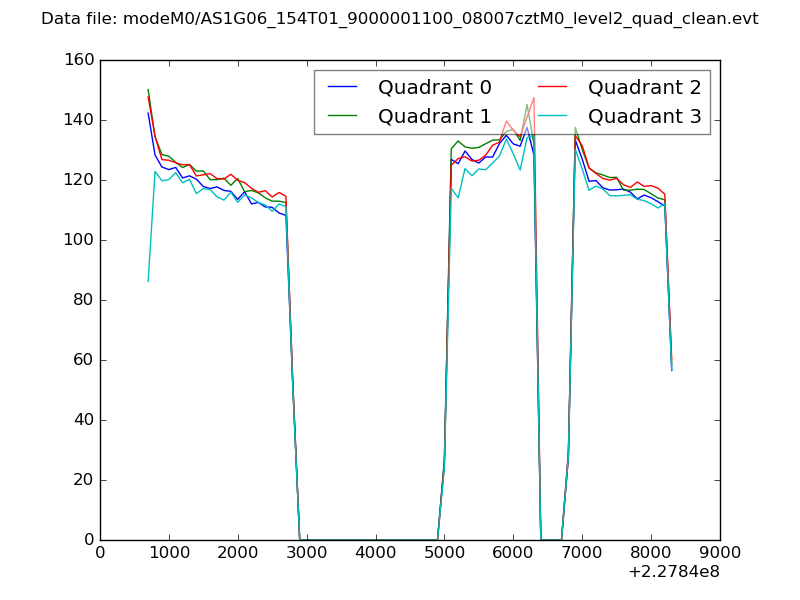 |
|
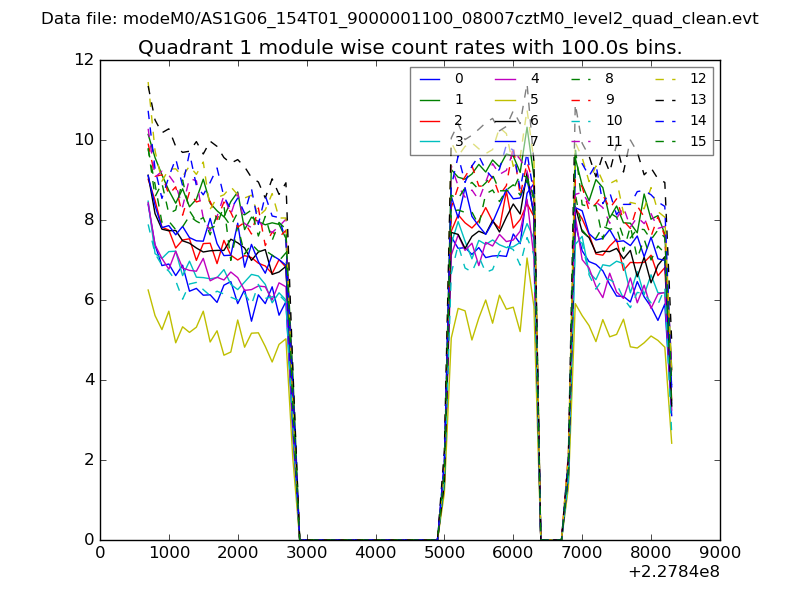
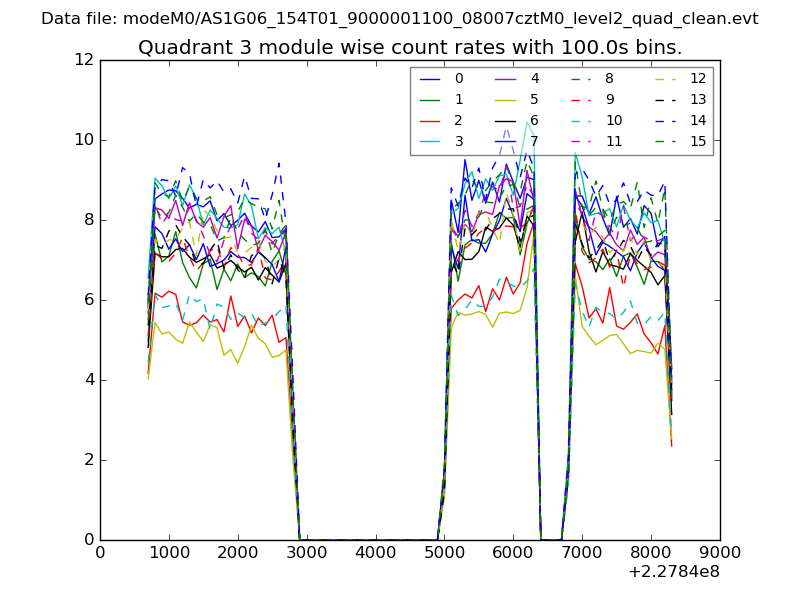
| Module-wise count rates for Quadrant A Data is divided into 100 sec bins |
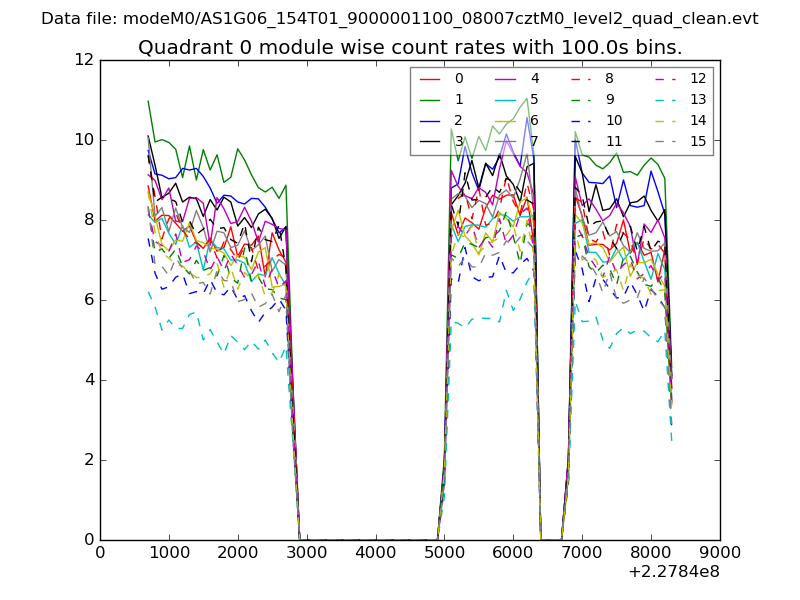 |
 |
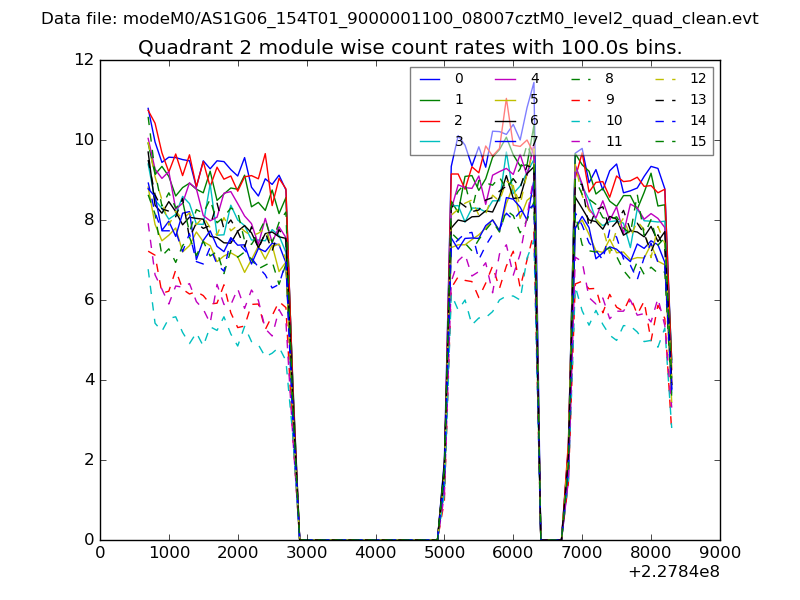
| Module-wise count rates for Quadrant B Data is divided into 100 sec bins |
 |
 |
| Module-wise count rates for Quadrant C Data is divided into 100 sec bins |
 |
 |
| Module-wise count rates for Quadrant D Data is divided into 100 sec bins |
 |
 |
| Parameter | Plot |
|---|---|
| CZT HV Monitor | 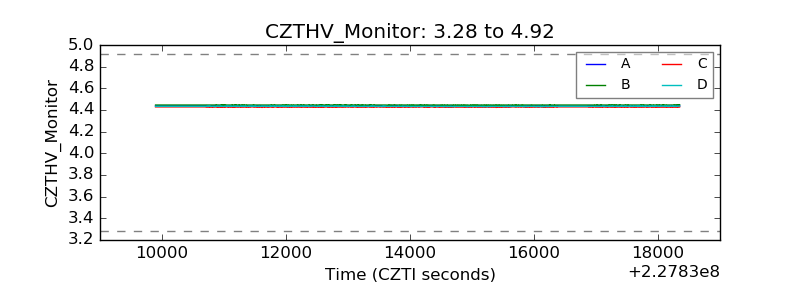 |
| D_VDD | 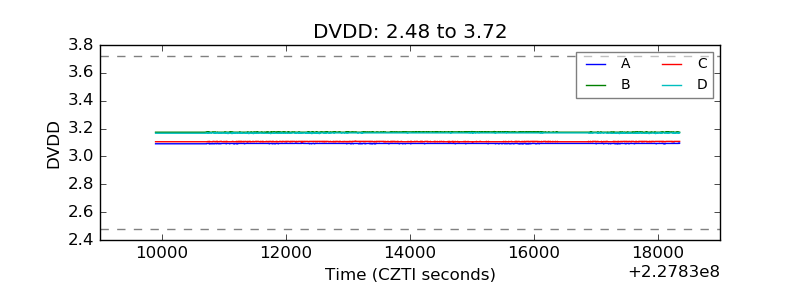 |
| Temperature 1 | 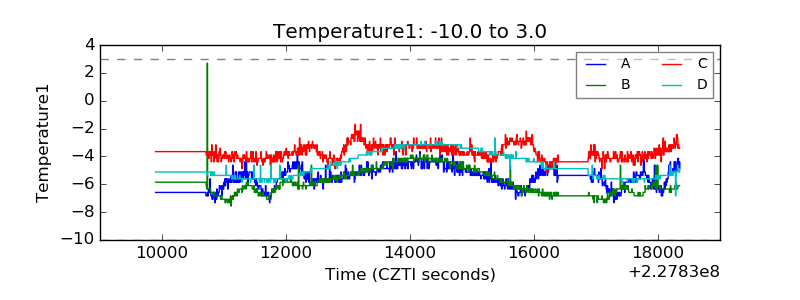 |
| Veto HV Monitor | 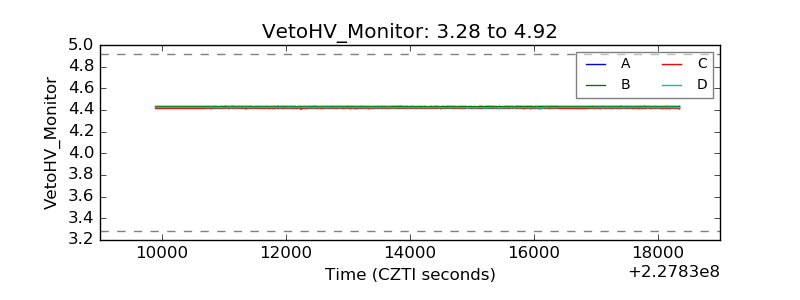 |
| Veto LLD | 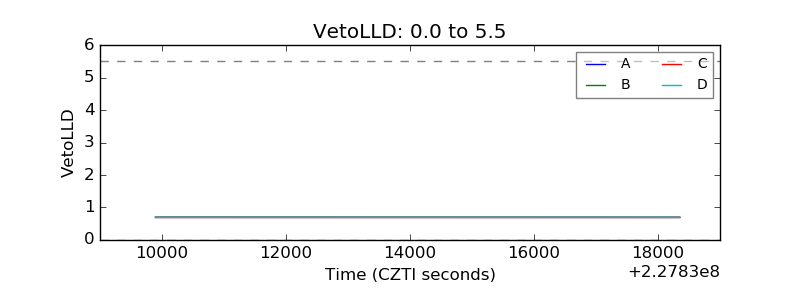 |
| Alpha Counter | 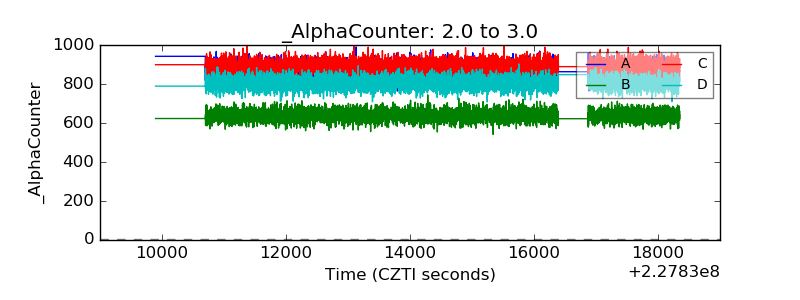 |
| _CPM_Rate | 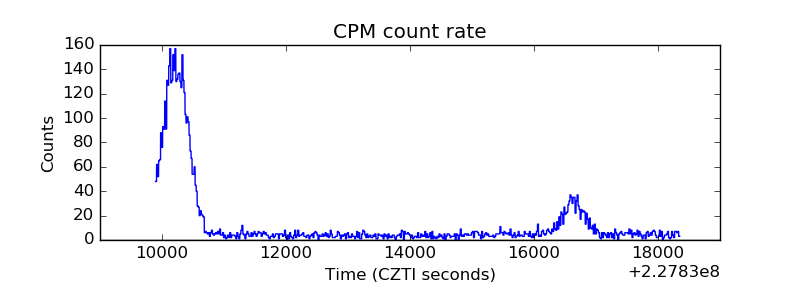 |
| CZT Counter | 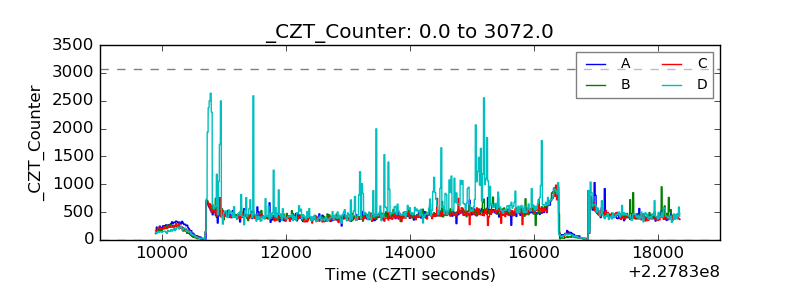 |
| +2.5 Volts monitor |  |
| +5 Volts monitor |  |
| _ROLL_ROT | 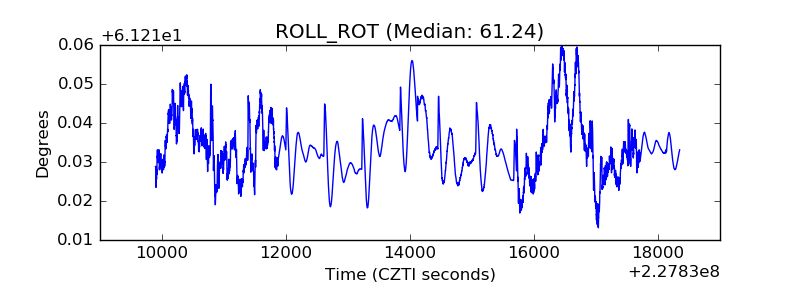 |
| _Roll_DEC | 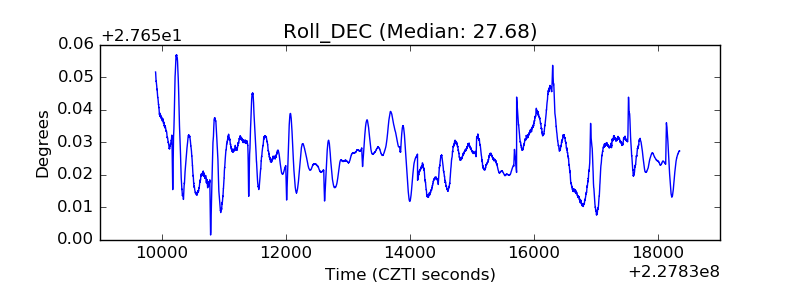 |
| _Roll_RA | 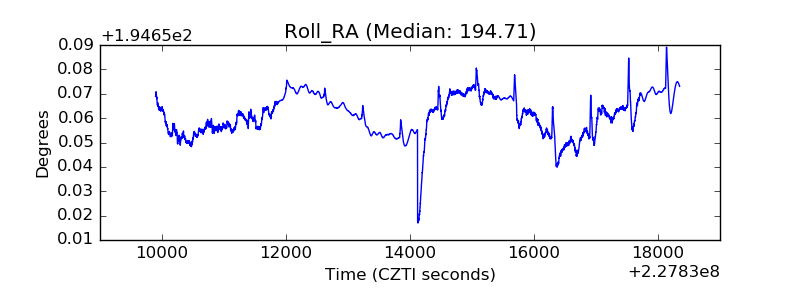 |
| Veto Counter | 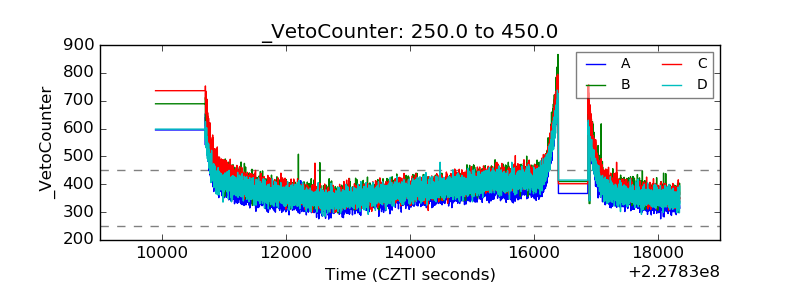 |