| Param | Original file | Final file |
|---|---|---|
| Filename | modeM0/AS1G06_154T01_9000001100_08008cztM0_level2.evt | modeM0/AS1G06_154T01_9000001100_08008cztM0_level2_quad_clean.evt |
| Size (bytes) | 590,348,160 | 114,511,680 |
| Size | 563.0 MB | 109.2 MB |
| Events in quadrant A | 3,821,823 | 719,190 |
| Events in quadrant B | 4,157,054 | 738,665 |
| Events in quadrant C | 3,805,641 | 742,500 |
| Events in quadrant D | 5,538,365 | 698,448 |
| Mode M9 | |||
|---|---|---|---|
| Quadrant | BADHDUFLAG | Total packets | Discarded packets |
| A | 0 | 6 | 0 |
| B | 0 | 6 | 0 |
| C | 0 | 6 | 0 |
| D | 0 | 6 | 0 |
| Mode SS | |||
|---|---|---|---|
| Quadrant | BADHDUFLAG | Total packets | Discarded packets |
| A | 0 | 166 | 0 |
| B | 0 | 166 | 0 |
| C | 0 | 166 | 0 |
| D | 0 | 166 | 0 |
| Mode M0 | |||
|---|---|---|---|
| Quadrant | BADHDUFLAG | Total packets | Discarded packets |
| A | 0 | 17116 | 3 |
| B | 0 | 17756 | 2 |
| C | 0 | 17125 | 2 |
| D | 0 | 21980 | 2 |
| Quadrant | Total seconds | Saturated seconds | Saturation percentage |
|---|---|---|---|
| A | 8196 | 236 | 2.879453% |
| B | 8196 | 298 | 3.635920% |
| C | 8196 | 103 | 1.256711% |
| D | 8196 | 456 | 5.563690% |
Noise dominated data is calculated using 1-second bins in cleaned event files. If a bin has >2000 counts, and if more than 50% of those come from <1% of pixels, then it is considered to be noise-dominated and hence unusable.
| Quadrant | # 1 sec bins | Bins with >0 counts | Bins with >2000 counts | High rate bins dominated by noise | Noise dominated (total time) | Noise dominated (detector-on time) | Marked lightcurve |
|---|---|---|---|---|---|---|---|
| A | 8706 | 8199 | 0 | 0 | 0.00% | 0.00% | 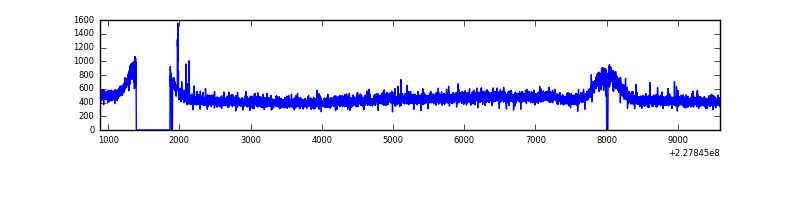 |
| B | 8706 | 8199 | 6 | 6 | 0.07% | 0.07% | 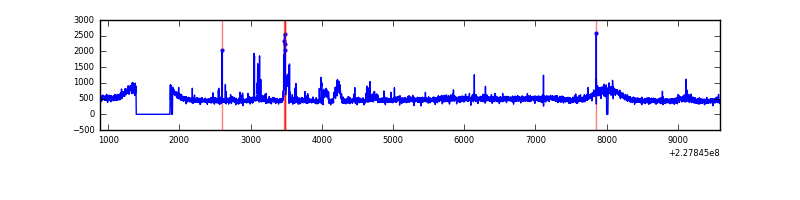 |
| C | 8706 | 8199 | 0 | 0 | 0.00% | 0.00% | 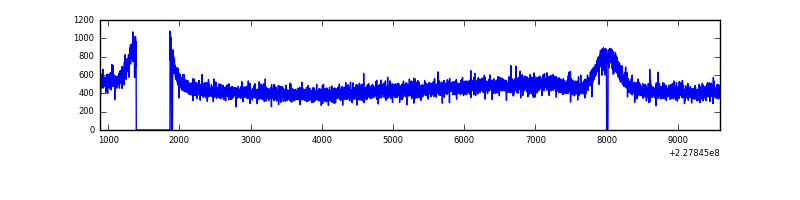 |
| D | 8706 | 8199 | 296 | 296 | 3.40% | 3.61% | 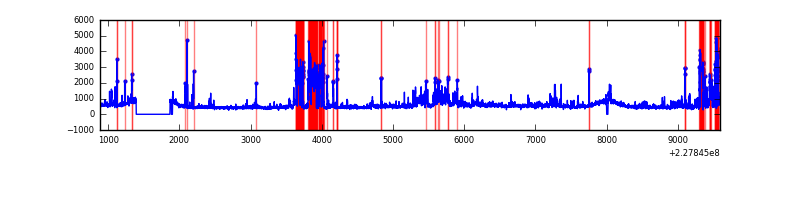 |
Top three noisy pixels from each quadrant. If the there are fewer than three noisy pixels in the level2.evt file, extra rows are filled as -1
| Pixel properties | Quadrant properties | ||||||
|---|---|---|---|---|---|---|---|
| Quadrant | DetID | PixID | Counts | Sigma | Mean | Median | Sigma |
| A | 15 | 234 | 12501 | 57.11 | 986 | 962 | 202.1 |
| A | 13 | 251 | 9943 | 44.45 | 986 | 962 | 202.1 |
| A | 13 | 14 | 9506 | 42.28 | 986 | 962 | 202.1 |
| B | 5 | 250 | 242419 | 1242.79 | 995 | 969 | 194.3 |
| B | 12 | 111 | 22475 | 110.7 | 995 | 969 | 194.3 |
| B | 11 | 111 | 18115 | 88.25 | 995 | 969 | 194.3 |
| C | 13 | 61 | 7410 | 28.33 | 972 | 974 | 227.2 |
| C | 1 | 16 | 5499 | 19.92 | 972 | 974 | 227.2 |
| C | 8 | 222 | 4638 | 16.13 | 972 | 974 | 227.2 |
| D | 11 | 144 | 947102 | 4164.29 | 944 | 919 | 227.2 |
| D | 1 | 52 | 810190 | 3561.72 | 944 | 919 | 227.2 |
| D | 2 | 14 | 89596 | 390.28 | 944 | 919 | 227.2 |
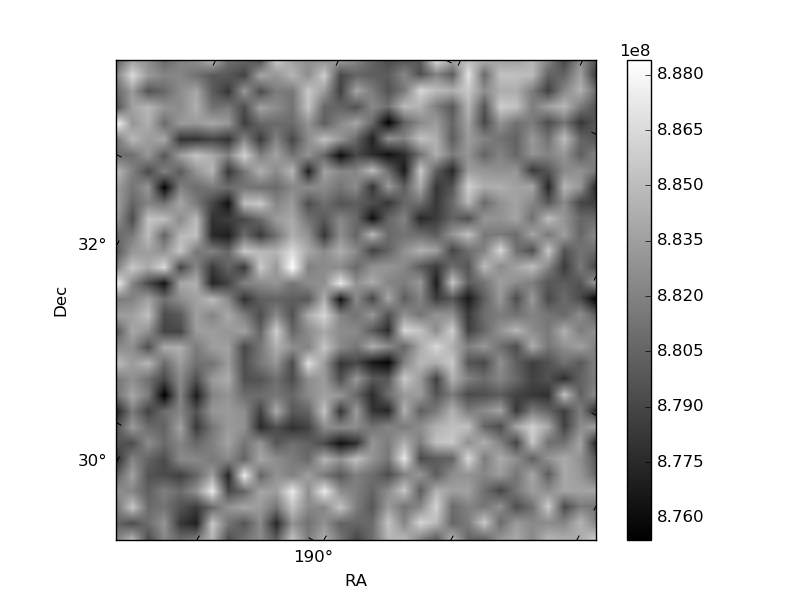
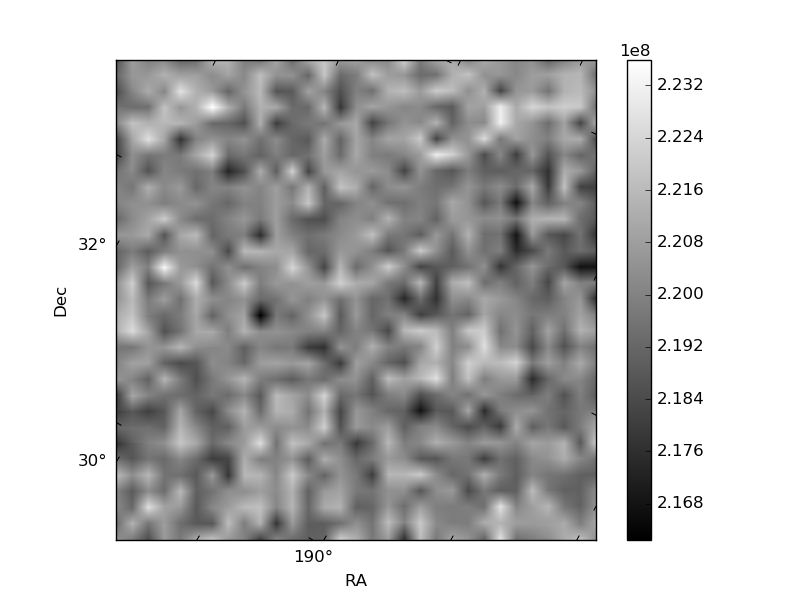
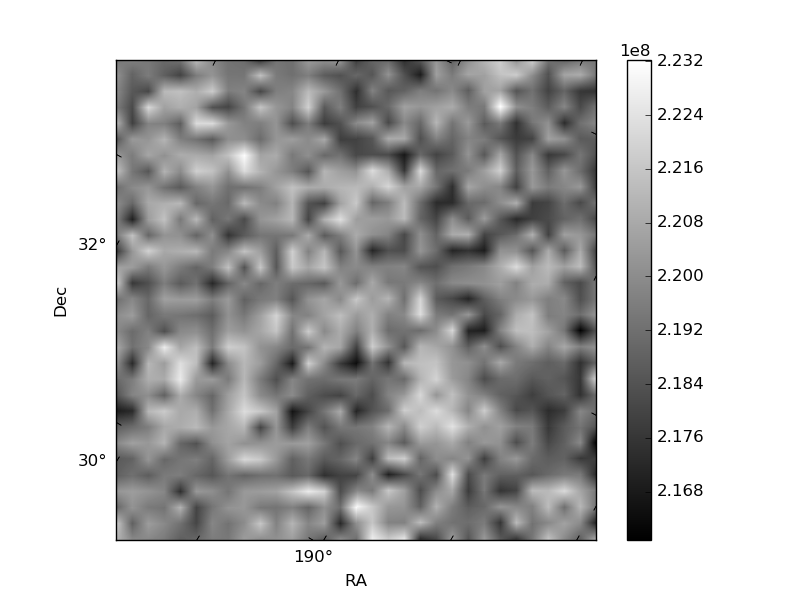
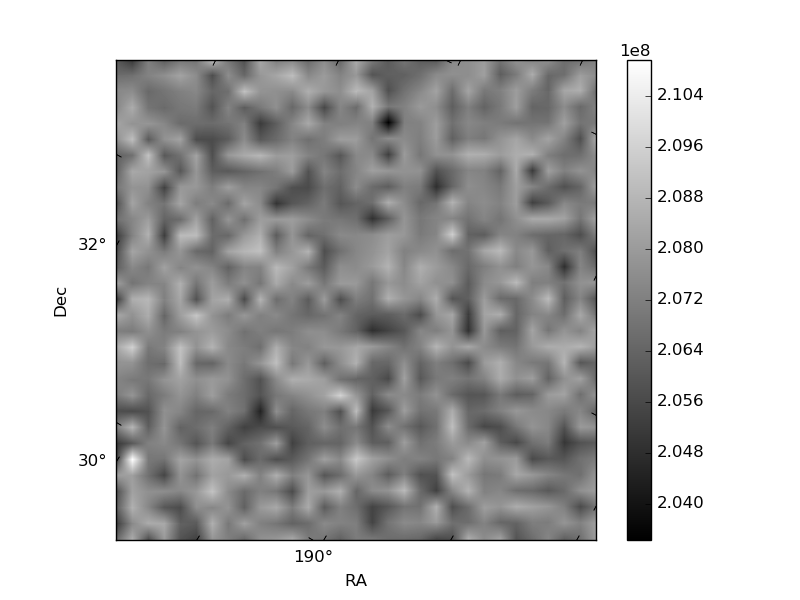
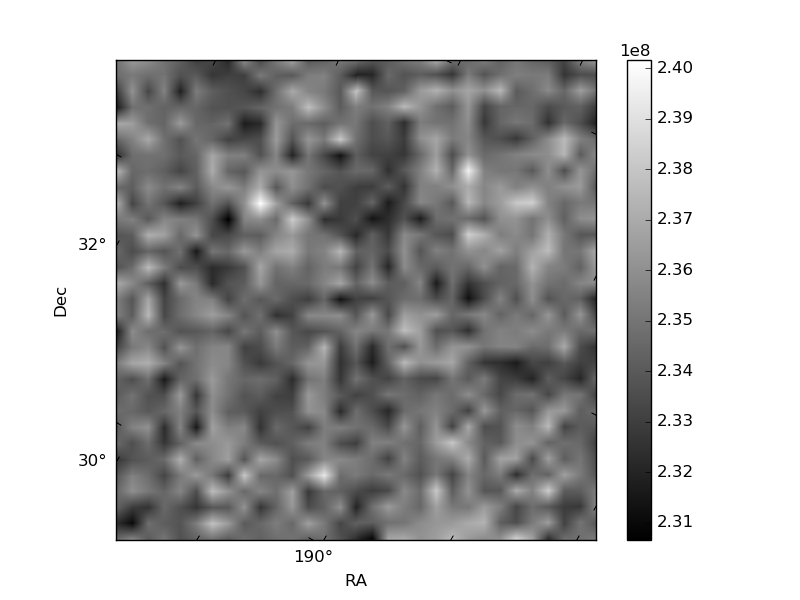
Histogram calculated using DETX and DETY for each event in the final _common_clean file
| Quadrant A | 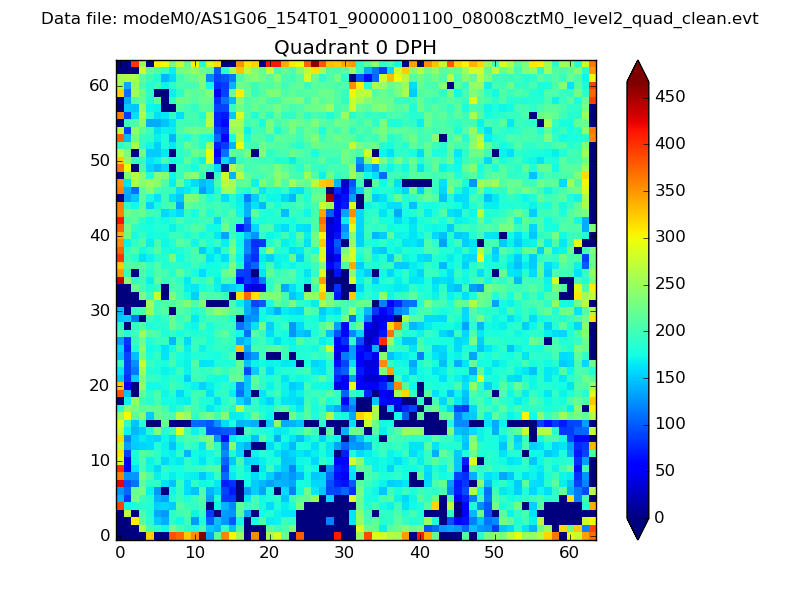 |
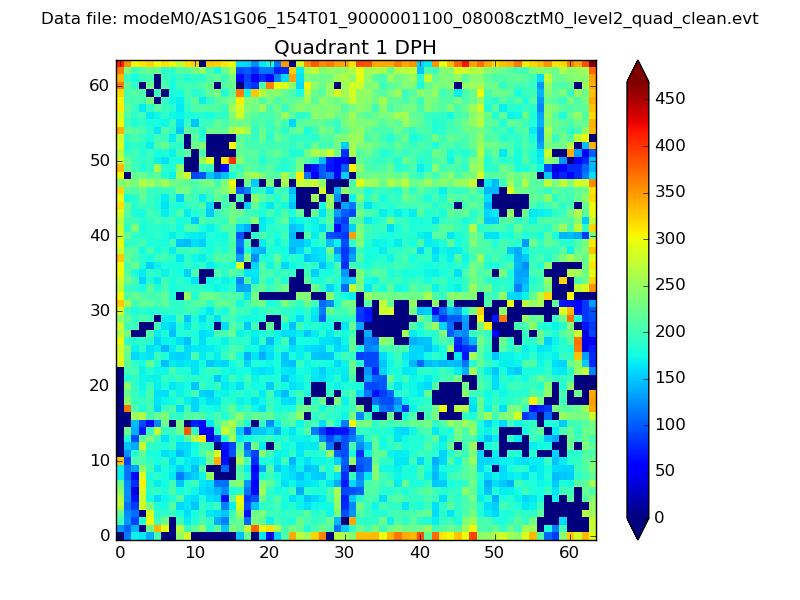 |
Quadrant B |
|---|---|---|---|
| Quadrant D | 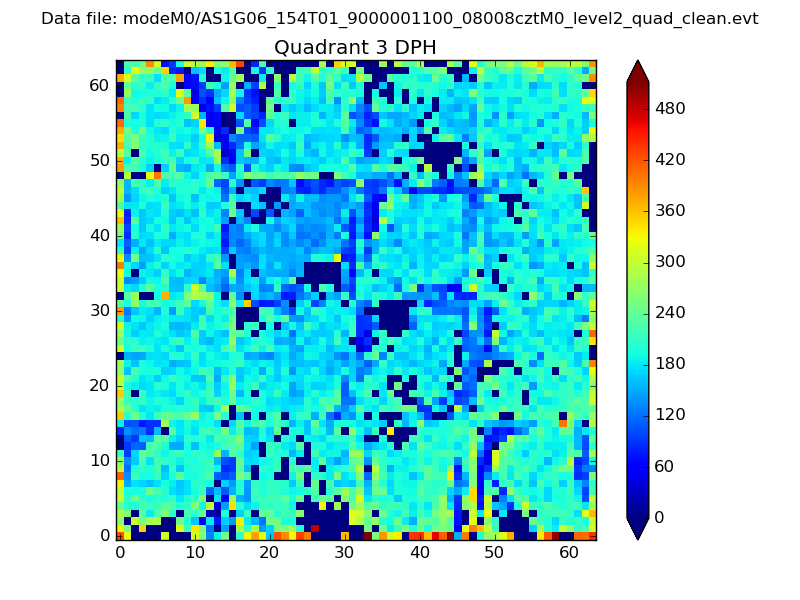 |
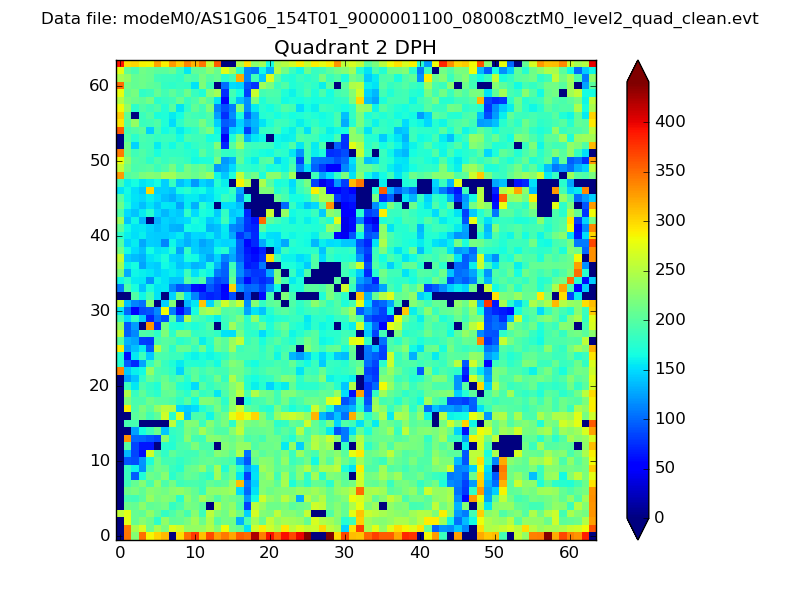 |
Quadrant C |
| Plot type | Count rate plots | Images |
|---|---|---|
| Comparison with Poisson distribution Blue bars denote a histogram of data divided into 1 sec bins. Red curve is a Poisson curve with rate = median count rate of data. |
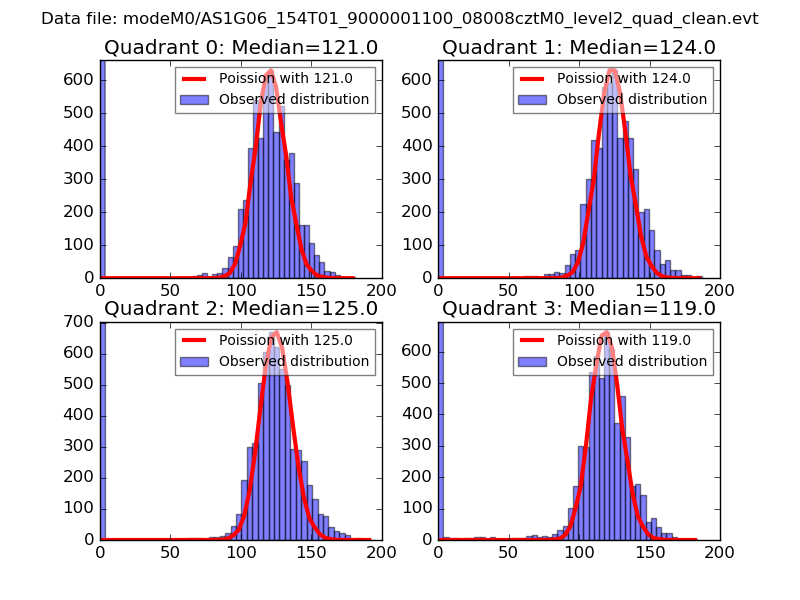 |
 |
| Quadrant-wise count rates Data is divided into 100 sec bins |
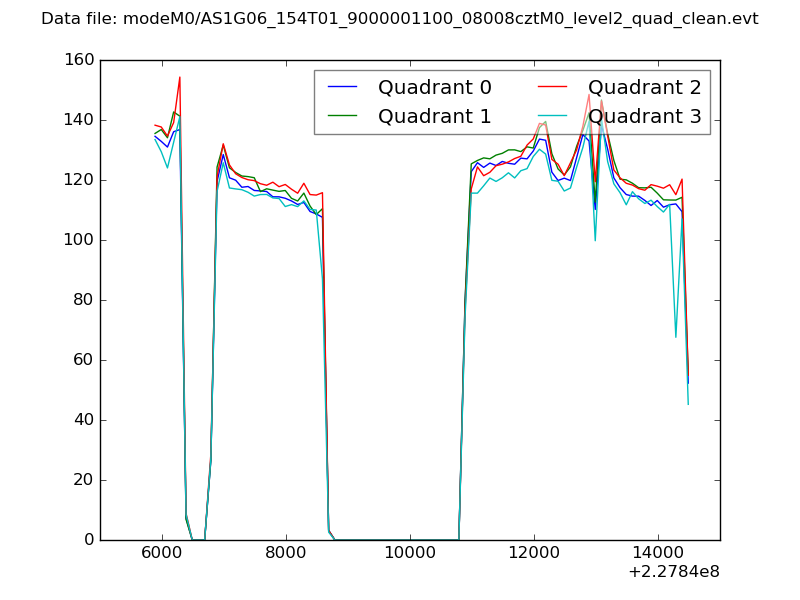 |
|
| Module-wise count rates for Quadrant A Data is divided into 100 sec bins |
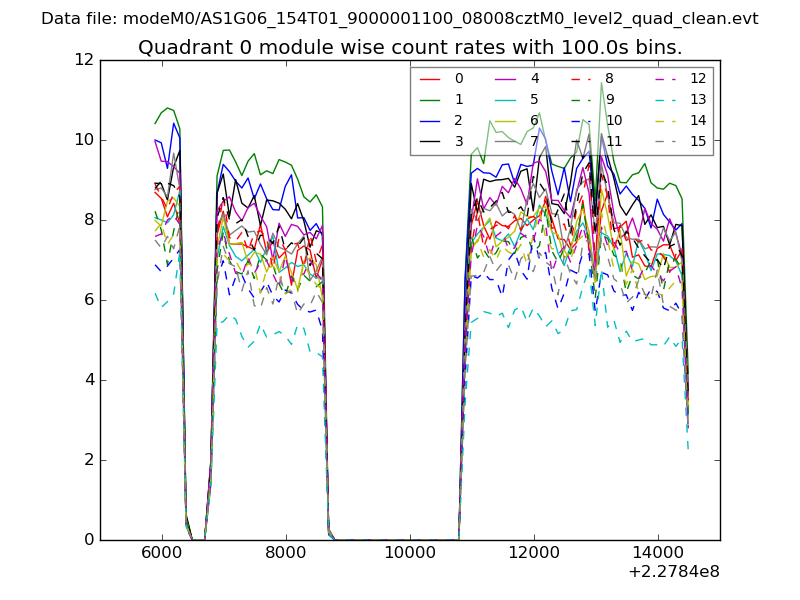 |
 |
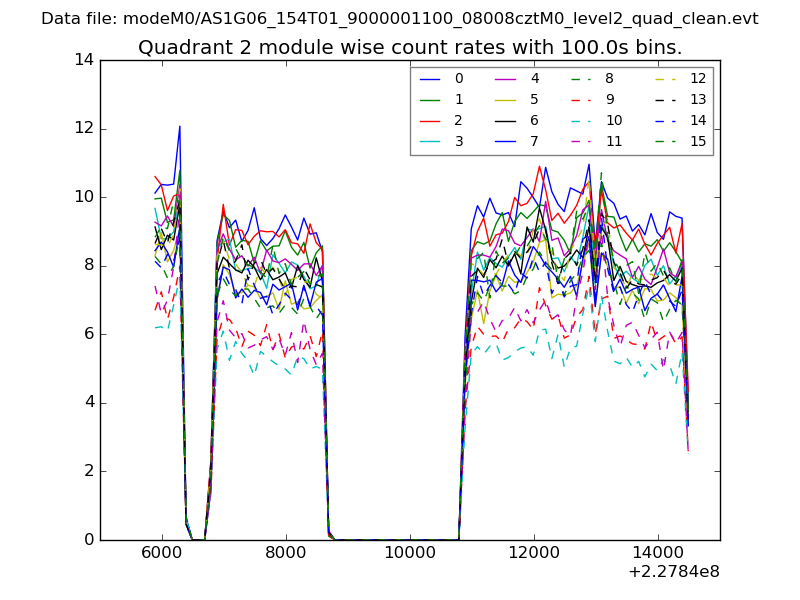
| Module-wise count rates for Quadrant B Data is divided into 100 sec bins |
 |
 |
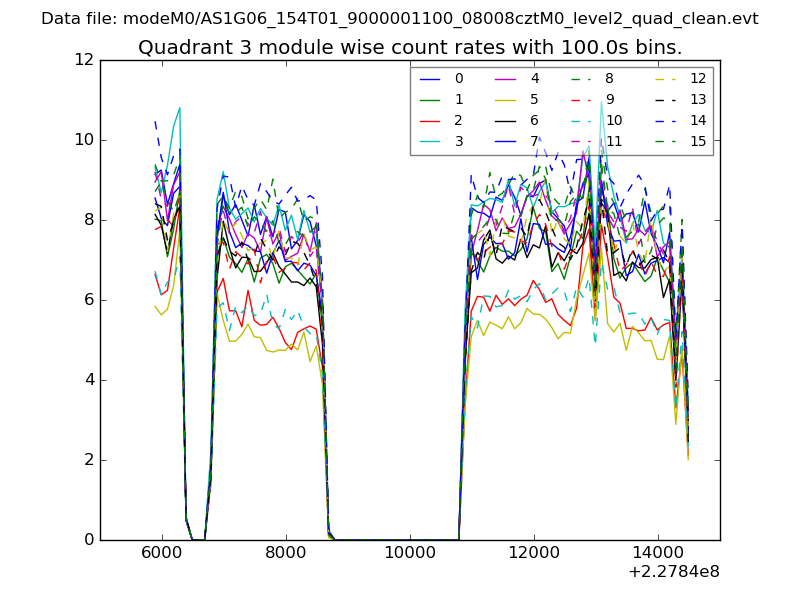
| Module-wise count rates for Quadrant C Data is divided into 100 sec bins |
 |
 |
| Module-wise count rates for Quadrant D Data is divided into 100 sec bins |
 |
 |
| Parameter | Plot |
|---|---|
| CZT HV Monitor | 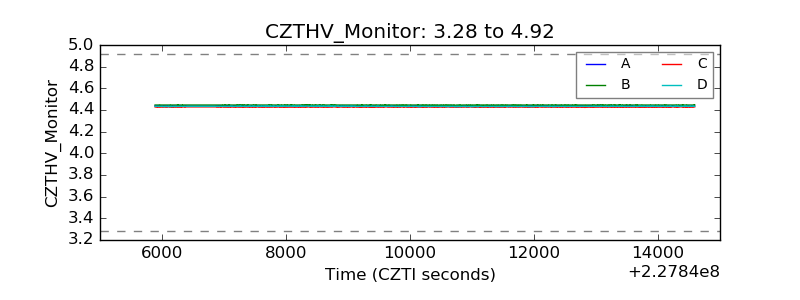 |
| D_VDD | 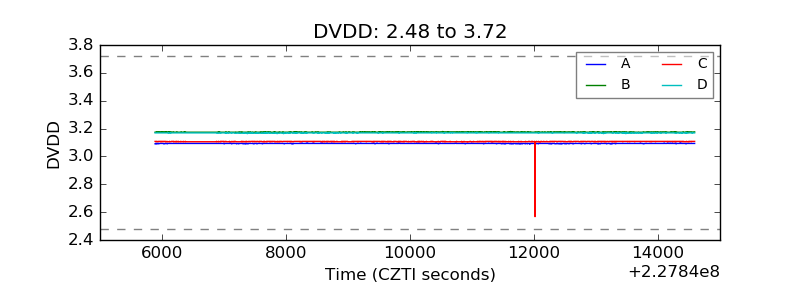 |
| Temperature 1 |  |
| Veto HV Monitor | 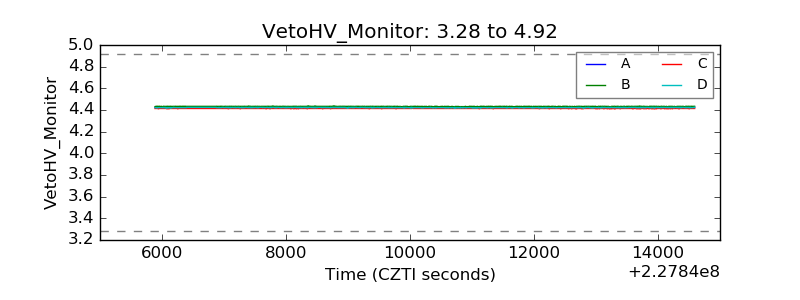 |
| Veto LLD | 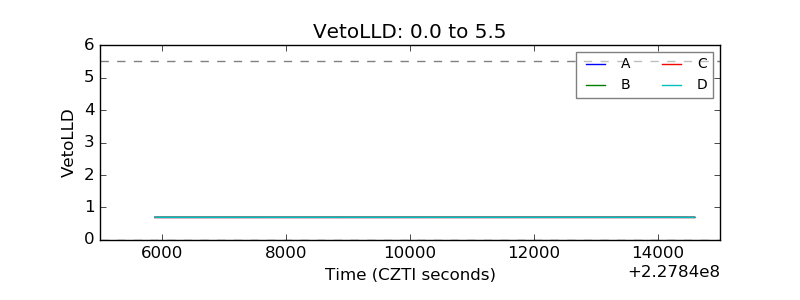 |
| Alpha Counter | 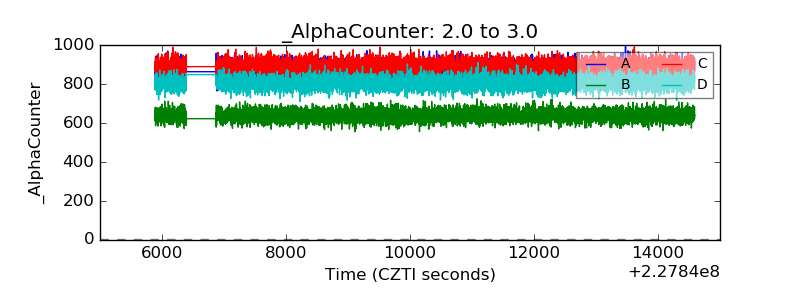 |
| _CPM_Rate | 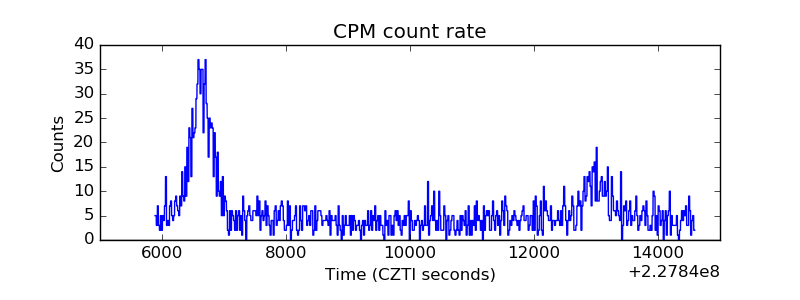 |
| CZT Counter | 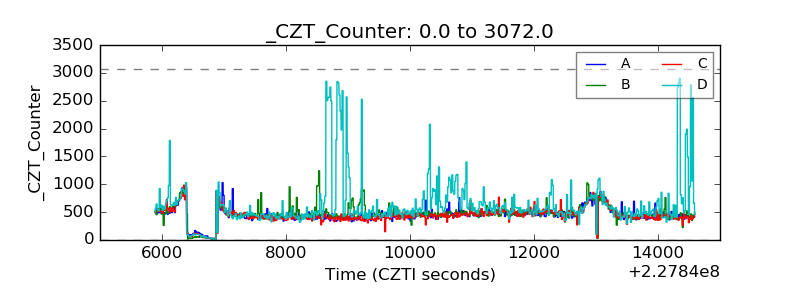 |
| +2.5 Volts monitor |  |
| +5 Volts monitor |  |
| _ROLL_ROT | 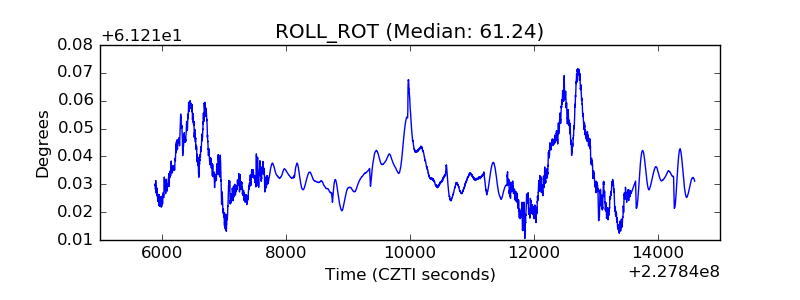 |
| _Roll_DEC |  |
| _Roll_RA | 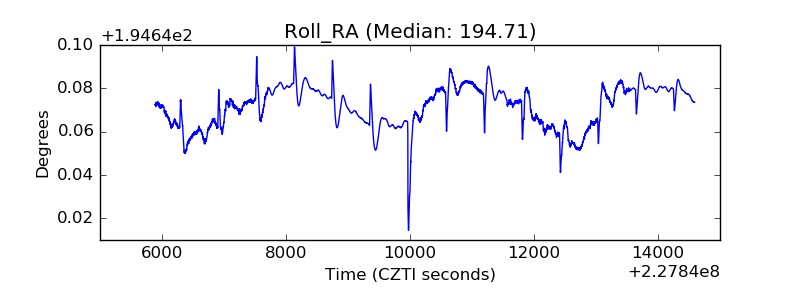 |
| Veto Counter | 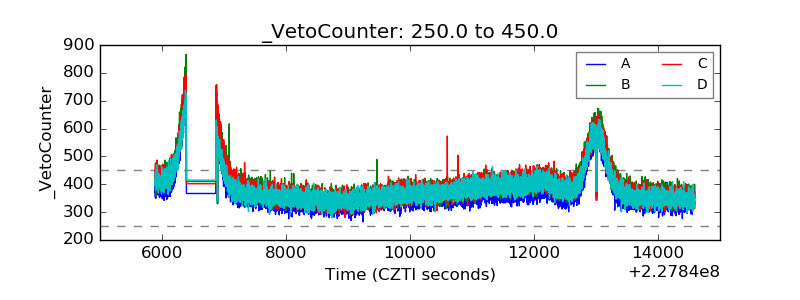 |