| Param | Original file | Final file |
|---|---|---|
| Filename | modeM0/AS1G06_154T01_9000001100_08009cztM0_level2.evt | modeM0/AS1G06_154T01_9000001100_08009cztM0_level2_quad_clean.evt |
| Size (bytes) | 556,801,920 | 88,937,280 |
| Size | 531.0 MB | 84.8 MB |
| Events in quadrant A | 3,355,659 | 546,732 |
| Events in quadrant B | 3,447,565 | 561,978 |
| Events in quadrant C | 3,325,839 | 562,561 |
| Events in quadrant D | 6,233,475 | 508,891 |
| Mode M9 | |||
|---|---|---|---|
| Quadrant | BADHDUFLAG | Total packets | Discarded packets |
| A | 0 | 1 | 0 |
| B | 0 | 1 | 0 |
| C | 0 | 1 | 0 |
| D | 0 | 1 | 0 |
| Mode SS | |||
|---|---|---|---|
| Quadrant | BADHDUFLAG | Total packets | Discarded packets |
| A | 0 | 148 | 0 |
| B | 0 | 148 | 0 |
| C | 0 | 148 | 0 |
| D | 0 | 148 | 0 |
| Mode M0 | |||
|---|---|---|---|
| Quadrant | BADHDUFLAG | Total packets | Discarded packets |
| A | 0 | 15211 | 28 |
| B | 0 | 15273 | 53 |
| C | 0 | 15180 | 43 |
| D | 0 | 23619 | 128 |
| Quadrant | Total seconds | Saturated seconds | Saturation percentage |
|---|---|---|---|
| A | 7379 | 202 | 2.737498% |
| B | 7366 | 196 | 2.660874% |
| C | 7371 | 109 | 1.478768% |
| D | 7361 | 836 | 11.357153% |
Noise dominated data is calculated using 1-second bins in cleaned event files. If a bin has >2000 counts, and if more than 50% of those come from <1% of pixels, then it is considered to be noise-dominated and hence unusable.
| Quadrant | # 1 sec bins | Bins with >0 counts | Bins with >2000 counts | High rate bins dominated by noise | Noise dominated (total time) | Noise dominated (detector-on time) | Marked lightcurve |
|---|---|---|---|---|---|---|---|
| A | 7452 | 7392 | 1 | 1 | 0.01% | 0.01% | 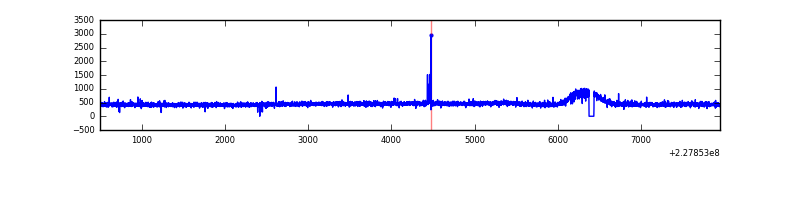 |
| B | 7452 | 7392 | 1 | 1 | 0.01% | 0.01% | 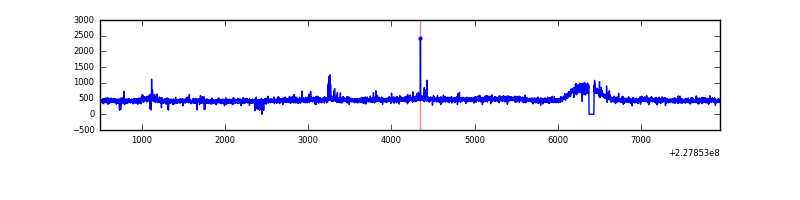 |
| C | 7452 | 7392 | 0 | 0 | 0.00% | 0.00% | 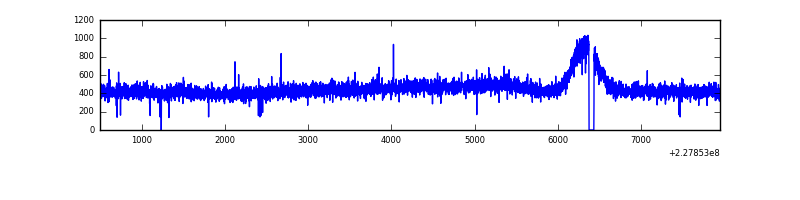 |
| D | 7452 | 7388 | 609 | 609 | 8.17% | 8.24% | 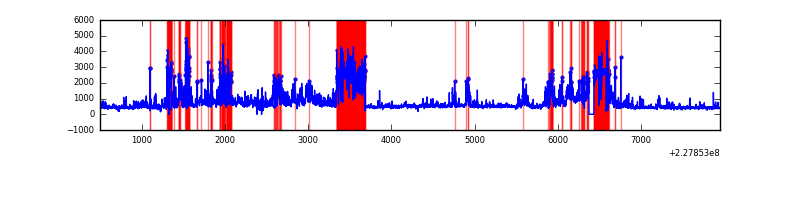 |
Top three noisy pixels from each quadrant. If the there are fewer than three noisy pixels in the level2.evt file, extra rows are filled as -1
| Pixel properties | Quadrant properties | ||||||
|---|---|---|---|---|---|---|---|
| Quadrant | DetID | PixID | Counts | Sigma | Mean | Median | Sigma |
| A | 0 | 103 | 13291 | 69.7 | 865 | 843 | 178.6 |
| A | 13 | 14 | 10951 | 56.6 | 865 | 843 | 178.6 |
| A | 0 | 226 | 8754 | 44.3 | 865 | 843 | 178.6 |
| B | 11 | 51 | 33670 | 190.54 | 870 | 846 | 172.3 |
| B | 5 | 250 | 23105 | 129.21 | 870 | 846 | 172.3 |
| B | 12 | 111 | 19614 | 108.95 | 870 | 846 | 172.3 |
| C | 13 | 61 | 6404 | 28.24 | 847 | 850 | 196.7 |
| C | 8 | 128 | 5256 | 22.4 | 847 | 850 | 196.7 |
| C | 8 | 222 | 4747 | 19.81 | 847 | 850 | 196.7 |
| D | 11 | 144 | 1880336 | 9847.7 | 786 | 764 | 190.9 |
| D | 1 | 52 | 1167998 | 6115.53 | 786 | 764 | 190.9 |
| D | 2 | 14 | 91900 | 477.49 | 786 | 764 | 190.9 |
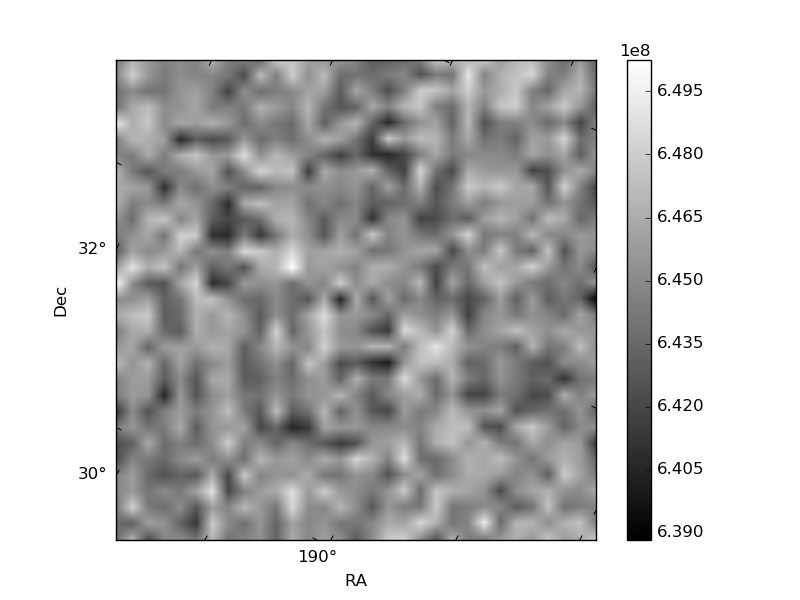
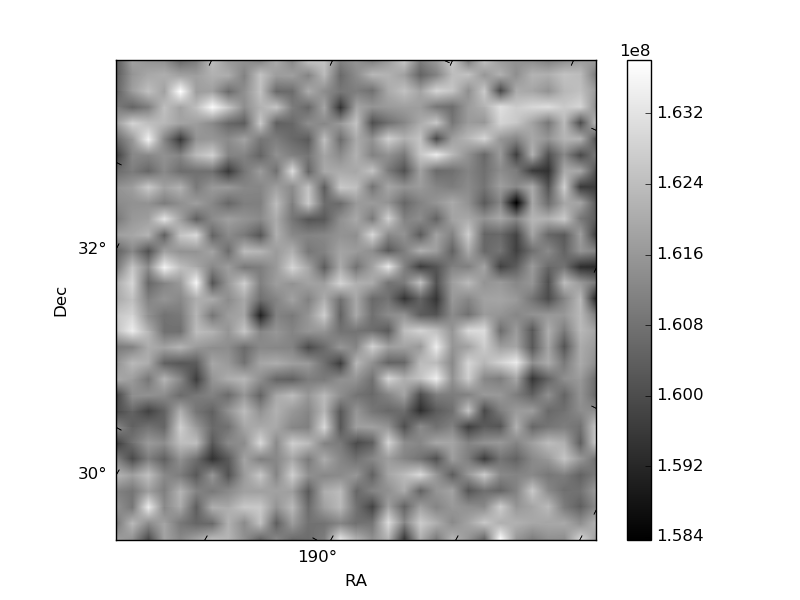
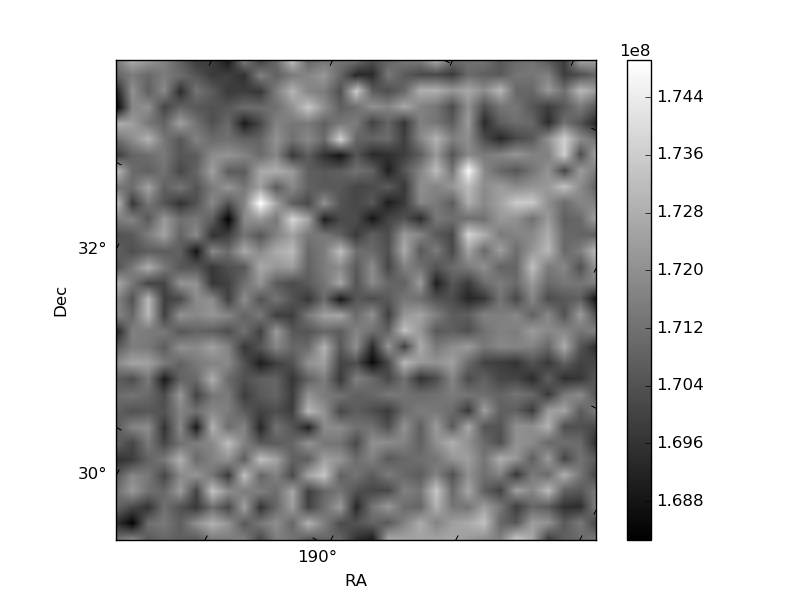
Histogram calculated using DETX and DETY for each event in the final _common_clean file
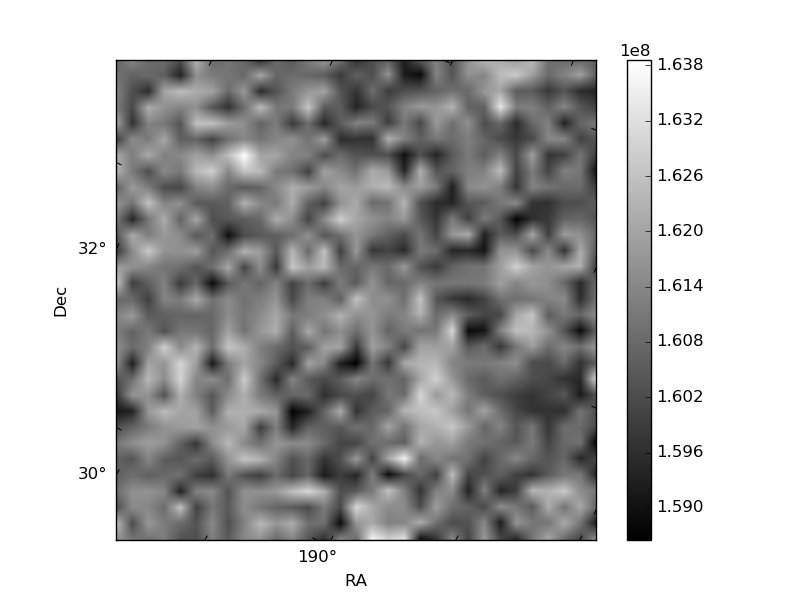
| Quadrant A | 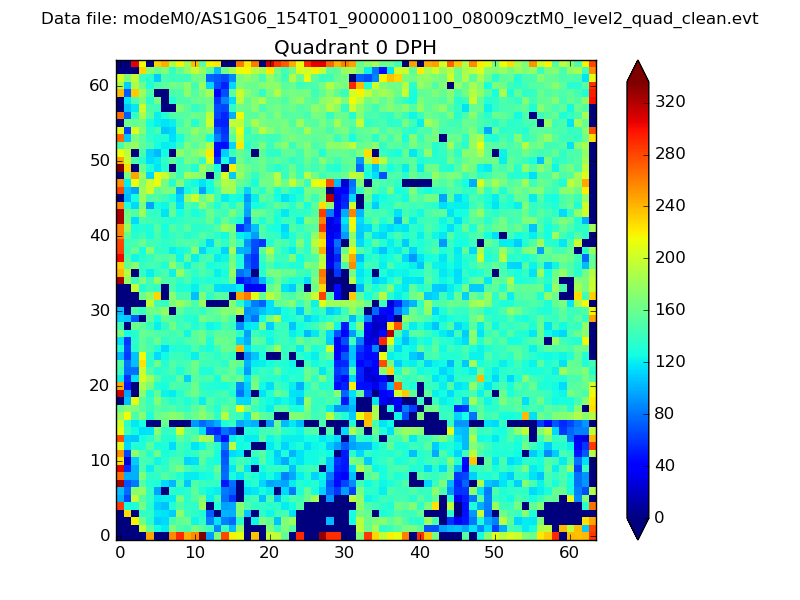 |
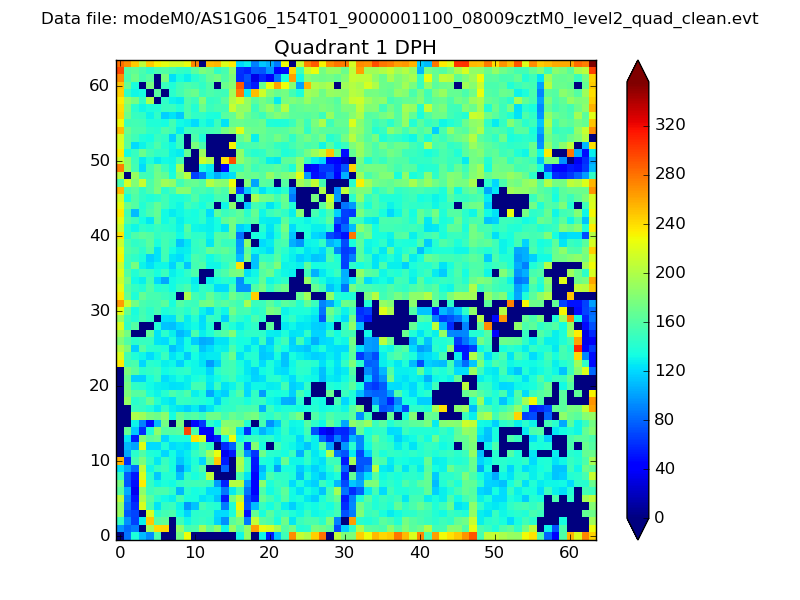 |
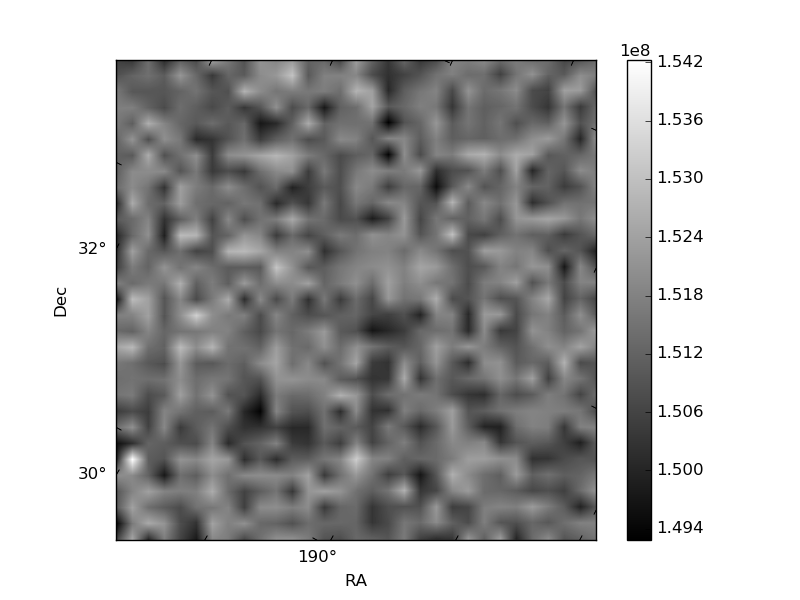
Quadrant B |
|---|---|---|---|
| Quadrant D | 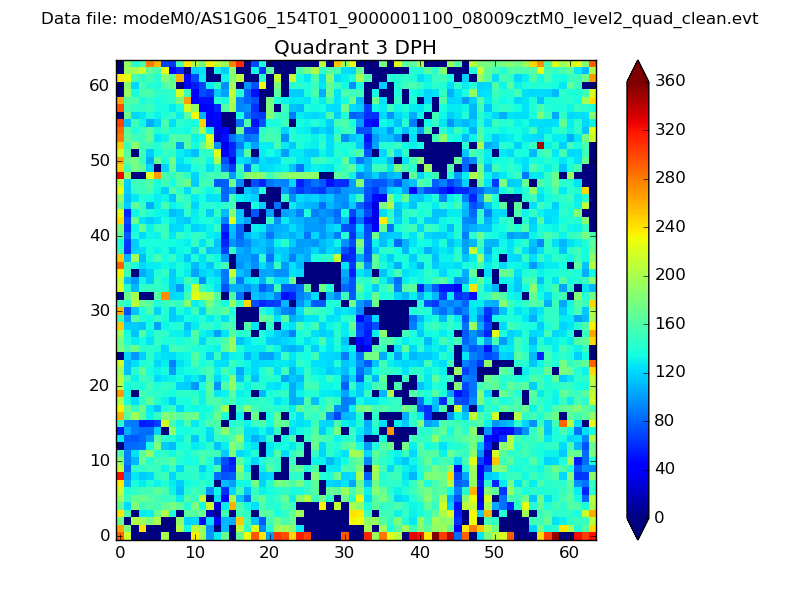 |
 |
Quadrant C |
| Plot type | Count rate plots | Images |
|---|---|---|
| Comparison with Poisson distribution Blue bars denote a histogram of data divided into 1 sec bins. Red curve is a Poisson curve with rate = median count rate of data. |
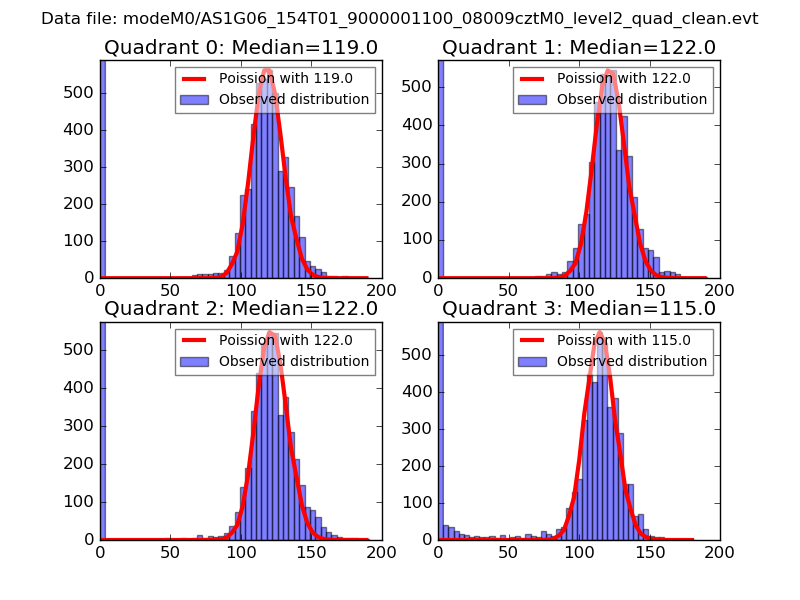 |
 |
| Quadrant-wise count rates Data is divided into 100 sec bins |
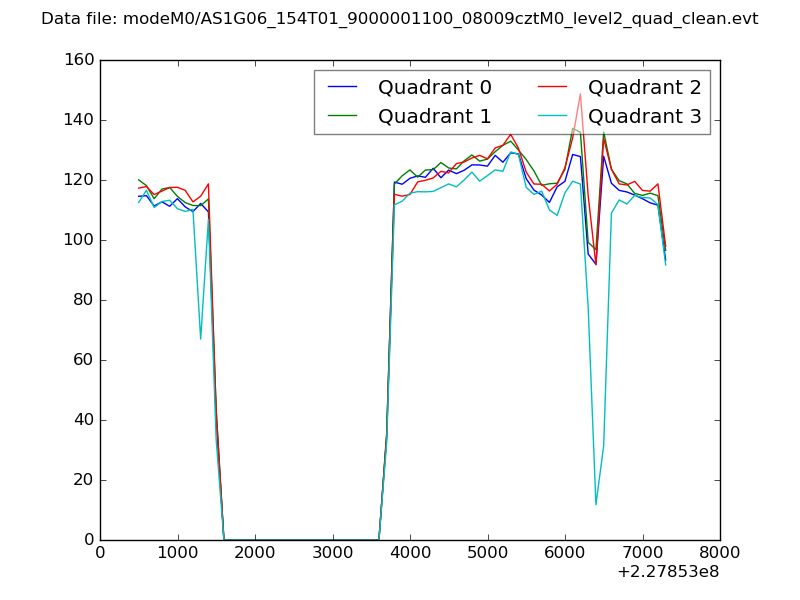 |
|
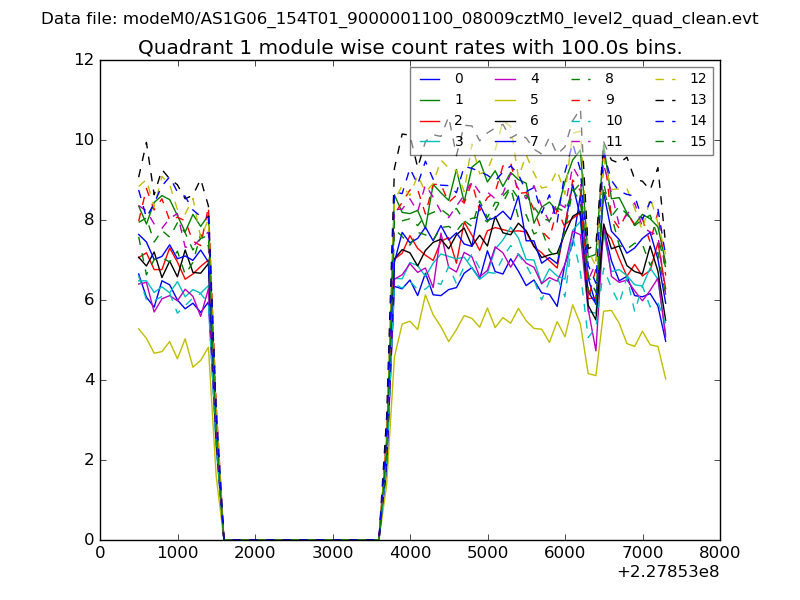
| Module-wise count rates for Quadrant A Data is divided into 100 sec bins |
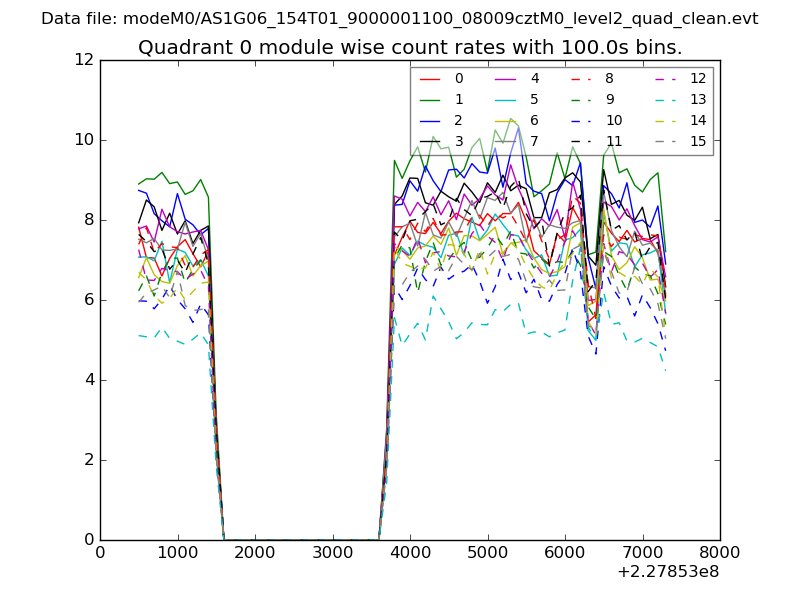 |
 |
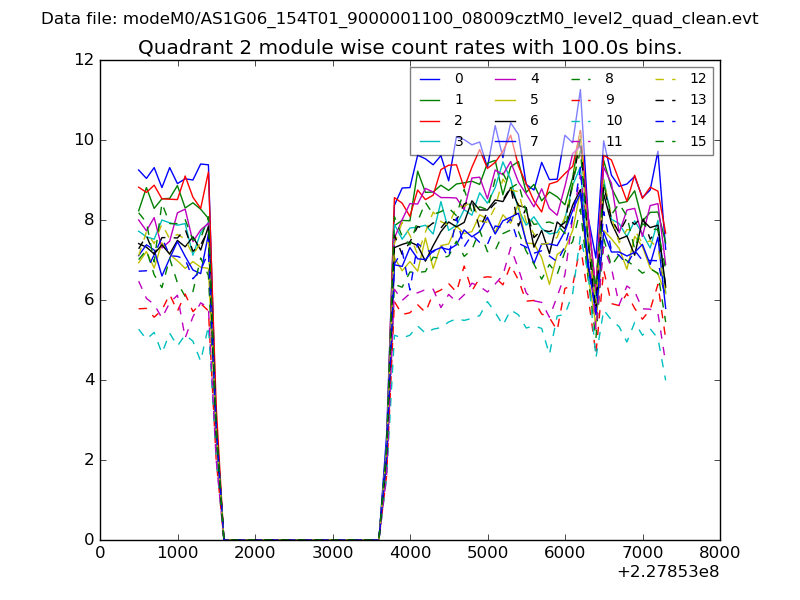
| Module-wise count rates for Quadrant B Data is divided into 100 sec bins |
 |
 |
| Module-wise count rates for Quadrant C Data is divided into 100 sec bins |
 |
 |
| Module-wise count rates for Quadrant D Data is divided into 100 sec bins |
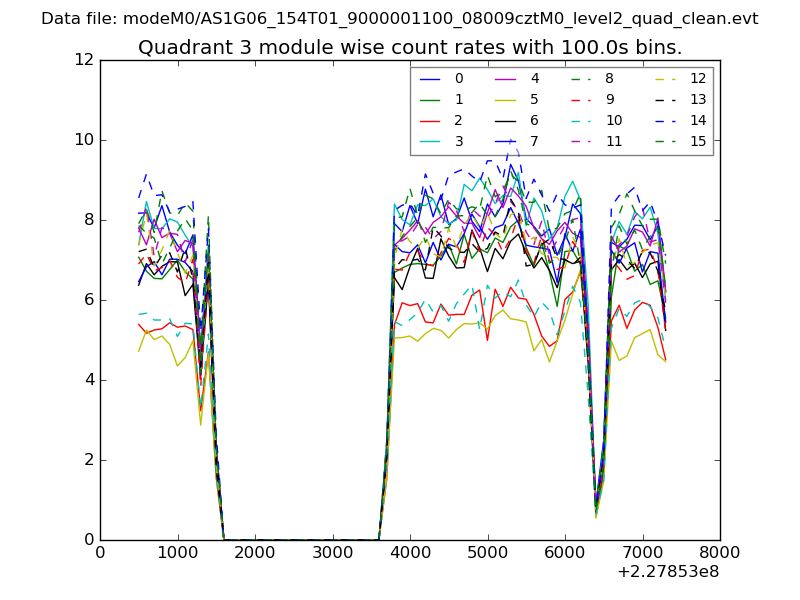 |
 |
| Parameter | Plot |
|---|---|
| CZT HV Monitor | 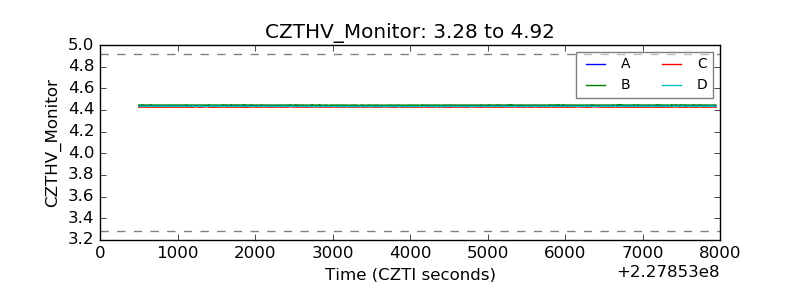 |
| D_VDD | 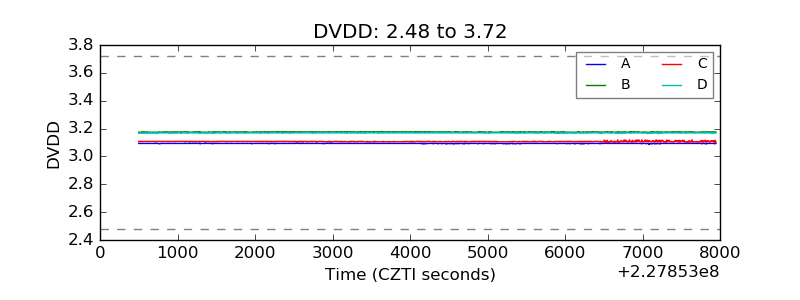 |
| Temperature 1 | 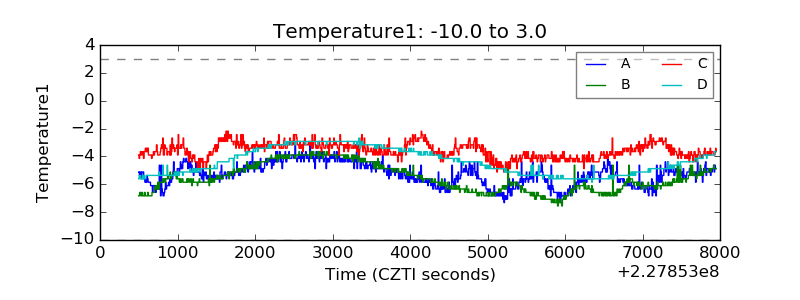 |
| Veto HV Monitor | 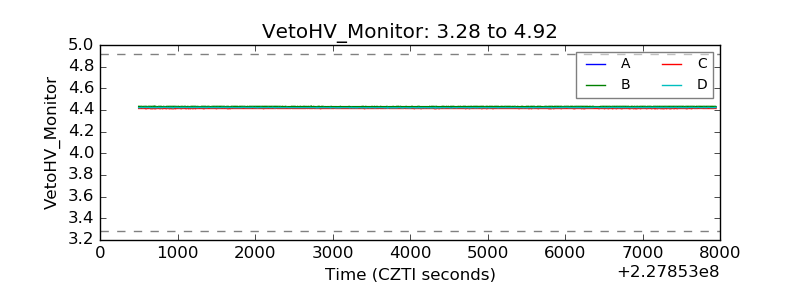 |
| Veto LLD | 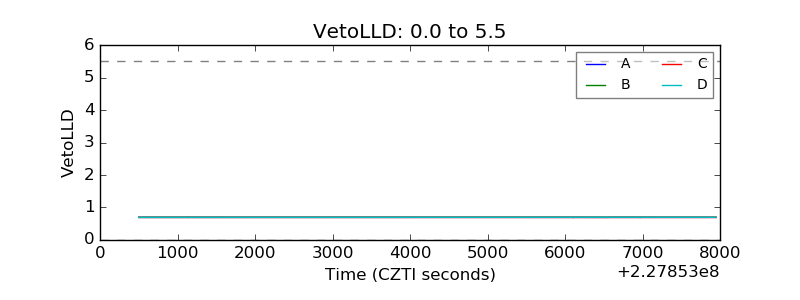 |
| Alpha Counter | 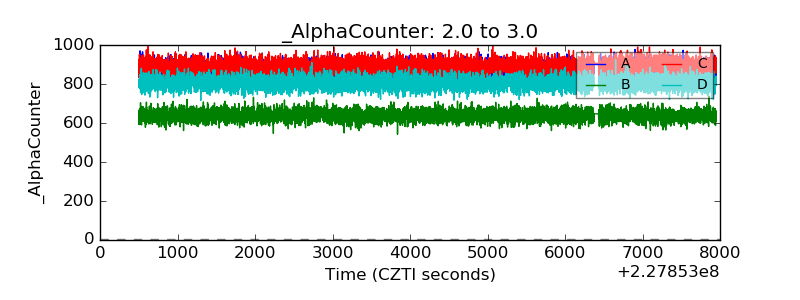 |
| _CPM_Rate | 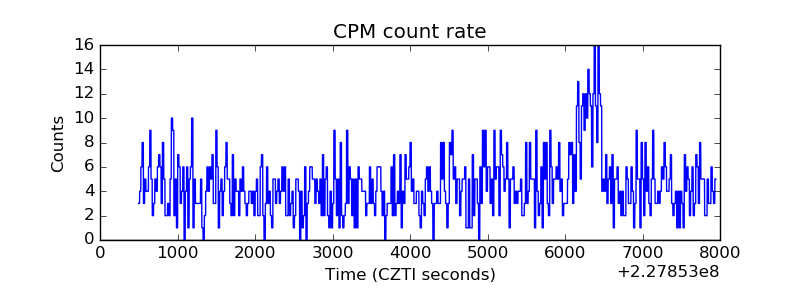 |
| CZT Counter |  |
| +2.5 Volts monitor |  |
| +5 Volts monitor |  |
| _ROLL_ROT | 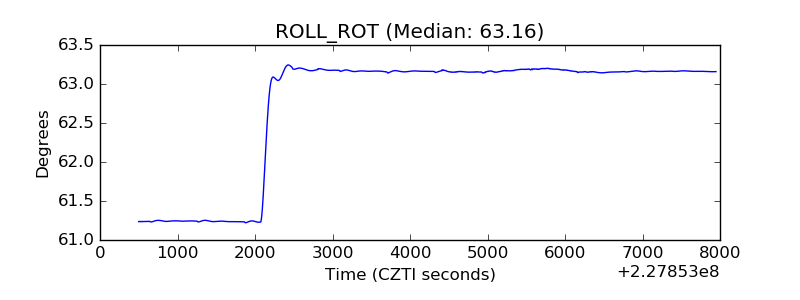 |
| _Roll_DEC | 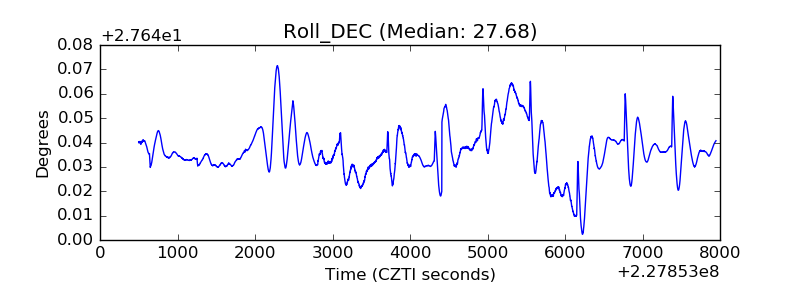 |
| _Roll_RA |  |
| Veto Counter | 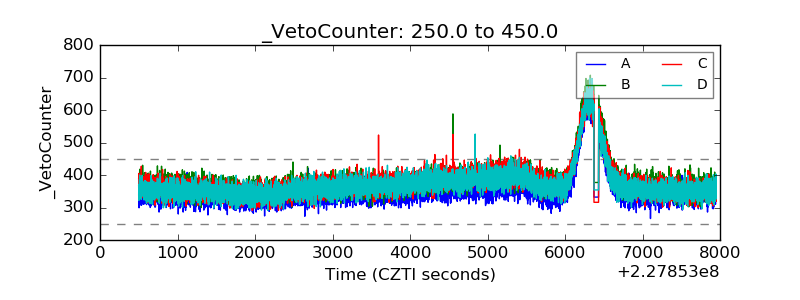 |