| Param | Original file | Final file |
|---|---|---|
| Filename | modeM0/AS1G06_154T01_9000001100_08012cztM0_level2.evt | modeM0/AS1G06_154T01_9000001100_08012cztM0_level2_quad_clean.evt |
| Size (bytes) | 997,732,800 | 180,766,080 |
| Size | 951.5 MB | 172.4 MB |
| Events in quadrant A | 7,147,318 | 1,095,836 |
| Events in quadrant B | 7,158,510 | 1,124,176 |
| Events in quadrant C | 7,012,971 | 1,118,205 |
| Events in quadrant D | 7,860,937 | 1,080,106 |
| Mode M9 | |||
|---|---|---|---|
| Quadrant | BADHDUFLAG | Total packets | Discarded packets |
| A | 0 | 16 | 0 |
| B | 0 | 16 | 0 |
| C | 0 | 16 | 0 |
| D | 0 | 16 | 0 |
| Mode SS | |||
|---|---|---|---|
| Quadrant | BADHDUFLAG | Total packets | Discarded packets |
| A | 0 | 312 | 0 |
| B | 0 | 312 | 0 |
| C | 0 | 312 | 2 |
| D | 0 | 312 | 2 |
| Mode M0 | |||
|---|---|---|---|
| Quadrant | BADHDUFLAG | Total packets | Discarded packets |
| A | 0 | 31773 | 57 |
| B | 0 | 31385 | 35 |
| C | 0 | 31365 | 48 |
| D | 0 | 34164 | 31 |
| Quadrant | Total seconds | Saturated seconds | Saturation percentage |
|---|---|---|---|
| A | 15302 | 290 | 1.895177% |
| B | 15314 | 261 | 1.704323% |
| C | 15307 | 205 | 1.339257% |
| D | 15316 | 345 | 2.252546% |
Noise dominated data is calculated using 1-second bins in cleaned event files. If a bin has >2000 counts, and if more than 50% of those come from <1% of pixels, then it is considered to be noise-dominated and hence unusable.
| Quadrant | # 1 sec bins | Bins with >0 counts | Bins with >2000 counts | High rate bins dominated by noise | Noise dominated (total time) | Noise dominated (detector-on time) | Marked lightcurve |
|---|---|---|---|---|---|---|---|
| A | 16914 | 15328 | 6 | 6 | 0.04% | 0.04% | 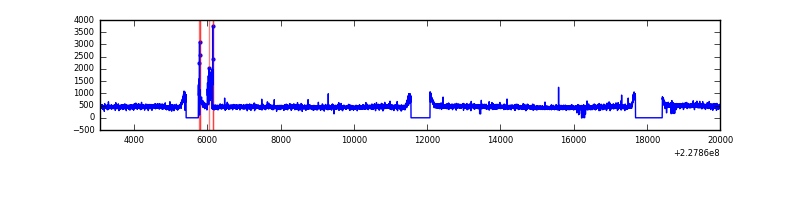 |
| B | 16914 | 15332 | 1 | 1 | 0.01% | 0.01% | 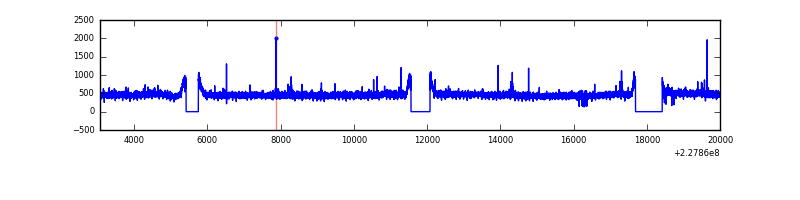 |
| C | 16914 | 15332 | 0 | 0 | 0.00% | 0.00% | 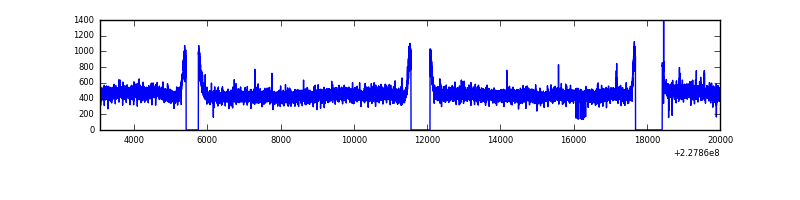 |
| D | 16914 | 15331 | 93 | 93 | 0.55% | 0.61% | 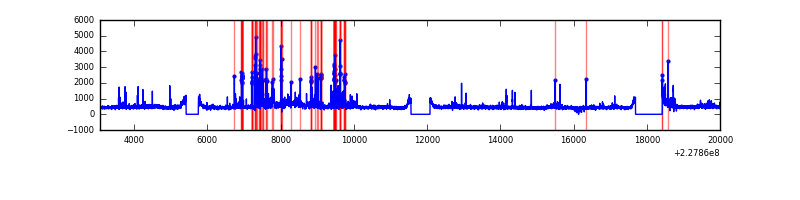 |
Top three noisy pixels from each quadrant. If the there are fewer than three noisy pixels in the level2.evt file, extra rows are filled as -1
| Pixel properties | Quadrant properties | ||||||
|---|---|---|---|---|---|---|---|
| Quadrant | DetID | PixID | Counts | Sigma | Mean | Median | Sigma |
| A | 15 | 234 | 170861 | 454.09 | 1813 | 1768 | 372.4 |
| A | 0 | 226 | 16797 | 40.36 | 1813 | 1768 | 372.4 |
| A | 12 | 194 | 15351 | 36.48 | 1813 | 1768 | 372.4 |
| B | 12 | 111 | 41235 | 111.42 | 1823 | 1776 | 354.1 |
| B | 11 | 111 | 32971 | 88.09 | 1823 | 1776 | 354.1 |
| B | 5 | 250 | 30856 | 82.11 | 1823 | 1776 | 354.1 |
| C | 1 | 16 | 30726 | 70.14 | 1777 | 1787 | 412.6 |
| C | 8 | 128 | 24667 | 55.45 | 1777 | 1787 | 412.6 |
| C | 13 | 61 | 13418 | 28.19 | 1777 | 1787 | 412.6 |
| D | 11 | 144 | 606211 | 1421.59 | 1763 | 1716 | 425.2 |
| D | 1 | 52 | 272947 | 637.85 | 1763 | 1716 | 425.2 |
| D | 2 | 14 | 166154 | 386.71 | 1763 | 1716 | 425.2 |
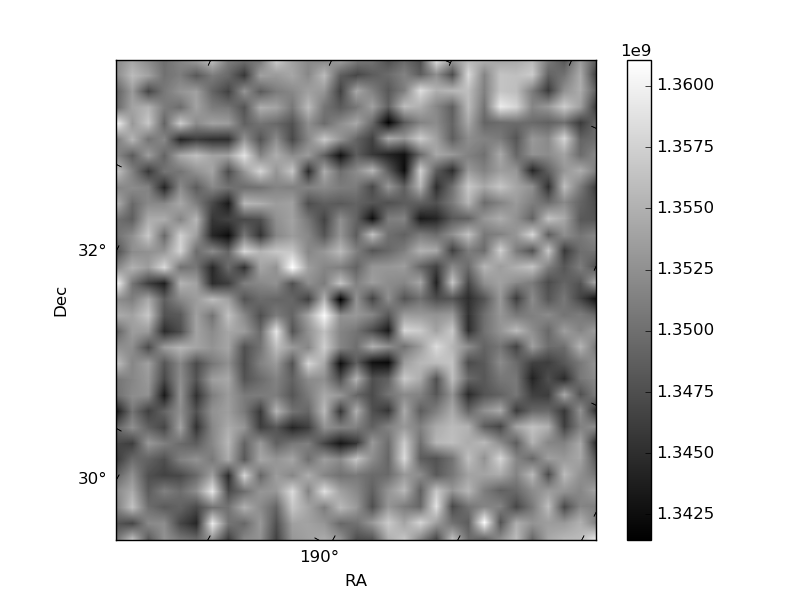
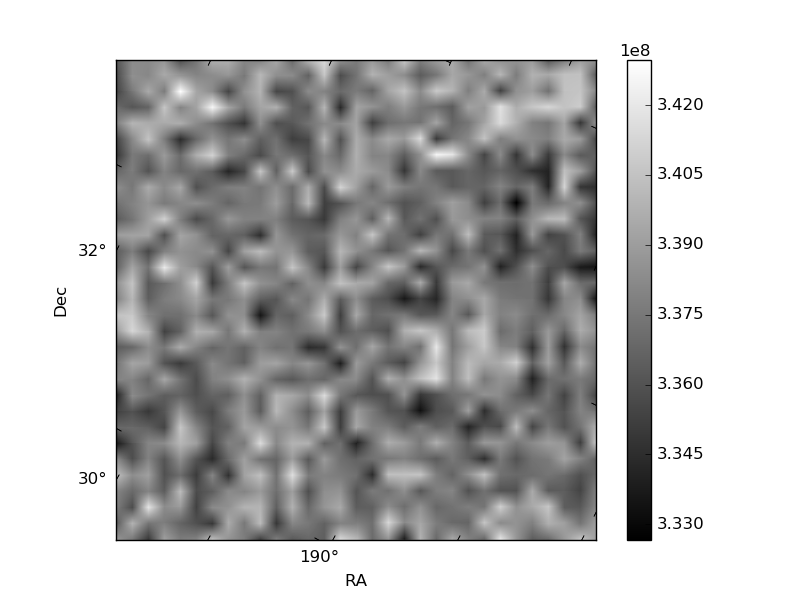
Histogram calculated using DETX and DETY for each event in the final _common_clean file
| Quadrant A | 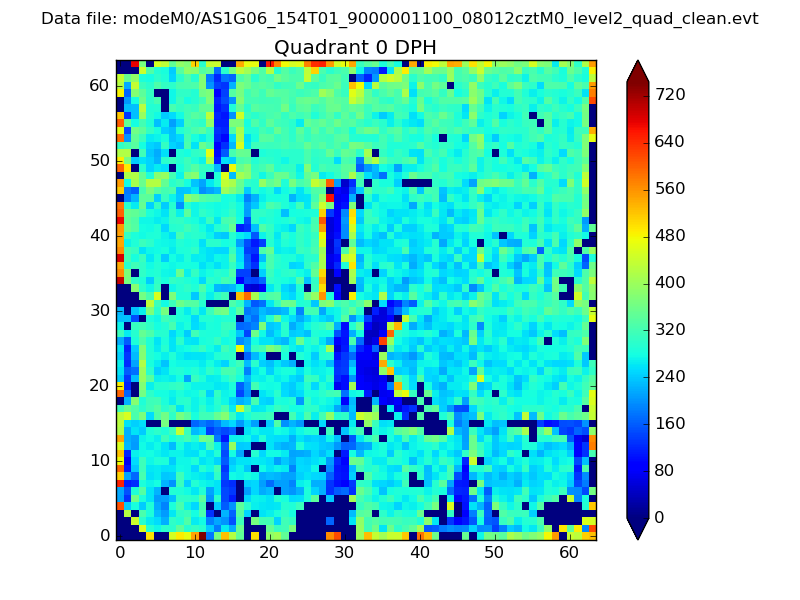 |
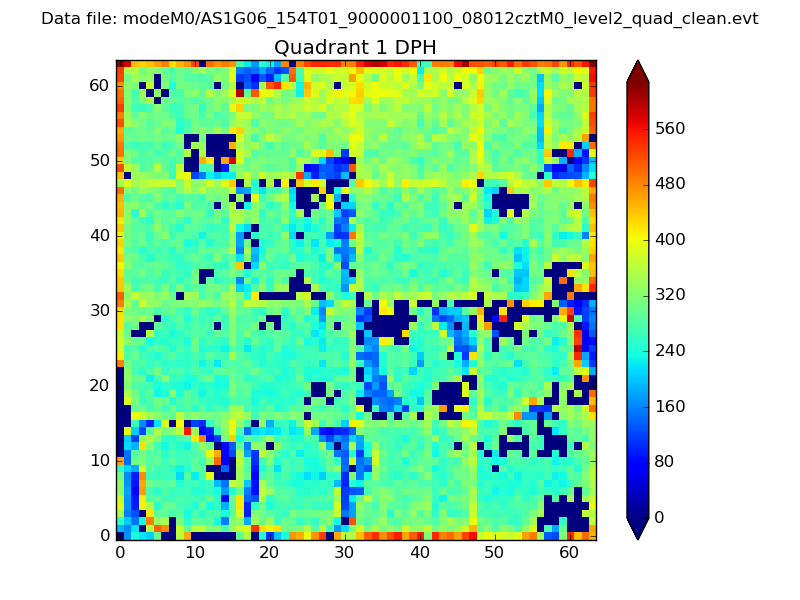 |
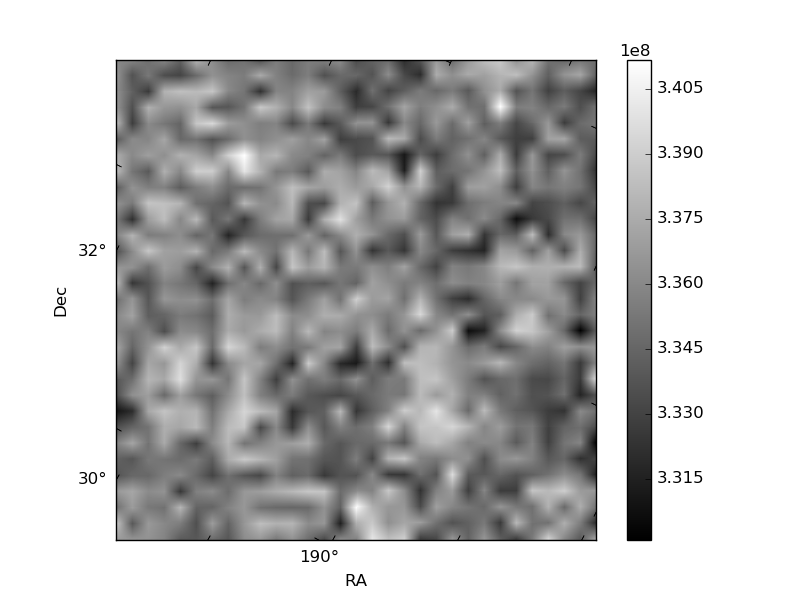
Quadrant B |
|---|---|---|---|
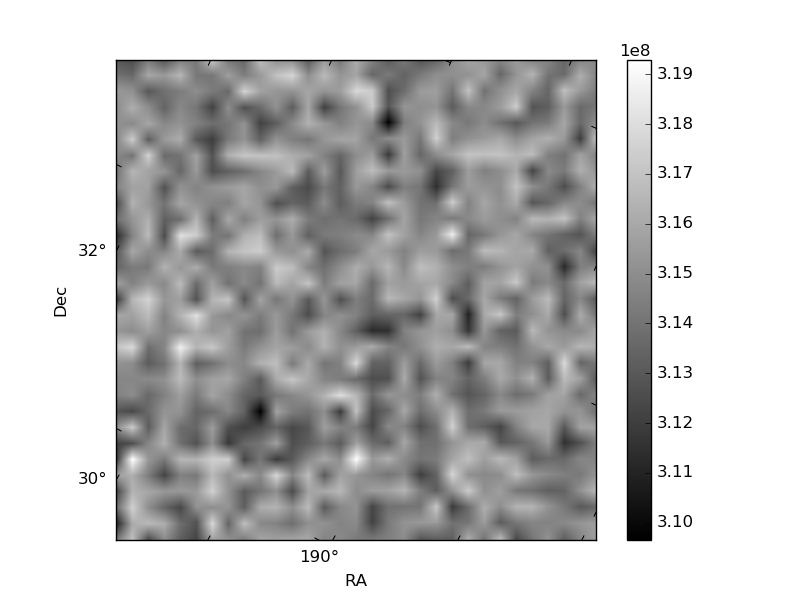
| Quadrant D | 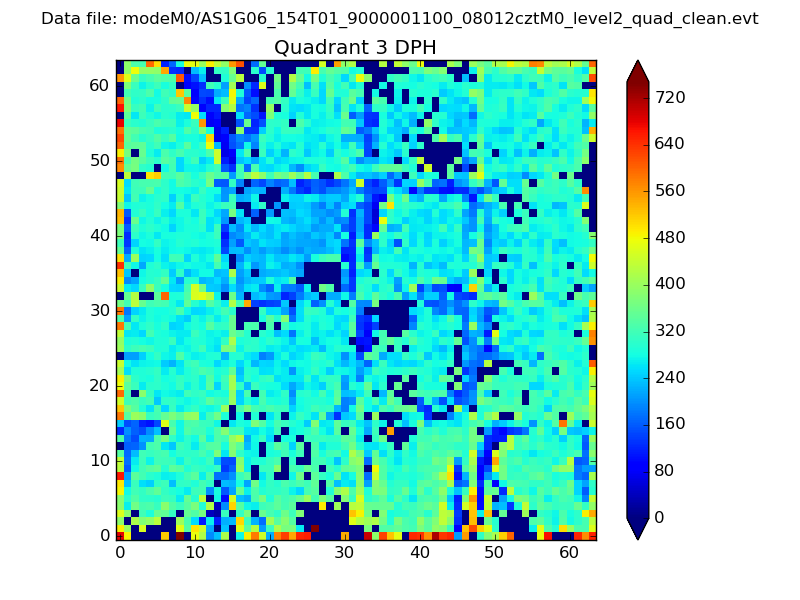 |
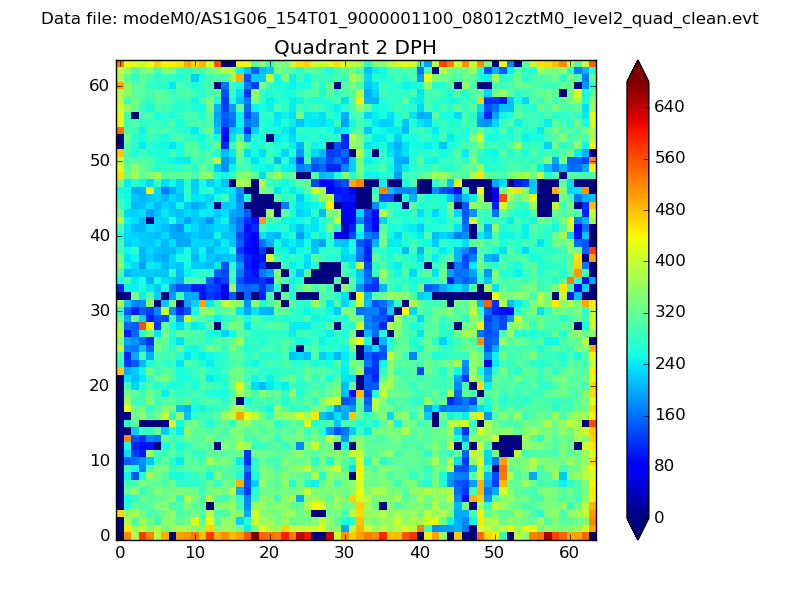 |
Quadrant C |
| Plot type | Count rate plots | Images |
|---|---|---|
| Comparison with Poisson distribution Blue bars denote a histogram of data divided into 1 sec bins. Red curve is a Poisson curve with rate = median count rate of data. |
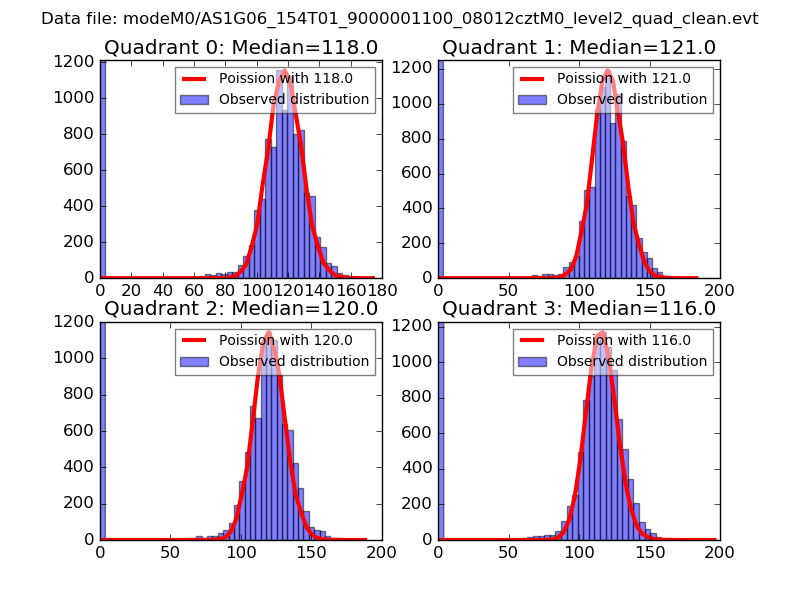 |
 |
| Quadrant-wise count rates Data is divided into 100 sec bins |
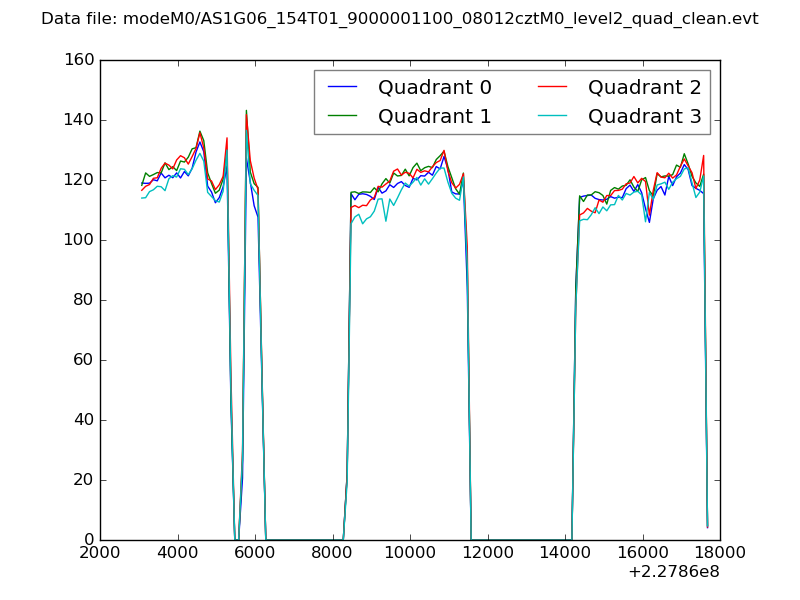 |
|
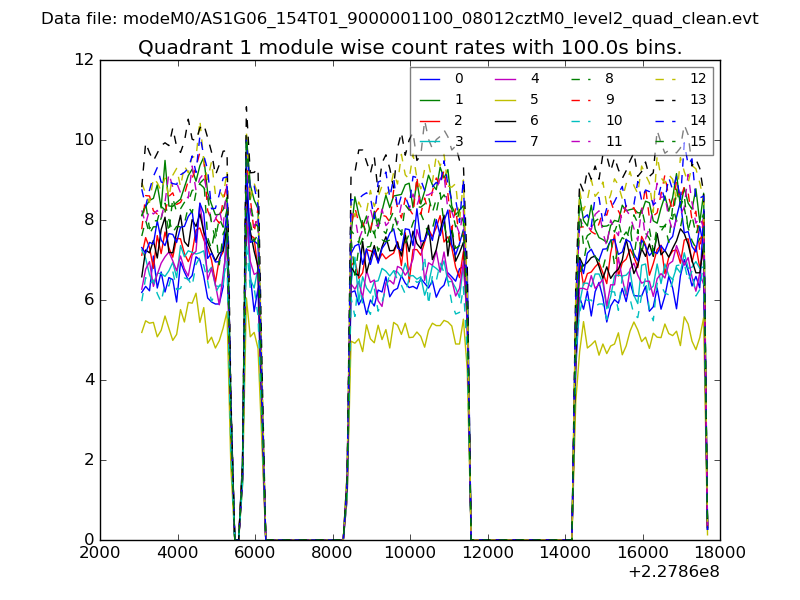
| Module-wise count rates for Quadrant A Data is divided into 100 sec bins |
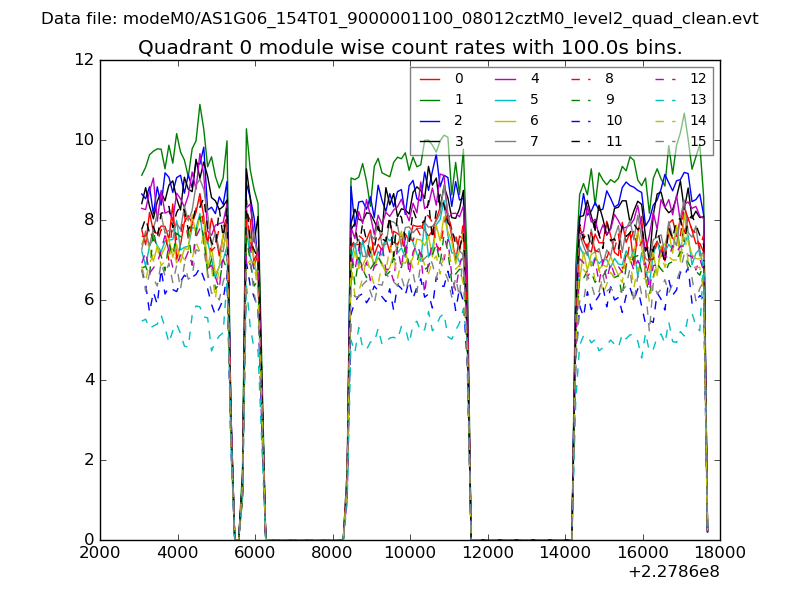 |
 |
| Module-wise count rates for Quadrant B Data is divided into 100 sec bins |
 |
 |
| Module-wise count rates for Quadrant C Data is divided into 100 sec bins |
 |
 |
| Module-wise count rates for Quadrant D Data is divided into 100 sec bins |
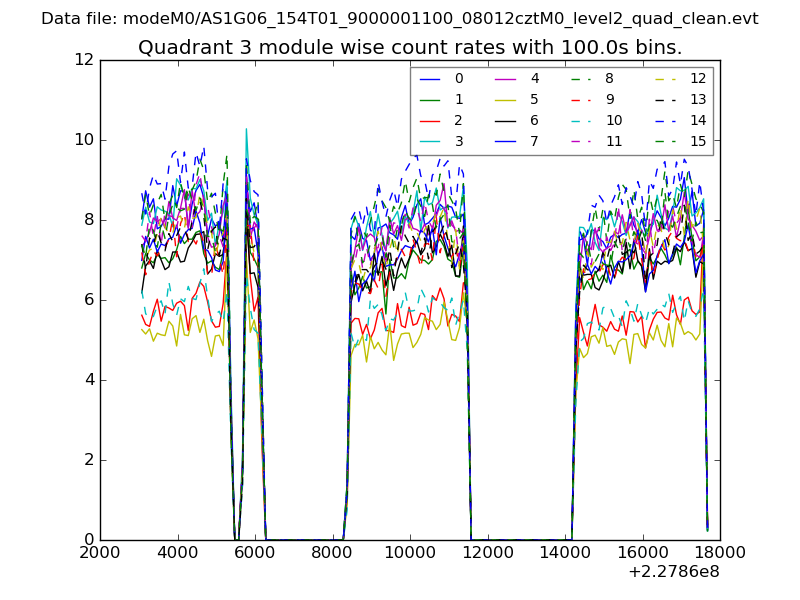 |
 |
| Parameter | Plot |
|---|---|
| CZT HV Monitor | 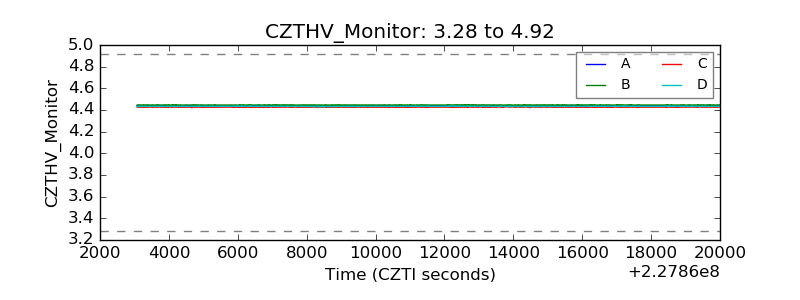 |
| D_VDD | 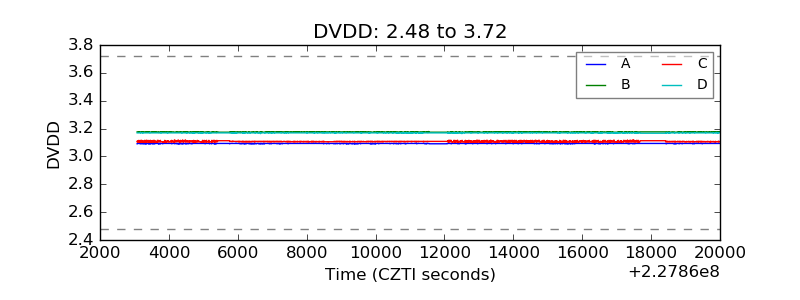 |
| Temperature 1 | 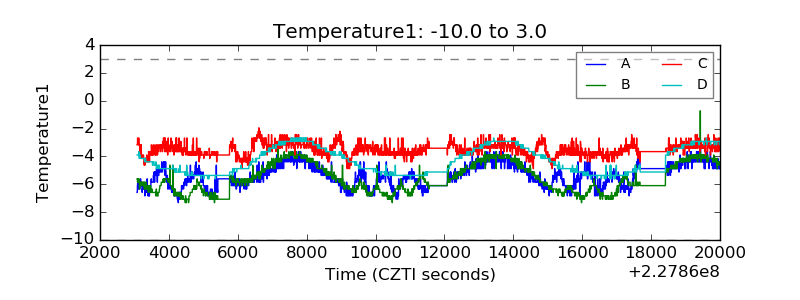 |
| Veto HV Monitor | 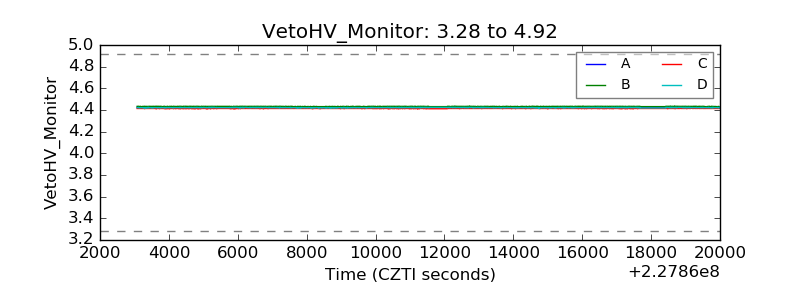 |
| Veto LLD | 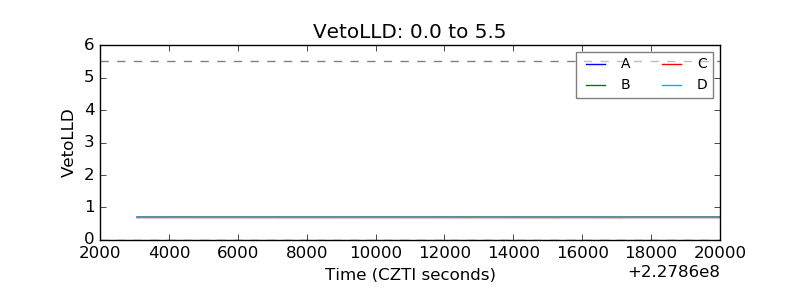 |
| Alpha Counter | 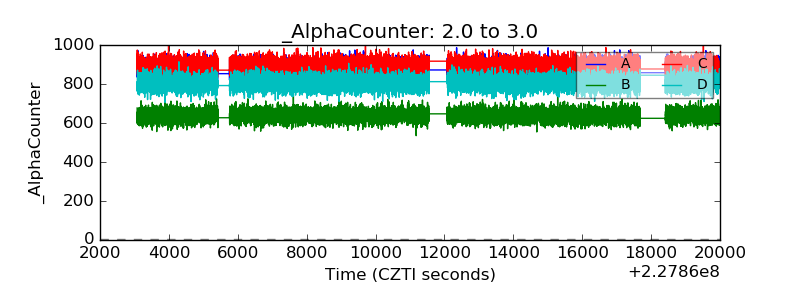 |
| _CPM_Rate | 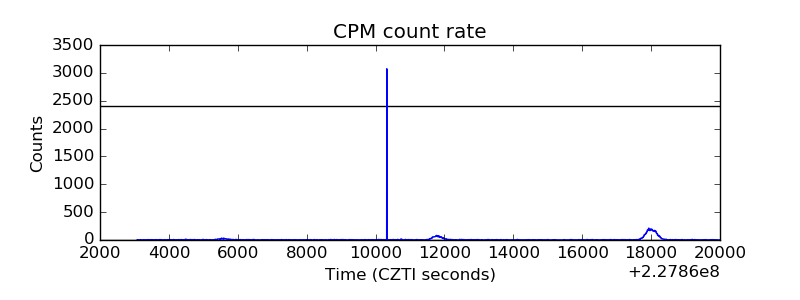 |
| CZT Counter | 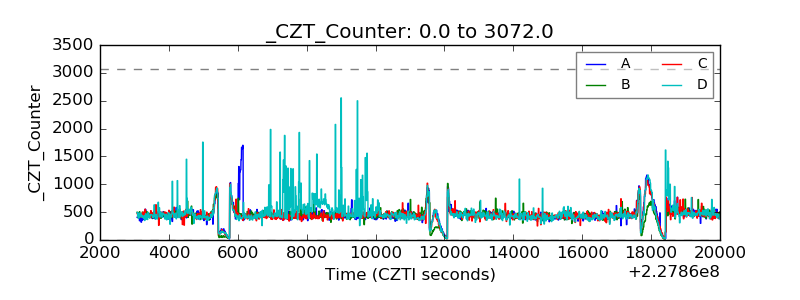 |
| +2.5 Volts monitor | 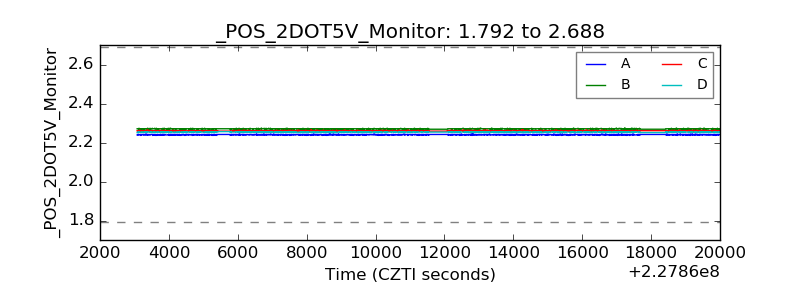 |
| +5 Volts monitor | 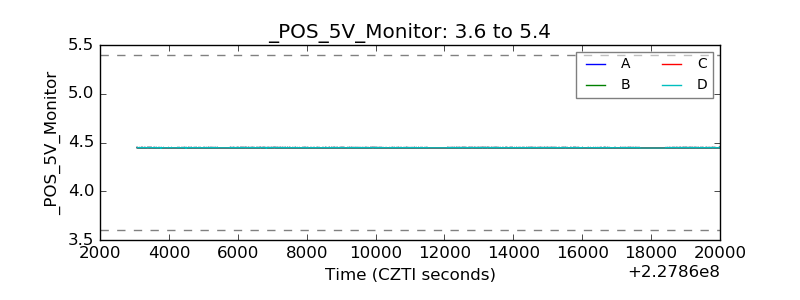 |
| _ROLL_ROT | 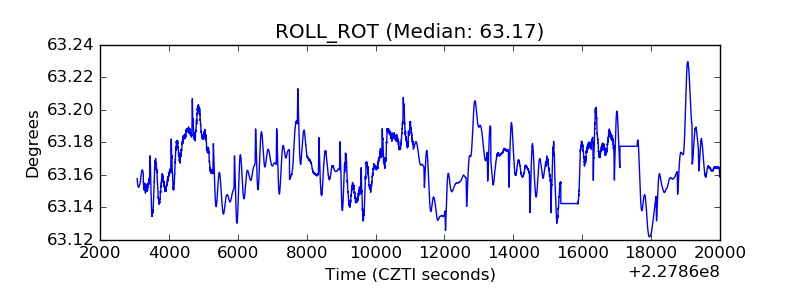 |
| _Roll_DEC | 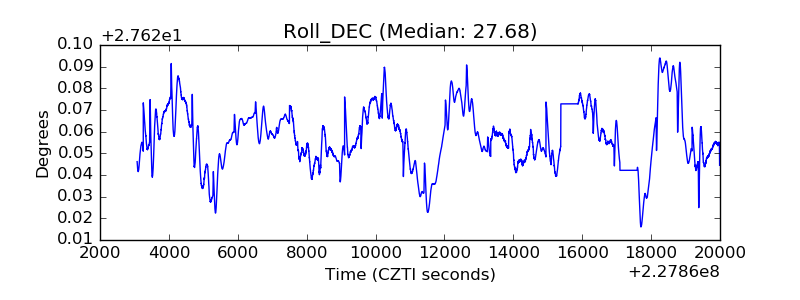 |
| _Roll_RA | 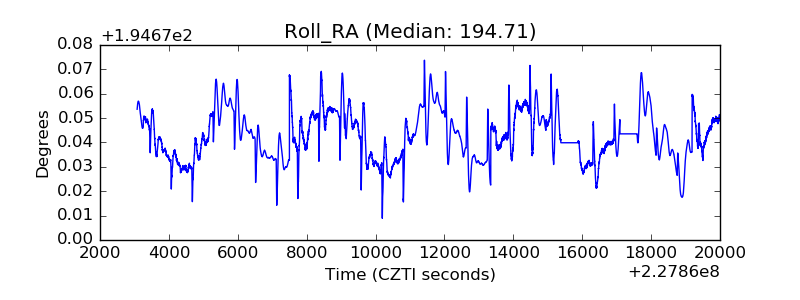 |
| Veto Counter | 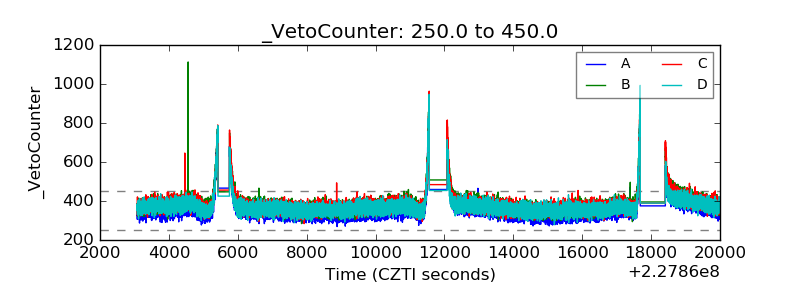 |