| Param | Original file | Final file |
|---|---|---|
| Filename | modeM0/AS1G06_154T01_9000001100_08013cztM0_level2.evt | modeM0/AS1G06_154T01_9000001100_08013cztM0_level2_quad_clean.evt |
| Size (bytes) | 452,822,400 | 76,806,720 |
| Size | 431.8 MB | 73.2 MB |
| Events in quadrant A | 3,272,196 | 458,874 |
| Events in quadrant B | 3,322,204 | 467,248 |
| Events in quadrant C | 3,256,840 | 462,534 |
| Events in quadrant D | 3,388,765 | 451,982 |
| Mode M9 | |||
|---|---|---|---|
| Quadrant | BADHDUFLAG | Total packets | Discarded packets |
| A | 0 | 17 | 0 |
| B | 0 | 17 | 0 |
| C | 0 | 17 | 0 |
| D | 0 | 17 | 0 |
| Mode SS | |||
|---|---|---|---|
| Quadrant | BADHDUFLAG | Total packets | Discarded packets |
| A | 0 | 144 | 0 |
| B | 0 | 144 | 0 |
| C | 0 | 144 | 0 |
| D | 0 | 144 | 0 |
| Mode M0 | |||
|---|---|---|---|
| Quadrant | BADHDUFLAG | Total packets | Discarded packets |
| A | 0 | 14344 | 3 |
| B | 0 | 14364 | 2 |
| C | 0 | 14327 | 2 |
| D | 0 | 14893 | 2 |
| Quadrant | Total seconds | Saturated seconds | Saturation percentage |
|---|---|---|---|
| A | 6963 | 138 | 1.981904% |
| B | 6963 | 127 | 1.823926% |
| C | 6963 | 112 | 1.608502% |
| D | 6963 | 132 | 1.895735% |
Noise dominated data is calculated using 1-second bins in cleaned event files. If a bin has >2000 counts, and if more than 50% of those come from <1% of pixels, then it is considered to be noise-dominated and hence unusable.
| Quadrant | # 1 sec bins | Bins with >0 counts | Bins with >2000 counts | High rate bins dominated by noise | Noise dominated (total time) | Noise dominated (detector-on time) | Marked lightcurve |
|---|---|---|---|---|---|---|---|
| A | 8608 | 6964 | 3 | 3 | 0.03% | 0.04% | 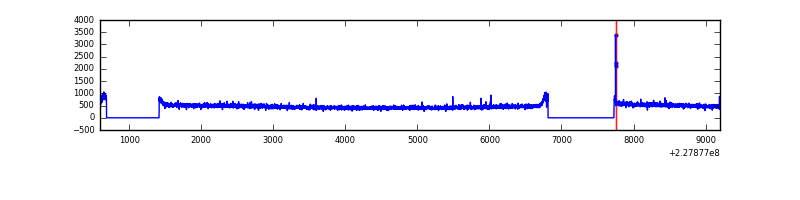 |
| B | 8608 | 6964 | 0 | 0 | 0.00% | 0.00% | 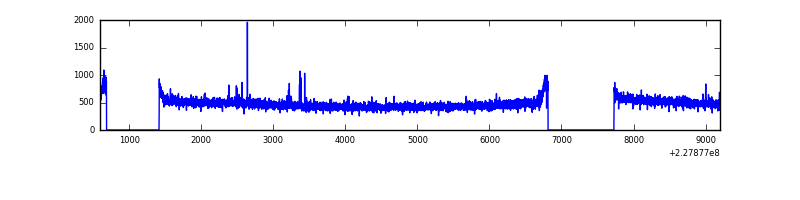 |
| C | 8608 | 6964 | 0 | 0 | 0.00% | 0.00% | 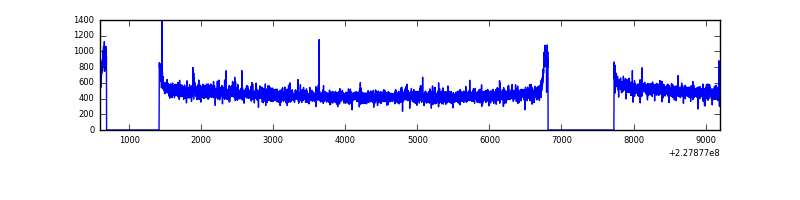 |
| D | 8608 | 6965 | 15 | 15 | 0.17% | 0.22% | 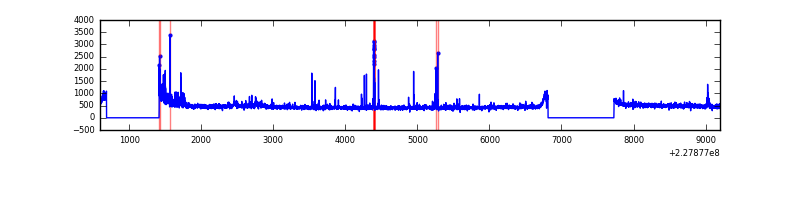 |
Top three noisy pixels from each quadrant. If the there are fewer than three noisy pixels in the level2.evt file, extra rows are filled as -1
| Pixel properties | Quadrant properties | ||||||
|---|---|---|---|---|---|---|---|
| Quadrant | DetID | PixID | Counts | Sigma | Mean | Median | Sigma |
| A | 15 | 234 | 9415 | 49.45 | 847 | 824 | 173.7 |
| A | 0 | 226 | 8065 | 41.68 | 847 | 824 | 173.7 |
| A | 12 | 194 | 7229 | 36.87 | 847 | 824 | 173.7 |
| B | 12 | 111 | 19056 | 110.25 | 848 | 828 | 165.3 |
| B | 11 | 111 | 15610 | 89.41 | 848 | 828 | 165.3 |
| B | 11 | 51 | 14982 | 85.61 | 848 | 828 | 165.3 |
| C | 1 | 16 | 30922 | 155.58 | 826 | 829 | 193.4 |
| C | 13 | 61 | 6184 | 27.68 | 826 | 829 | 193.4 |
| C | 8 | 222 | 2635 | 9.34 | 826 | 829 | 193.4 |
| D | 1 | 52 | 126492 | 630.66 | 825 | 803 | 199.3 |
| D | 2 | 136 | 52971 | 261.76 | 825 | 803 | 199.3 |
| D | 2 | 14 | 49557 | 244.63 | 825 | 803 | 199.3 |
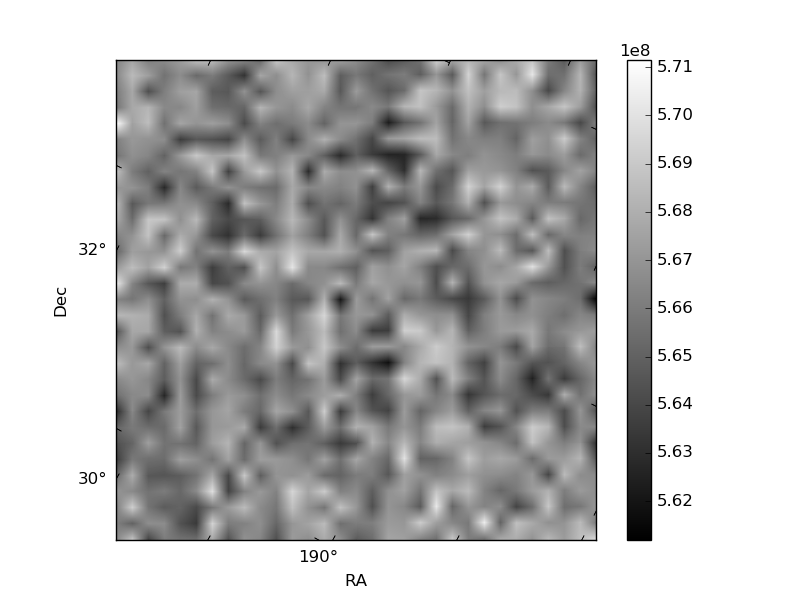
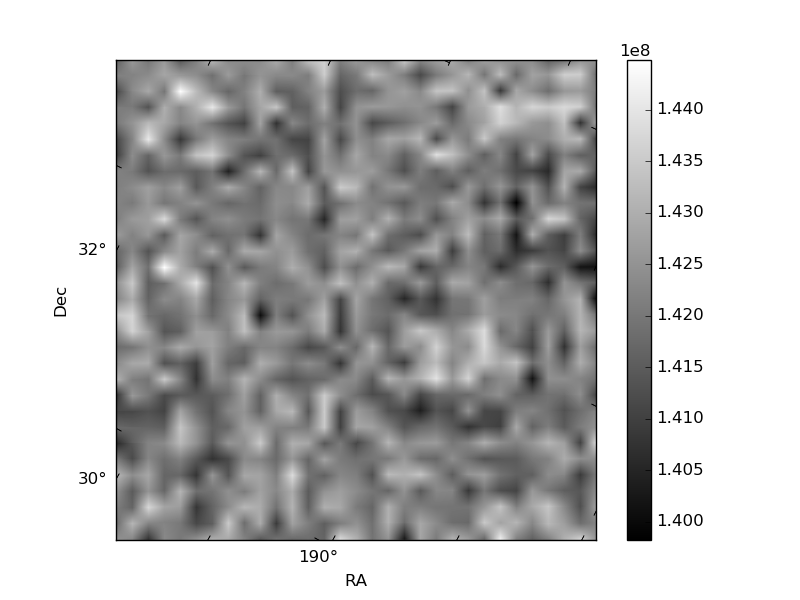
Histogram calculated using DETX and DETY for each event in the final _common_clean file
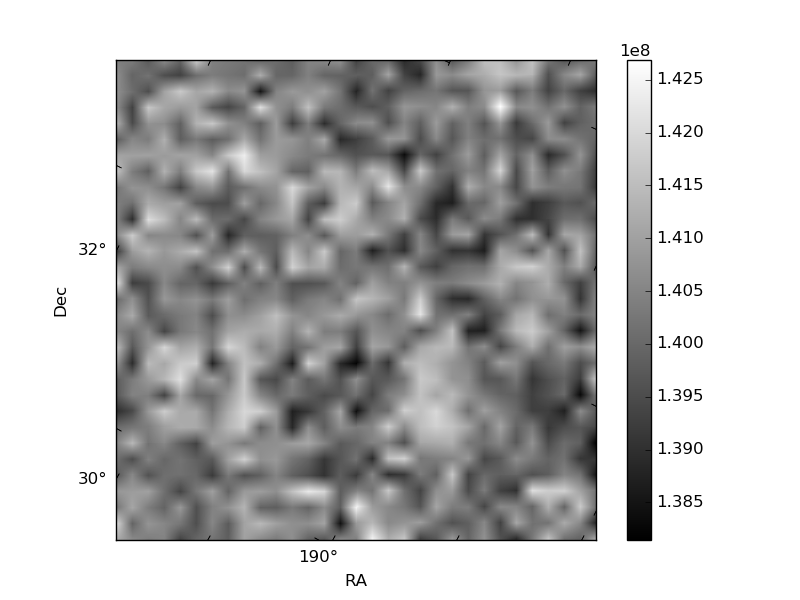
| Quadrant A | 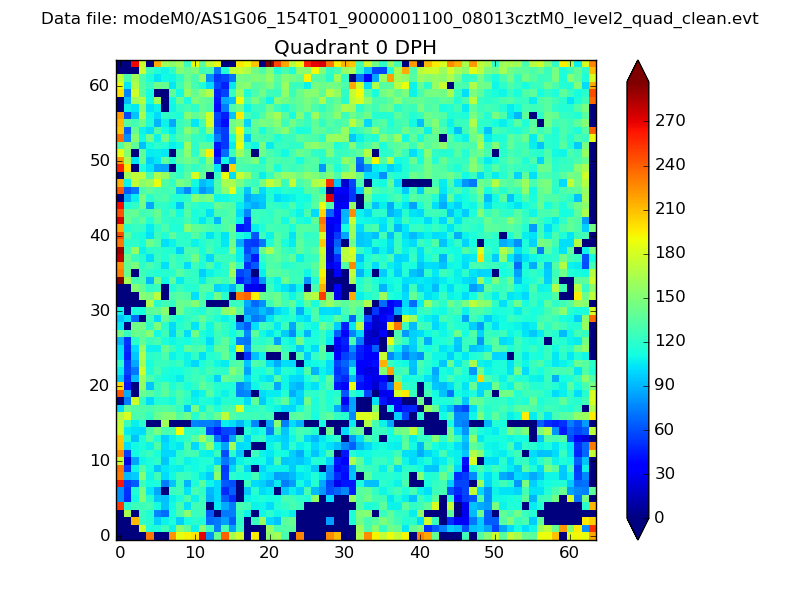 |
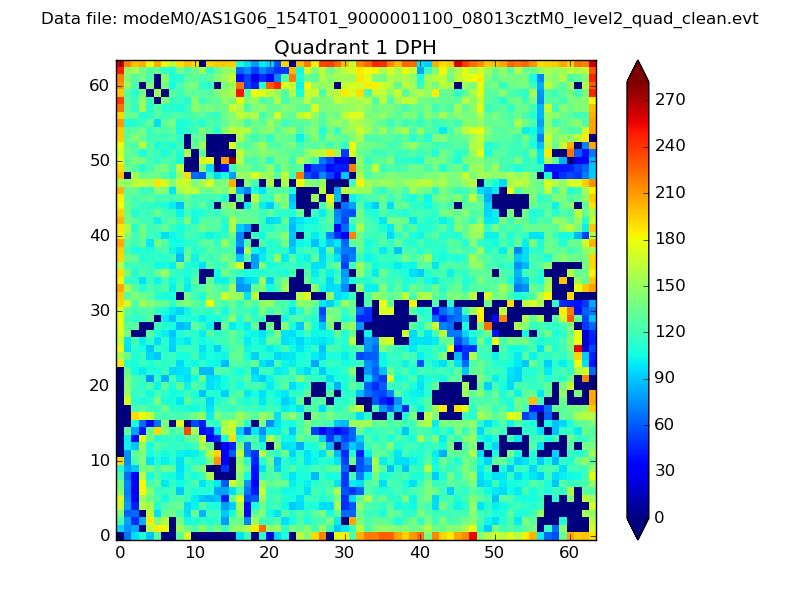 |
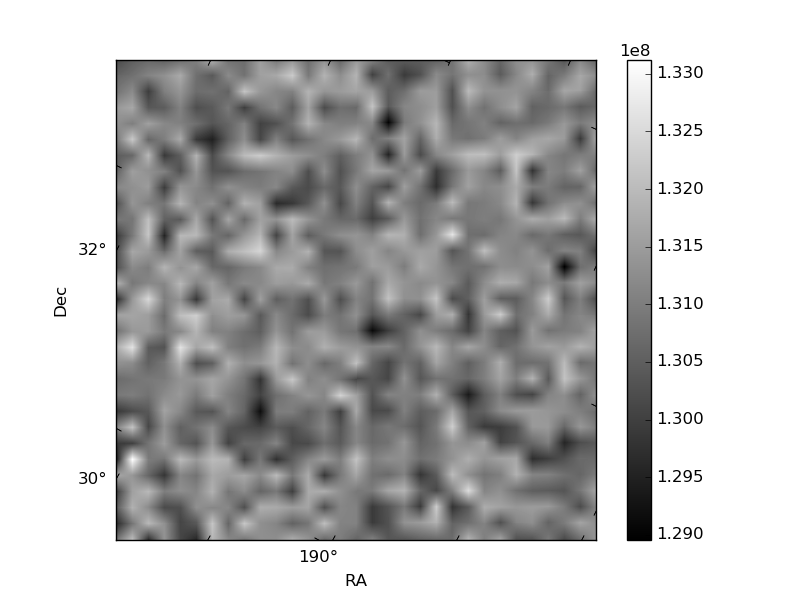
Quadrant B |
|---|---|---|---|
| Quadrant D | 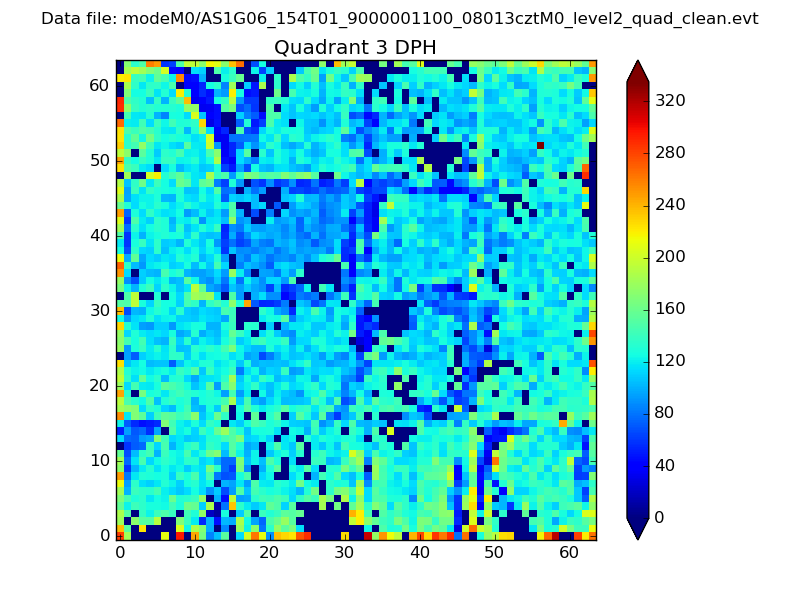 |
 |
Quadrant C |
| Plot type | Count rate plots | Images |
|---|---|---|
| Comparison with Poisson distribution Blue bars denote a histogram of data divided into 1 sec bins. Red curve is a Poisson curve with rate = median count rate of data. |
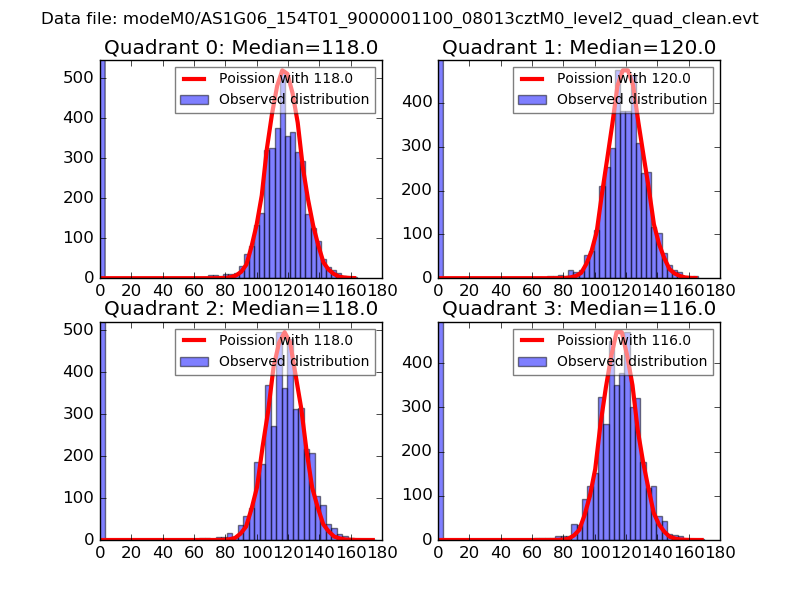 |
 |
| Quadrant-wise count rates Data is divided into 100 sec bins |
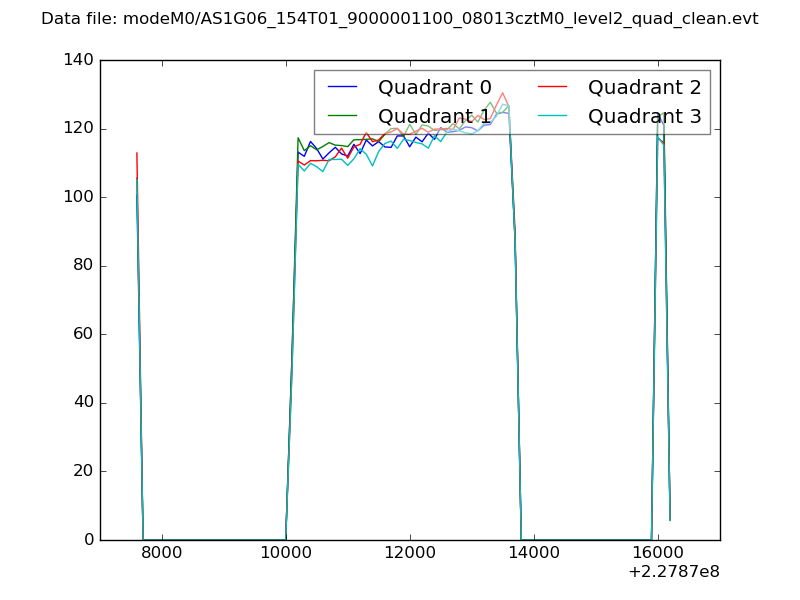 |
|
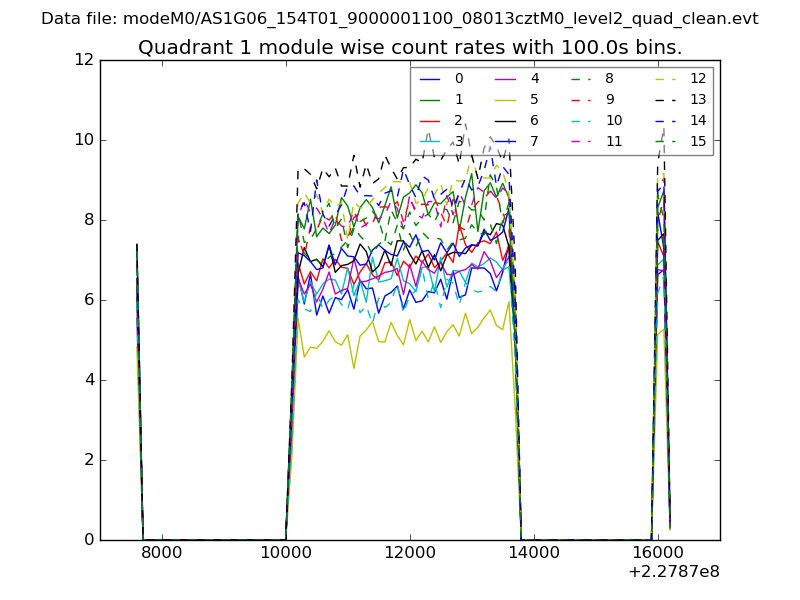
| Module-wise count rates for Quadrant A Data is divided into 100 sec bins |
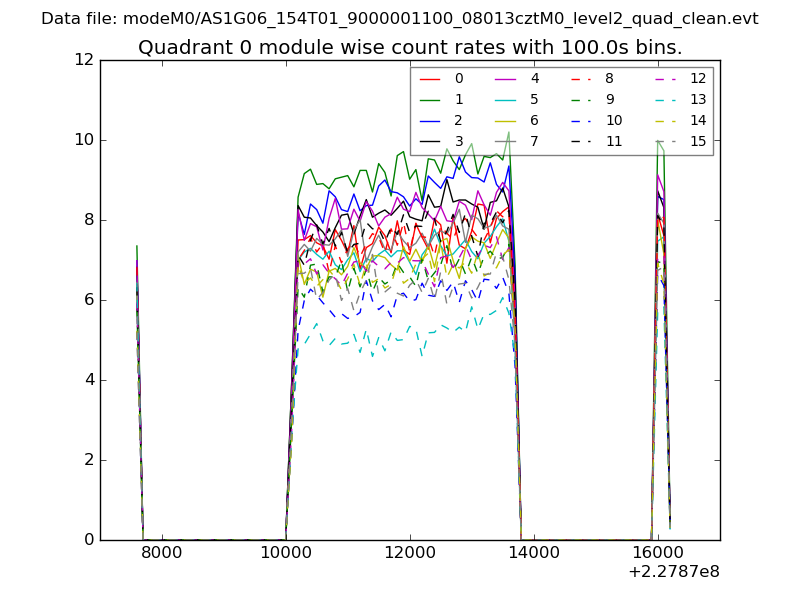 |
 |
| Module-wise count rates for Quadrant B Data is divided into 100 sec bins |
 |
 |
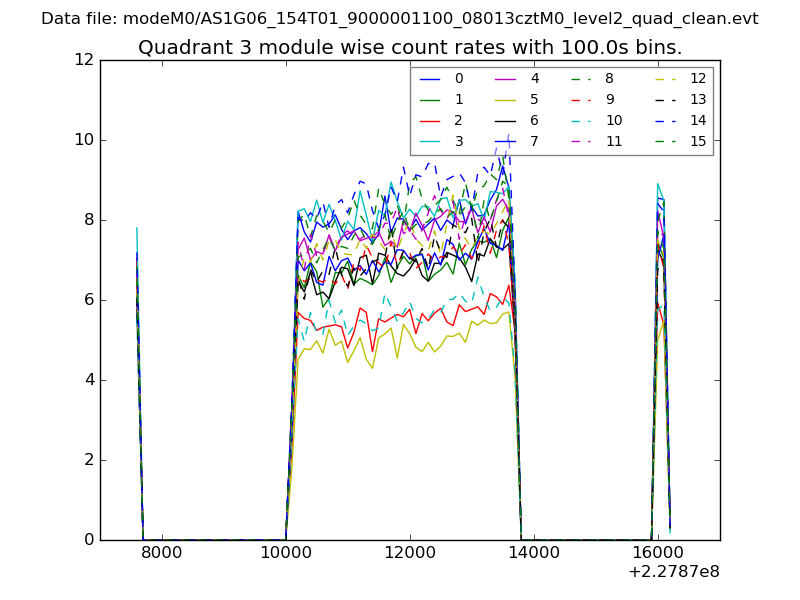
| Module-wise count rates for Quadrant C Data is divided into 100 sec bins |
 |
 |
| Module-wise count rates for Quadrant D Data is divided into 100 sec bins |
 |
 |
| Parameter | Plot |
|---|---|
| CZT HV Monitor | 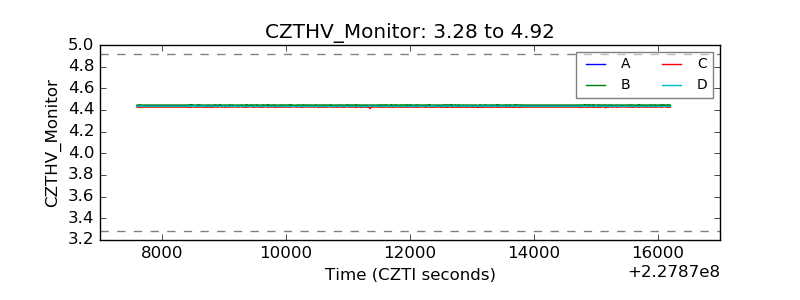 |
| D_VDD | 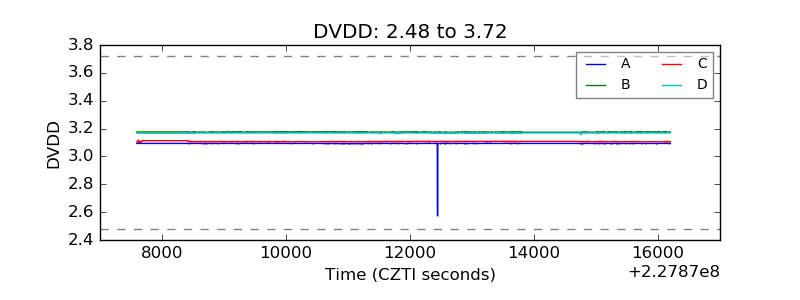 |
| Temperature 1 | 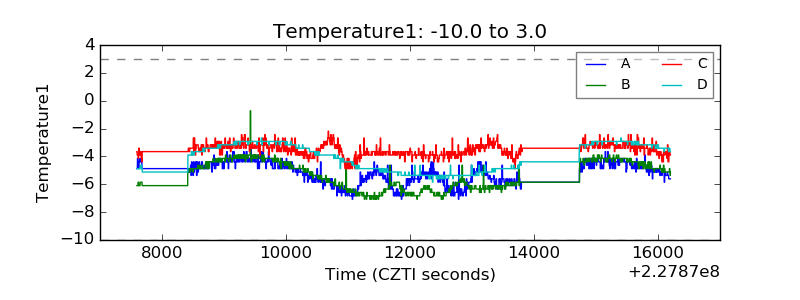 |
| Veto HV Monitor | 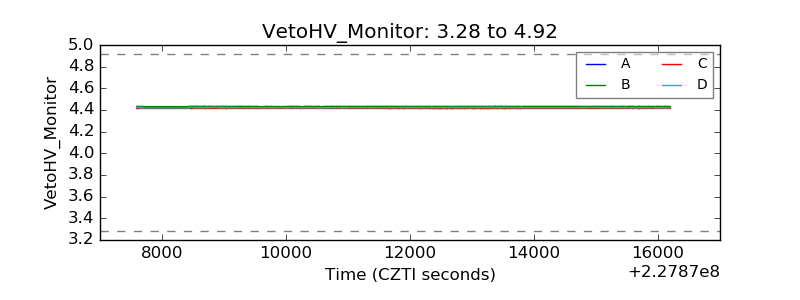 |
| Veto LLD | 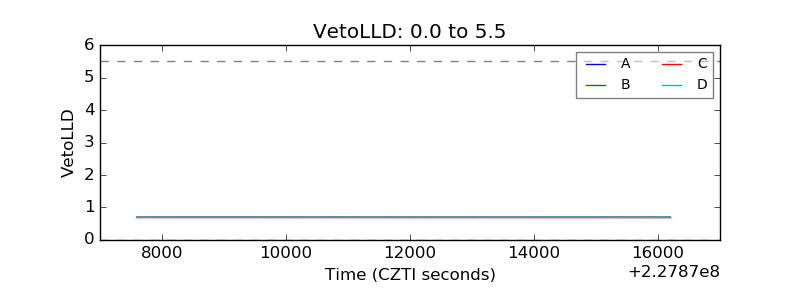 |
| Alpha Counter | 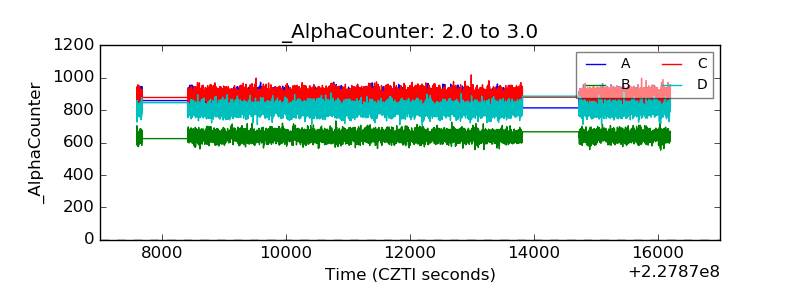 |
| _CPM_Rate | 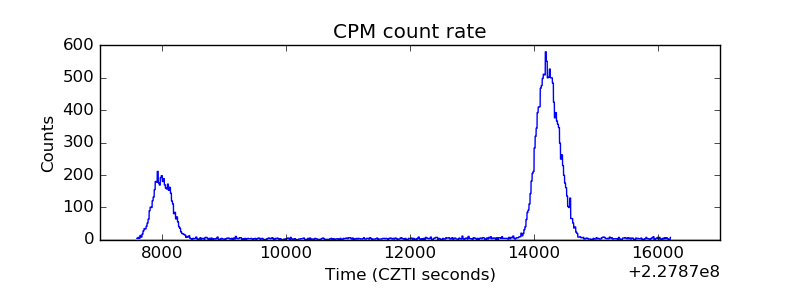 |
| CZT Counter | 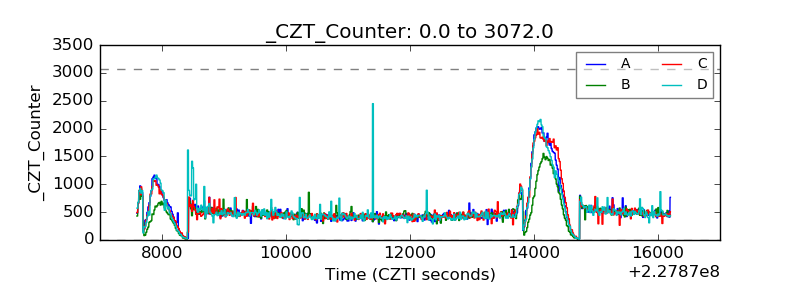 |
| +2.5 Volts monitor | 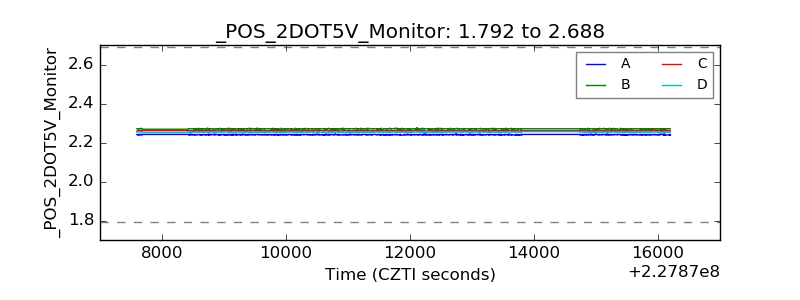 |
| +5 Volts monitor | 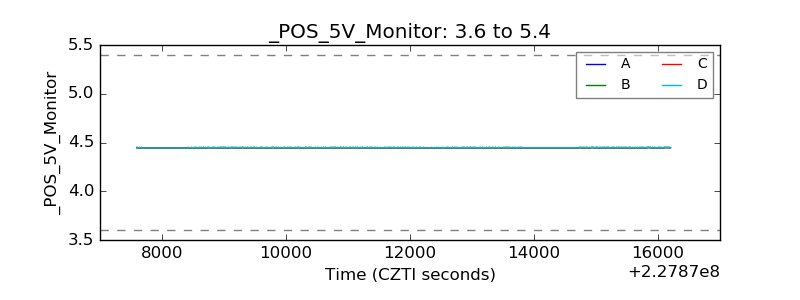 |
| _ROLL_ROT | 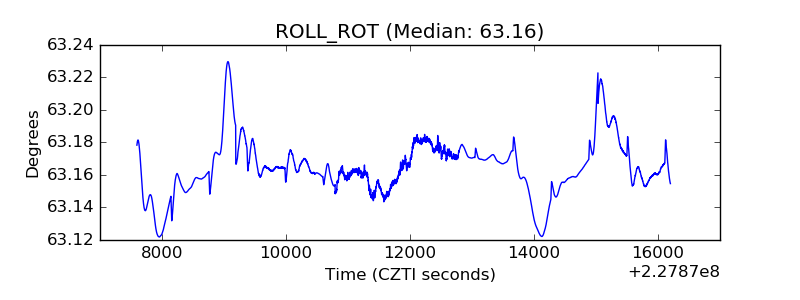 |
| _Roll_DEC | 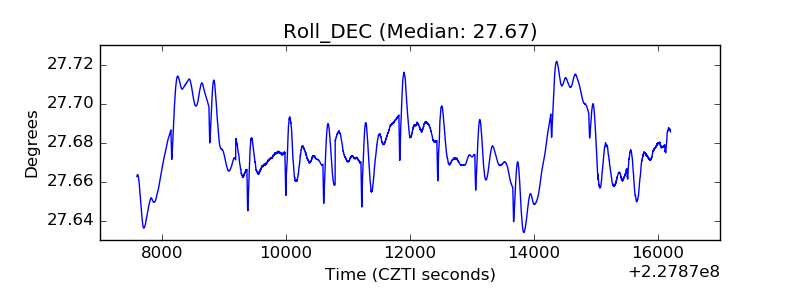 |
| _Roll_RA | 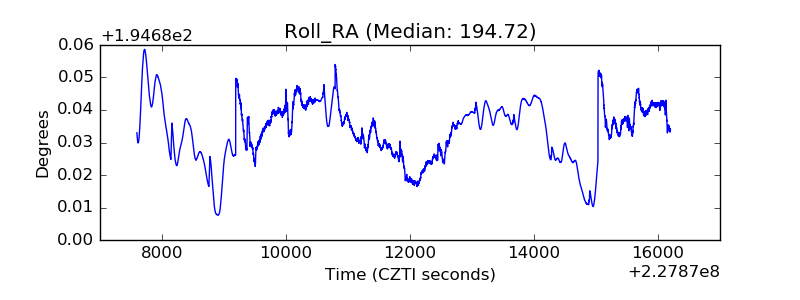 |
| Veto Counter | 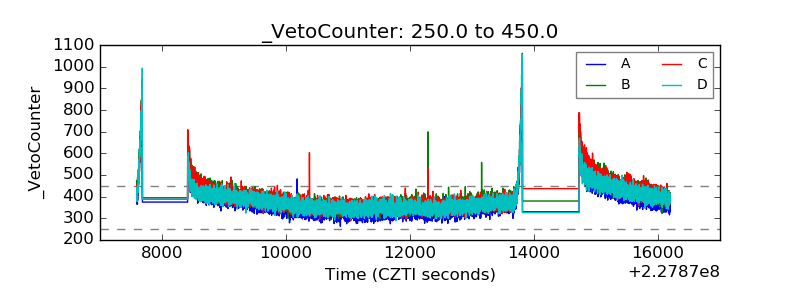 |